Abstract
Atypical adenomatous hyperplasia (AAH) is classified as a precancerous lesion of lung adenocarcinoma. We established an immortalized AAH cell line (PL16T) and a human non‐neoplastic bronchial epithelial cell line (PL16B) from the same patient by transfection with the gene for SV40 large T antigen. The expression profile of PL16T was compared with that of PL16B by the suppression subtractive hybridization method. From 704 selectively hybridized clones, we finally selected 25 fragments of mRNA that showed transcription levels more than three times higher in PL16T than in PL16B. Thirteen (52%) and eight (32%) of them encoded tumor‐associated calcium signal transducer 2 (TACSTD2) and S100 calcium binding protein A2 (S100A2), respectively. The high transcription of TACSTD2 and S100A2 in PL16T was confirmed by in situ hybridization. In normal lung tissue, both TACSTD2 and S100A2 were expressed at very low levels, but seven and five of 14 AAH were positive for TACSTD2 and S100A2, respectively. The frequency of TACSTD2 positivity was increased in 16 of 22 bronchioloalveolar carcinomas (BAC) and adenocarcinoma with mixed subtype with BAC component (mixed BAC). Positivity for S100A2 occurred in four of 22 BAC and mixed BAC. The abnormal transcription of TACSTD2 and S100A2 are thought to be unique molecular markers of the preinvasive stage of lung adenocarcinoma.(Cancer Sci 2005; 96: 668 – 675)
Lung cancer, especially adenocarcinoma, is the leading cause of cancer deaths in Japan and the United States.( 1 ) However, studies of its molecular carcinogenesis are still limited, and the 5‐year survival rate for patients with advanced lung carcinoma is less than 30%. However, with advances in radiological diagnostic techniques, many early adenocarcinoma lesions originating in the peripheral lung can be detected by multidetector computed tomography (CT) and thin‐slice CT techniques. Lesions showing ground glass opacity on CT examination correspond to precancerous lesions and in situ adenocarcinoma of the peripheral lung. To study the molecular carcinogenesis of lung adenocarcinoma, we believe it is critical to analyze lesions showing ground glass opacity on CT examination.
Atypical adenomatous hyperplasia (AAH) and bronchioloalveolar carcinoma (BAC) are diagnostic criteria included in the World Health Organization (WHO) classification (3rd edition) as precancerous lesions and in situ lesions of peripheral‐type adenocarcinoma.( 2 ) They show a pure bronchioloalveolar (lepidic) growth pattern that replaces the original alveolar pneumocytes. Most cases of AAH and BAC are composed of non‐mucinous tumor cells mimicking type II pneumocytes, and show ground glass opacity on CT examination.( 3 ) However, most cases of advanced adenocarcinoma of the peripheral lung are adenocarcinoma of mixed subtype, containing more than two of BAC, acinar subtype, papillary subtype and other components.
Noguchi et al. proposed a new histological classification of small adenocarcinoma of the lung.( 4 ) They divided adenocarcinoma into two groups. One is adenocarcinoma showing growth that replaces the original alveolar structure, and the other is adenocarcinoma that shows expansive and destructive growth of the alveolar structure. The former group is the major histology of peripheral adenocarcinoma, and is further divided three types: type A, localized bronchioloalveolar carcinoma (LBAC); type B, LBAC with alveolar collapse; and type C, LBAC with a focus of fibrotic lesion, including active fibroblastic proliferation. The latter group is further divided into three types: type D, poorly differentiated adenocarcinoma; type E, acinar adenocarcinoma; and type F, true papillary adenocarcinoma. Five‐year survival rates for patients with type A and B tumors are 100%, and these tumors are thought to be in situ adenocarcinoma. However, although type C tumors are included in the same group (i.e. the group that shows replacement growth), the 5‐year survival rate is only approximately 75%. In the WHO classification, type A and B adenocarcinoma correspond to BAC, and type C to adenocarcinoma of mixed subtype with a BAC component.
There are several reports of mutation analysis or restriction fragment length polymorphism analysis involving recessive oncogenes such as p53, p16, and Rb, and reports of mutation analysis or analysis of abnormal expression involving oncogenes such as ras, myc, erbB 2, and EGFR. ( 5 , 6 ) However, relatively little is known about the sequence of molecular events preceding the development of invasive lung adenocarcinoma.( 7 )
We succeeded in establishing an immortalized cell line of AAH (PL16T) and one of non‐tumorous normal bronchus (PL16B) from the same patient. In this study, we compared the expression profiles of the two cell lines, and identified the genes that were highly expressed in PL16T relative to PL16B. The expressions of the selected genes in surgically resected cases of AAH, BAC and invasive adenocarcinoma were also analyzed by in situ hybridization.
Materials and Methods
Primary culture of AAH and normal bronchial epithelium
The patient was a 56‐year old woman. A focal lesion with ground glass opacity was detected in right upper lobe of the lung by CT, and a simple lobectomy was performed. Small pieces of the AAH lesion and the resected end of the bronchus were excised from the surgically resected material and incubated with 0.2% collagenase and dispase (1000 U/mL) in MCDB153HAA (Nihon Seiyaku, Tokyo, Japan) without growth factors or serum for 1 h at 37°C. The dissociated cell aggregates were transferred to MCDB153HAA with epidermal growth factor, insulin, hydrocortisone, transferrin, selenium and 2% fetal calf serum (Sigma‐Aldrich, St. Louis, MO, USA), and cultured on collagen‐coated dishes.
For the transfection of SV40 large T antigen, the expression vector pRSV‐Tag was used.( 8 ) Primary cultured AAH cells were transfected with 10 µg plasmid DNA with 40 µg lipofectin according to the manufacturer's instructions (Bethesda Research Laboratories, Bethesda, MD, USA). Integration of the SV40 large T antigen gene was evaluated by Southern blot hybridization (data not shown). The immortalized AAH cell line (PL16T) and normal bronchial epithelial cell line (PL16B) were cultured on the dish and cell‐pellets were produced after formalin fixation. For the immunohistochemical analysis, 4‐µm sections were cut from the cell‐pellets. The sections were deparaffinized in xylene, rehydrated in decreasing concentrations of ethanol, and immunostained by using an automated method (Ventana Medical Systems, Tucson, AZ, USA) using anticytokeratin 7, vimentin and TTF‐1 (all from Dako Japan, Kyoto, Japan).
Suppression subtractive hybridization and differential screening
Total RNA was extracted from each cell line with 500 µL TRIzol reagent (Invitrogen, Carlsbad, CA, USA), according to the manufacturer's instructions. Separate mRNAs extracted from PL16T (passage 20) and PL16B (passage 16) were used to synthesize cDNA. Suppression subtractive hybridization (SSH) between cDNA samples of PL16T and PL16B and subsequent differential screening were performed with a Superscript Choice System (Invitrogen), a PCR‐Select cDNA Subtraction Kit and a PCR‐Select Differential Screening Kit (both from BD Bioscience Clontech, Palo Alto, CA, USA), with several modifications.( 9 ) Synthesized cDNA was digested with RsaI and ligated to adaptors supplied with the PCR‐Select cDNA Subtraction Kit. Two‐directional (forward and reverse) subtractive hybridizations and unsubtractive hybridizations were performed with PL16T and PL16B, and the subtractive hybridization products were amplified by suppression polymerase chain reaction (PCR), according to the manufacturer's instructions.
The overexpressed cDNA pool from the PL16T (forward subtracted cDNA) was cloned into the pCR2.1 vector (Invitrogen). Seven hundred and four bacterial colonies were picked‐up and amplified by PCR. The PCR products were blotted onto nylon membranes and hybridized with 32P‐labeled forward‐ and reverse‐subtracted cDNA probes and unsubtracted cDNA probes for both. Then, the PCR‐Select Differential Screening Kit (BD Bioscience Clontech) was used to screen differentially expressed clones, according to the manufacturer's instructions.
Semi‐quantitative screening of the subtracted cDNA libraries and sequence analysis
The differentially screened clones were re‐blotted onto nylon membranes, and re‐screened with probes that were the 32P‐labeled cDNAs of PL16T and PL16B. The hybridized membranes were exposed to X‐ray films and relatively evaluated against the intensity of β‐actin with the imaging densitometer (Bio‐Rad Laboratories, Hercules, CA, USA).
The selected clones were sequenced with a BigDye terminator v3.0 cycle sequencing ready reaction kit and an ABI Prism 310 genetic analyzer (both from Applied Biosystems Japan, Tokyo, Japan).
Cells and tissue samples and in situ hybridization
The two cell lines of PL16T and PL16B, 12 AAH and 34 small‐sized adenocarcinomas that were 2 cm or less in diameter, were examined for the expression of selected clones. The 46 human tumors examined were resected at University Hospital of Tsukuba (Ibaraki, Japan) between 1998 and 2004. The 34 small‐sized adenocarcinomas included 12 cases of BAC, 10 cases of adenocarcinoma of mixed subtype with BAC (mixed BAC), and 10 cases of invasive adenocarcinoma without BAC component (non‐BAC).
The overexpressed cDNAs, which had been cloned into plasmids, were amplified by PCR with T7 RNA polymerase promoter‐attached primers. Then, the PCR products were transcribed to antisense or sense cRNA probed with T7 RNA polymerase.
The cell and tissue sections for in situ hybridization were deparaffinized, rehydrated, and washed with 0.1 M phosphate buffer (pH 7.4). After treatment with proteinase K, 4% paraformaldehyde, and 0.2 N HCl, the sections were acetylated with 0.25% acetic anhydride in 0.1 M triethanolamine (pH 8.0). The sections were then washed with phosphate buffer, dehydrated in a graded ethanol series, and air‐dried. The hybridization mixture contained 50% deionized formamide, 10 mM Tris‐HCl (pH 7.6), 200 µg/mL yeast tRNA, 1× Denhardt's solution, 10% dextran sulfate, 10% NaCl, 0.25% sodium dodecylsulfate (SDS), 1 mM ethylenediamine tetraacetic acid (EDTA) (pH 8.0), and approximately 1.0 µg/mL digoxigenin‐labeled cRNA probe. Fifty microliters of the mixture was applied to each section, then the sections were covered with Parafilm, and hybridized in a humid chamber for 18 h at 50°C. Immunodetection of the in situ hybridization signal was performed with 400× alkaline phosphatase‐labeled antidigoxigenin antibody (DakoCytomation, Kyoto, Japan). For the color reaction, the slides were incubated in a solution containing nitroblue tetrazolium and 5‐bromo‐4‐chloro‐3‐indolyl phosphate (both from Sigma‐Aldrich). After being washed in water, the slides were air‐dried and mounted in Pristin Mount (Falma, Tokyo, Japan). If more than 10% of tumor cells were strongly stained, this was taken as positive staining.
Results
Two in vitro cultured cell lines, one from an AAH and another from normal bronchial epithelial cells, were established from the same surgically resected specimen. The gross appearance of the cut surface of the resected material revealed a poorly demarcated flat nodule, which measured 11 mm in diameter just below the pleura of the right lung (Fig. 1a). Histologically, the tumor cells showed replacement of alveolar lining cells, and mild thickening of the alveolar septa, but no fibrotic foci. The density of the proliferating cells was not high, and they were arranged in a single layer along the alveolar septa. The tumor was diagnosed as atypical adenomatous hyperplasia, high grade (Fig. 1b). We succeeded in establishing an AAH cell line (PL16T) and a normal bronchial cell line (PL16B) from the same patient (Fig. 2). Both cell lines were positive for anticytokeratin 7 antibody (Fig. 3a,b), and negative for antivimentin antibody. However, approximately 5% of PL16T cells were positive for anti‐TTF‐1 antibody, but PL16B was negative for the antibody (Fig. 3c,d). These results indicate that both PL16B and PL16T showed epithelial features, and that PL16T preserved the phenotype of type II pneumocytes.
Figure 1.
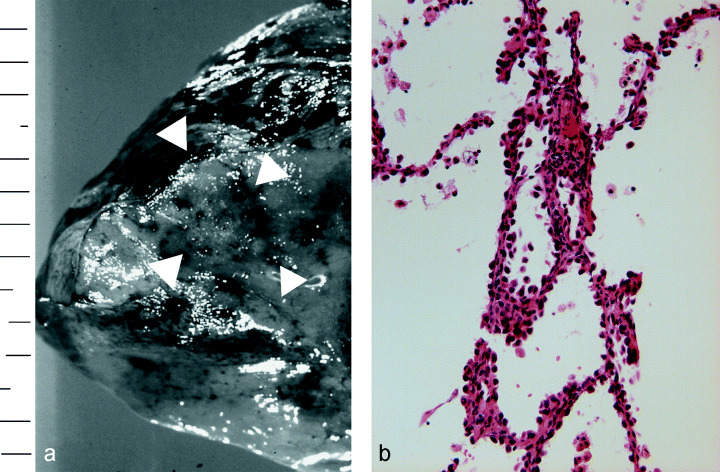
(a) Gross appearance of the resected lung. The tumor was located just below the pleura (arrowhead). (b) Histology of resected atypical adenomatous hyperplasia (H&E, ×200), which was immortalized by SV40 large T antigen.
Figure 2.
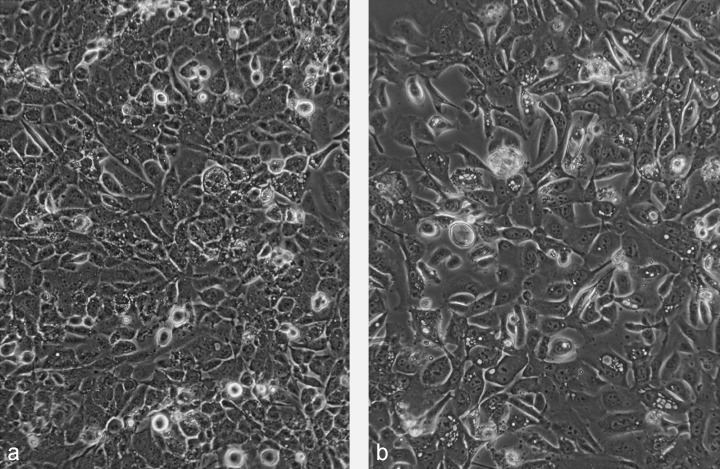
(a) Morphology of PL16T (passage 20) and (b) PL16B (passage 16). Both PL16T and PL16B had an epithelial appearance on phase‐contrast microscopy. (×100).
Figure 3.
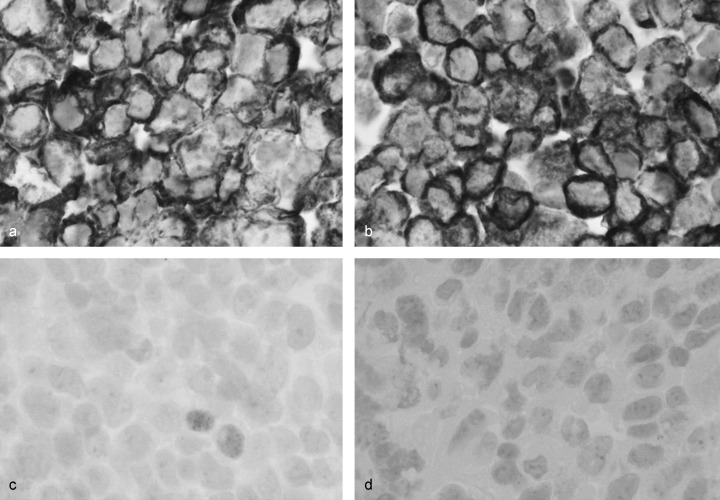
(a) PL16T and (b) PL16B were immunostained by anticytokeratin 7 and anti‐TTF‐1 antibodies. Both were positive for anticytokeratin 7. (c) Approximately 5% of cells of PL16T were positive for anti‐TTF‐1 antibody, (d) but PL16B was negative for the antibody.
To examine the difference in proliferative capacity in vitro between PL16T and PL16B, we performed a colony‐forming efficiency (CFE) assay.( 10 ) Briefly, 1500 and 3000 cells were inoculated into 60‐mm collagen‐coated dishes. After 7 or 10 days of incubation without a change of medium, the cells were fixed in 10% formalin, then stained with 0.2% crystal violet. PL16T made many colonies, but PL16B did not make any (Fig. 4). Neither PL16T nor PL16B revealed any tumorigenic potential when inoculated subcutaneously into athymic nude mice.
Figure 4.
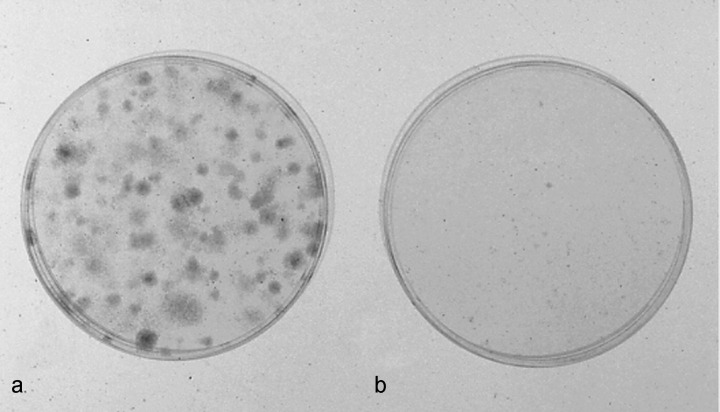
Colony‐forming efficiency (CFE) assay of cell lines PL16T and PL16B. The CFE of (a) PL16T was significantly higher than that of (b) PL16B.
The expression profile of PL16T was compared with that of PL16B by using the SSH method. Following subtraction analysis, 704 clones were randomly chosen from the forward subtracted library of PL16T versus PL16B and blotted onto nylon membranes. Positive clones were selected from those showing a conspicuous signal with the forward subtracted cDNA probe (PL16T minus PL16B) and hardly any detectable signal with the reverse subtracted cDNA probe (PL16B minus PL16T), and weak or no signals with the two kinds of unsubtracted cDNA probes. Consequently, 176 differentially expressed clones were obtained. Subsequent semiquantitative screening with the unsubtracted probes revealed 25 clones that were highly expressed in PL16T, compared with PL16B.
The 25 positive cDNA clones were sequenced (Table 1). Thirteen of these cDNAs encoded tumor‐associated calcium signal transducer 2 (TACSTD2) and eight encoded S100 calcium binding protein A2 (S100A2). Four other clones were NICE‐3 protein, H3 histone family 3A, tumor‐associated calcium signal transducer 1, and DKFZp686G1675. The PL16T/PL16B expression ratios of TACSTD2 and S100A2 were three to 20 and three to > 100, respectively, but the ratios of the other selected clones were three or four (Table 1). We consider that TACSTD2 and S100A2 are the major highly expressed genes in PL16T, an immortalized cell line of AAH.
Table 1.
Summary of cDNA clones that were highly expressed in PL16T cells
| Description | No. clones selected | Expression ratio of PL16T/PL16B |
|---|---|---|
| TACSTD2 | 13 | 3–20 |
| S100 A2 | 8 | 3–>100 |
| NICE‐3 protein | 1 | 3 |
| H3 histone, family 3A | 1 | 4 |
| TACSTD1 | 1 | 3 |
| DKFZp68G1675 | 1 | 3 |
TACSTD, tumor‐associated calcium signal transducer; PL16T, immortalized cell line of atypical adenomatous hyperplasia; PL16B, immortalized cell line of normal bronchial cells.
Expression of mRNAs for TACSTD2 and S100A2 was confirmed by in situ hybridization with formalin‐fixed, paraffin‐embedded cell pellets of PL16B and PL16T. Signals for TACSTD2 and S100A2 were detected in the cytoplasm of PL16T, but not in PL16B (Fig. 5). The expression of the two genes in normal lung and human lung adenocarcinomas was also examined using 46 resected specimens (6, 7). In normal lung, both TACSTD2 and S100A2 showed very little expression. As Table 2 indicates, seven and five of 14 AAH were positive for TACSTD2 and S100A2, respectively. The frequency of TACSTD2 positivity was increased in eight of 12 BAC and eight of 10 mixed BAC. The frequency of S100A2 positivity was two of 12 BAC and two of 10 mixed BAC. There were no characteristic histological differences between specimens that were negative for both TASCTD2 and S100A2. However, the frequencies of cases that were positive for TACSTD2 and S100A2 were four and three of 10 non‐BAC, respectively.
Figure 5.
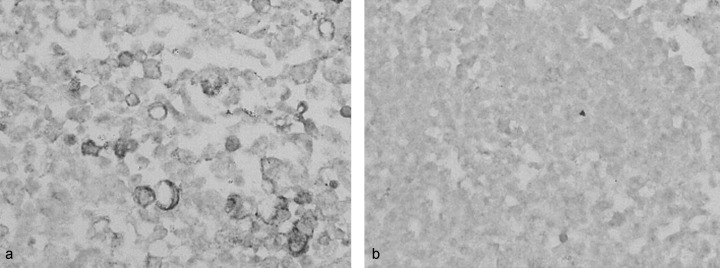
In situ hybridization of TACSTD2 (antisense probe) on (a) PL16T and (b) PL16B. PL16T showed significantly higher transcription than PL16B (×100).
Figure 6.

In situ hybridization of TACSTD2 (antisense probe) for atypical adenomatous hyperplasia (AAH) and adenocarcinomas. The cytoplasm of more than 50% of tumor cells of (a) AAH, (b) bronchioloalveolar carcinomas (BAC), and (c) mixed BAC reacted positively against an antisense probe of TACSTD2. BAC, bronchioloalveolar carcinoma (types A and B); mixed BAC, adenocarcinoma mixed subtype with BAC component (type C).
Figure 7.

In situ hybridization of S100A2 (antisense probe) for adenocarcinomas. The cytoplasm of 30–40% of tumor cells of (a) bronchioloalveolar carcinomas (BAC) reacted positively against an antisense probe of S100A2, but those of (b) mixed BAC were negative. BAC, bronchioloalveolar carcinoma (types A and B); mixed BAC, adenocarcinoma mixed subtype with BAC component (type C).
Table 2.
In situ hybridization analysis of the expression of TACSTD2 and S100A2 in atypical adenomatous hyperplasia (AAH) and small‐sized adenocarcinoma of the lung
| No. cases | TACSTD2 (%) | S100A2 (%) | |
|---|---|---|---|
| AAH | 14 | 7 (50) | 5 (36) |
| BAC (type A and B) | 12 | 8 (67) | 2 (17) |
| Mixed BAC (type C) | 10 | 8 (80) | 2 (20) |
| Non‐BAC (type D, E, F) | 10 | 4 (40) | 3 (30) |
| Total | 46 | 27 (59) | 12 (26) |
TACSTD2, tumor‐associated calcium signal transducer 2; BAC, bronchioloalveolar carcinoma; mixed BAC, adenocarcinoma of mixed subtype with BAC component; non‐BAC, adenocarcinoma without BAC component; type A, B, C, D, E, and F, see definitions in Materials and Methods section. If more than 10% of tumor cells were strongly stained, this was taken as positive staining.
Discussion
We succeeded in establishing immortalized AAH and normal bronchial cell lines, PL16T and PL16B, using transfection with the gene for SV40 large T antigen. Both cell lines showed epithelial features, and PL16T interestingly preserved the phenotypic character of type II pneumocytes. Although neither PL16T nor PL16B revealed any tumorigenic activity when inoculated subcutaneously into athymic nude mice, they showed different biological characteristics on CFE assay. PL16T was able to make many colonies in a collagen‐coated dish, but PL16B could not. From these results, we concluded that the two cell lines are a useful model for analyzing the biological characteristics of AAH cells. However, there are two critical problems with this hypothesis. One is that these cell lines were immortalized by SV40 large T antigen, and that their expression profiles were modified by this artificial intervention. The other is that the progenitor cells of peripheral‐type lung adenocarcinoma are thought to be type II pneumocytes or Clara cells, but the normal counterpart (PL16B) was immortalized from normal bronchial cells. Despite these limitations, PL16T and PL16B were similarly immortalized cell lines using the same expression vector, pRSV‐Tag, and showed different biological characteristics. Therefore, we consider that the two cell lines would be comparable using SSH.
Following the SSH analysis, we selected 25 genes that were expressed selectively in PL16T relative to PL16B. The expression ratio between PL16T versus PL16B varied from 3 to > 100. Although most of the selected clones were detected once and the expression ratio was three or four, TACSTD2 and S100A2 were frequently detected, and the expression ratios were 20 and > 100, respectively. The high transcription levels of these genes in PL16T was confirmed by in situ hybridization. Therefore, we considered TACSTD2 and S100A2 to be highly expressed genes in AAH.
TACSTD2 is a monomeric transmembrane glycoprotein and is expressed at high levels by several human carcinomas and placental cytotrophoblasts.( 11 , 12 ) TACSTD2 is essentially identical to Trop‐2, EGP‐1, and GA733‐1, and homologous to Trop‐1, KSA, and GA733‐2. The cytoplasmic tail of this gene possesses potential serine and tyrosine phosphorylation sites and a phosphatidyl‐inositol binding consensus sequence, and so TACSTD2 is thought to be a functional signaling molecule. However, expression analyses of TACSTD2 in various carcinomas are limited, compared with TACSTD1, which is a cell–cell adhesion molecule called Ep‐CAM and is selectively expressed in many carcinomas.( 13 , 14 , 15 ) In this study, we found that TACSTD2 was expressed in more than 50% of AAH and small‐sized adenocarcinomas. Interestingly, expression frequency increased from 50% in AAH to 80% in mixed BAC, which corresponds to type C adenocarcinoma according to Noguchi's classification. We could not find any histological differences between adenocarcinomas positive and negative for TACSTD2. TACSTD2 was selectively expressed at an early stage in peripheral‐type adenocarcinoma, and the high expression level was preserved during stepwise progression.
S100A2 is a member of the S100 gene family, and is located on chromosome 1q21.( 16 ) Unlike the other S100 proteins, which are cytoplasmic proteins, S100A2 is located in the cell nucleus, but the mechanism of action of S100A2 is unclear. In normal cells, S100A2 expression is regulated during the cell cycle; its level increases as cells enter the S phase and it is induced by growth factors in early G1 phase. S100A2 has been described as a potential tumor suppressor gene that is downregulated in a number of tumors such as breast and head and neck carcinomas.( 17 ) However, tumors such as ovarian cancer, melanoma, gastric cancer and epithelial tumors of the skin overexpress S100A2.( 18 , 19 ) In lung carcinomas, reports about the expression of S100A2 are contradictory. Feng et al. reported that S100A2 is downregulated in tumorigenic cell line 1170–1, compared with normal human bronchial epithelium (NHBE), and it was thought to be a putative tumor suppressor gene.( 20 ) Heighway et al. examined the expression profiling of non‐small cell lung carcinoma and found that S100A2 was strongly expressed in most tumors.( 21 ) In the present study, we found higher expression levels of S100A2 in PL16T (AAH cell line) than in PL16B (normal bronchial epithelium cell line). By using in situ hybridization, high expression of the gene was detected in 36% of AAH cases, but the expression tended to be lower at later stages. We speculate that expression of S100A2 is upregulated at the very early stage of adenocarcinoma and decreases during cancer progression. In either case, the frequency (36%) is limited and the biological importance of this gene in adenocarcinogenesis in the lung is still under debate.
Our study indicated that TACSTD2 and S100A2 are two abnormally highly expressed genes in AAH, and that their expression levels are preserved until the lesion progresses to BAC and more invasive stages. Therefore, the two genes are closely involved in the early stages of human lung adenocarcinogenesis, and are unique markers of preinvasive lesions of lung adenocarcinoma. To elucidate the role of the two genes in the stepwise progression of peripheral‐type lung adenocarcinoma, in vitro functional analyses should be performed.
Acknowledgment
This work was supported in part by a Grant‐in‐Aid for Cancer Research (16–1) from the Ministry of Health, Labour and Welfare of Japan.
References
- 1. Travis WD, Lubin J, Ries L, Devesa S. United States lung carcinoma incidence trends: declining for most histologic types among males, increasing among females. Cancer 1996; 77: 2464–70. [DOI] [PubMed] [Google Scholar]
- 2. Travis WD, Colby TV, Corrin B, Shimosato Y, Brambilla E, eds. Histological Typing of Lung and Pleural Tumours, 3rd edn. Berlin: Springer Verlag, 1999. [Google Scholar]
- 3. Anami Y, Matsuno Y, Yamada T et al. A case of double primary adenocarcinoma of the lung with multiple atypical adenomatous hyperplasia. Pathol Int 1998; 48: 634–40. [DOI] [PubMed] [Google Scholar]
- 4. Noguchi M, Morikawa A, Kawasaki M et al. Small adenocarcinoma of the lung: histologic characteristics and prognosis. Cancer 1995; 75: 2844–52. [DOI] [PubMed] [Google Scholar]
- 5. Kosaka T, Yatabe Y, Endoh H, Kuwano H, Takahashi H, Mitsudomi T. Mutations of the epidermal growth factor receptor gene in lung cancer: biological and clinical implications. Cancer Res 2004; 64: 8919–23. [DOI] [PubMed] [Google Scholar]
- 6. Tanaka R, Wang D, Morishita Y et al. Loss of function of p16 gene and prognosis of pulmonary adenocarcinoma. Cancer 2005; 103: 608–15. [DOI] [PubMed] [Google Scholar]
- 7. Aoyagi Y, Yokose T, Minami Y et al. Accumulation of losses of heterozygosity and multistep carcinogenesis in pulmonary adenocarcinoma. Cancer Res 2001; 61: 7950–4. [PubMed] [Google Scholar]
- 8. Noguchi M, Hirohashi S. Cell lines from non‐neoplastic liver and hepatocellular carcinoma tissue from a single patient. In Vitro Cell Dev Biol 1996; 32: 135–7. [DOI] [PubMed] [Google Scholar]
- 9. Okubo C, Morishita Y, Minami Y et al. Phenotypic characteristics of mouse lung adenoma induced by 4‐(methylnitrosamina)‐1‐(3‐pyridyl)‐1‐butanone. Mol Carcinogenesis 2005; 42: 121–6. [DOI] [PubMed] [Google Scholar]
- 10. Noguchi M, Murakami M, Bennett W et al. Biological consequences of overexpression of a transfected c‐erbB2 gene in immortalized human bronchial epithelial cells. Cancer Res 1993; 53: 2035–43. [PubMed] [Google Scholar]
- 11. Ripani E, Sacchetti A, Corda D, Alberti S. Human Trop‐2 is a tumor‐associated calcium signal transducer. Int J Cancer 1998; 76: 671–6. [DOI] [PubMed] [Google Scholar]
- 12. Mangino G, Capri MG, Barnaba V, Alberti S. Presentation of native Trop‐2 tumor antigens to human cytotoxic T lymphocytes by engineered antigen‐presenting cells. Int J Cancer 2002; 101: 353–9. [DOI] [PubMed] [Google Scholar]
- 13. Fradet Y, Cordon‐Cardo C, Thomson T et al. Cell surface antigens of human bladder cancer defined by mouse monoclonal antibodies. Proc Natl Acad Sci USA 1984; 81: 224–8. [DOI] [PMC free article] [PubMed] [Google Scholar]
- 14. Miotti S, Canevari S, Menard S et al. Characterization of human ovarian carcinoma‐associated antigens defined by novel monoclonal antibodies with tumor‐restricted specificity. Int J Cancer 1987; 39: 297–303. [DOI] [PubMed] [Google Scholar]
- 15. Alberti S, Nutini M, Herzenberg LA. DNA methylation prevents the amplification of TROP1, a tumor‐associated cell surface antigen gene. Proc Natl Acad Sci USA 1994; 91: 5833–7. [DOI] [PMC free article] [PubMed] [Google Scholar]
- 16. Diederichs S, Bulk E, Steffen B et al. S100 family members and trypsinogens are predictors of distant metastasis and survival in early‐stage non‐small cell lung cancer. Cancer Res 2004; 64: 5564–9. [DOI] [PubMed] [Google Scholar]
- 17. Liu D, Rusland PS, Sibson DR, Platt‐Higgins A, Barraclough R. Expression of calcium‐binding protein S100A2 in breast lesions. Br J Cancer 2000; 83: 1473–9. [DOI] [PMC free article] [PubMed] [Google Scholar]
- 18. El‐Rifai W, Moskaluk CA, Abdorabbo MK et al. Gastric cancers overexpress S100A calcium‐binding proteins. Cancer Res 2002; 62: 6823–6. [PubMed] [Google Scholar]
- 19. Lee SW, Tomasetto C, Swisshelm K, Keyomarsi K, Sager R. Down‐regulation of a member of the S100 gene family in mammary carcinoma cells and reexpression by azadeoxycytidine treatment. Proc Natl Acad Sci USA 1992; 89: 2504–8. [DOI] [PMC free article] [PubMed] [Google Scholar]
- 20. Feng G, Xu X, Youssef EM, Lotan R. Diminished expression of S100A2, a putative tumor suppressor, at early stage of human lung carcinogenesis. Cancer Res 2001; 61: 7999–8004. [PubMed] [Google Scholar]
- 21. Heighway J, Knapp T, Boyce L et al. Expression profiling of primary non‐small cell lung cancer for target identification. Oncogene 2002; 21: 7749–63. [DOI] [PubMed] [Google Scholar]


