

Abstract
The role of tumor cells in synthesizing pro‐inflammatory molecules is still controversial. Here we report that hypoxic treatment of the MCF‐7 human mammary adenocarcinoma cell line induced activation of hypoxia‐inducible factor 1α (HIF‐1α) and nuclear factor‐kappa B (NF‐κB). Importantly, hypoxia regulated expression of alarmin receptors such as the receptor for advanced glycation end products (RAGE) and the purinoreceptor (P2X7R), and up‐regulated inflammatory response (IR) genes such as the inducible enzymes nitric oxide synthase (NOS2), cycloxygenase (COX2), and the acute‐phase protein pentraxin‐3 (PTX3). Hypoxia also stimulated chemokine (C‐X‐C motif) receptor 4 (CXCR4) mRNA synthesis. In fact, the CXCR4 ligand stromal‐derived factor‐1α (SDF‐1α) increased invasion and migration of hypoxic MCF‐7 cells. Inhibition of HIF‐1α by chetomin and NF‐κB by parthenolide reduced mRNA and protein expression of the studied molecules and prevented invasion of hypoxic MCF‐7 cells. Moreover, solid invasive mammary tumor microenvironment was analyzed after laser‐capture microdissection (LCMD) comparing tumor versus host normal tissue. Nuclear translocation of HIF‐1α and NF‐κB and up‐regulation of IR, CXCR4, estrogen receptor α (ERα), and epithelial growth factor receptor (EGFR) was observed in tumor but not in host normal tissue in the absence of a local inflammatory leukocyte infiltrate. We conclude that under hypoxic conditions MCF‐7 cells acquire a pro‐inflammatory phenotype, and that solid human mammary carcinoma evidenced a similar activation of HIF‐1α, NF‐κB, and IR genes in malignant tumor cells as compared to the normal host tissues. We suggest a role for IR activation in the malignant progression of transformed cells.
(Cancer Sci 2010; 101: 1014–1023)
The precise role and the contribute of hypoxia, inflammation, and specific microenvironmental factors as well as the signaling pathways involved in the acquisition of the malignant phenotype is still unclear. Two recent papers suggested a link between hypoxia and activation of nuclear factor‐kappa B (NF‐κB), leading to a pro‐inflammatory phenotype of tumor cells that, in turn, could explain the acquisition of biological properties of malignant phenotype.( 1 , 2 ) In addition, a single pro‐inflammatory NF‐κB‐dependent pathway has been suggested to contribute to the acquisition of some specific malignant properties.( 3 , 4 , 5 , 6 ) Our previous( 2 ) and present work would suggest that more NF‐κB‐dependent genes and their signaling pathways harmonically contribute to the acquisition of a malignant phenotype in previously transformed cells.
Hypoxia occurs while the early tumor (transformed cells) is growing in the absence of neoangiogenesis. Hypoxia has two important consequences: gene expression adaptation, following activation of hypoxia‐inducible factor 1α (HIF‐1α) and necrosis of cells that are distant from blood supply. The first aspect includes increased expression of vascular endothelial growth factors (VEGFs) and their receptors,( 7 ) change in energy metabolism,( 8 ) up‐regulation of receptor for advanced glycation end products (RAGE),( 9 ) and activation of NF‐κB.( 10 ) The necrosis causes a release of intracellular alarmins also called damage‐associated molecular patterns (DAMPs). In both cases a strong activation of NF‐κB occurs that triggers the inflammatory response.( 11 )
In recent years, however, a number of concurrent observations suggest that tumor cells themselves express molecules of the inflammatory response (IR) and that this new expression may explain various facets of tumor progression. In fact, NF‐κB is activated in a number of human tumors.( 12 ) Cytokines, chemokines and their receptors, such as chemokine (C‐X‐C motif) receptor 4 (CXCR4), are constitutively produced by some tumors.( 13 , 14 ) Pro‐inflammatory inducible enzymes, such as cycloxygenase (COX2), nitric oxide synthase (NOS2), and 5‐Lipoxygenase (5‐LOX), may be present in the tumor and precancerous proliferative lesions. Their expression, normally controlled by NF‐κB, correlates with the tumor progression to malignancy.( 15 , 16 , 17 )
A family of inducible NF‐κB‐dependent proteins are the acute‐phase proteins. These specific markers of IR include the soluble circulating small molecules like C reactive protein (CRP) and serum amyloid protein (SAA) and members of tissue‐pentraxin or long pentraxin‐3 (PTX3). PTX3 is produced and exposed on tissue cells and is considered a mediator of innate immunity and inflammation.( 18 ) Transgenic mice overexpressing PTX3 had an increased inflammatory response.( 19 ) However, although it is well known that CRP is increased in tumor‐bearing patients probably because of the inflammatory reaction to the tumor presence, nobody has explored if the production of long‐pentraxins and other acute phase proteins could be also due to the tumor cells themselves in the presence of activated NF‐κB.
Finally, little information is available on the presence and function of alarmin receptors in tumors. These receptors recognize exogenous molecules also called DAMPs such as High Mobility Group Box 1 (HMGB1) and ATP/ADP, and chemical foreign patterns (bacteria, fungi, viruses), generating a pathway activating NF‐κB.( 11 ) Their expression is under control of various signals, including cytokines and transcription factors, such as NF‐κB, and HIF‐1α.( 9 , 20 ) RAGE is in fact the receptor for HMGB1 and has been recently described in some human tumors and associated with tumor progression.( 21 ) However, it is unknown if other alarmin receptors, other than RAGE, are present in tumors, how their expression is regulated in tumor cells, and if their amount correlates with malignant progression.
Here we show that in MCF‐7 cells hypoxia induced an up‐regulation of alarmin receptors (P2X7R and RAGE), followed by an activation of NF‐κB. At the same time a panel of pro‐inflammatory genes, usually controlled by NF‐κB, was up‐regulated. Importantly, silencing of HIF‐1α in MCF‐7 cells resulted in a decreased nuclear accumulation of NF‐κB. We have also observed a gain of invasive and migratory function which paralleled with an up‐regulation of CXCR4. Importantly, we have also analyzed, by laser‐capture microdissection (LCMD), the microenvironment of human invasive mammary carcinoma, comparing tumor tissue versus host normal tissue from the same patient. We have shown the presence of hypoxic conditions with activation of HIF‐1α and NF‐κB, up‐regulation of alarmin receptors RAGE and P2X7R, increased expression of inducible pro‐inflammatory enzymes (COX2, NOS2), tissue long pentraxin‐3 (PTX3), and survival and growth factors (estrogen receptor α [ERα], epithelial growth factor receptor [EGFR]).
This has led us to suggest that hypoxic tumor cells may develop a coordinated pro‐inflammatory gene response which is very similar to that of alarmin‐activated leukocytes leading to a phenotype showing many aspects of the malignant invasive and metastasizing cell.
Materials and Methods
Cell cultures. The MCF‐7 human breast adenocarcinoma cell line (LGC Promochem, Milan, Italy) was maintained in 75‐cm2 polystyrene flasks (Corning Costar, Oneonta, NY, USA) with RPMI‐1640 medium (Mediatech, Herndon, VA, USA), containing 100 U/mL penicillin, 0.1 mg/mL streptomycin, and 10% heat‐inactivated fetal bovine serum. Cells were maintained in 5% CO2/95% air.
Treatment protocols and antibodies. The following primary antibodies were used: mouse anti‐HIF‐1α, mouse anti‐IκB‐α, mouse anti‐Lamin A/C, mouse anti‐CXCR4 (BD Bioscience, San Jose, CA, USA), rabbit anti‐NOS2, mouse anti‐ERα, mouse anti‐EGFR, mouse anti‐CD45, rabbit anti‐P2X7R, goat anti‐RAGE, rabbit anti‐NF‐κB p65, (Santa Cruz Biotechnology, Santa Cruz, CA, USA), rabbit anti‐PTX3 (Alexis Biochemical, San Diego, CA, USA), rabbit anti‐COX2 (Cayman Chemical, Ann Arbor, MI, USA), and mouse anti‐β‐actin (Sigma‐Aldrich, St. Louis, MO, USA). The following secondary antibodies were used: mouse antirabbit Alexa 488, goat antirabbit Alexa 594 (Invitrogen‐Molecular Probes, Eugene, OR, USA), mouse antirabbit HRP, goat antimouse HRP (Amersham Biosciences, Piscataway, NJ, USA), and donkey anti‐goat HRP (Santa Cruz Biotechnology).
Chetomin (Alexis Biochemical) was used at a final concentration of 50 nm and added 16 h before hypoxia treatment. Parthenolide (Sigma‐Aldrich) was used at a final concentration of 5 μm. Recombinant human stromal derived factor‐1α (SDF‐1α) (Thermo Fisher Scientific, Rockford, IL, USA) was used at a final concentration of 100 ng/mL. Propidium iodide (PI) (Invitrogen‐Molecular Probes) was used at a final concentration of 500 nm.
Hypoxia. Hypoxic conditions were achieved by incubating cells in a hypoxia chamber (Billups‐Rothenberg, Del Mar, CA, USA) where a 1% oxygen mix was flushed in for 4 min according to the manufacturer’s instructions.
Isolation of cytosol and nuclear fractions. Cells (2 × 10⁶) were plated in 100 mm dishes. The nuclear and cytosolic fractions were isolated using the nuclear extraction kit from Active Motif (Carlsbad, CA, USA) following the manufacturer’s instructions as previously described.( 22 )
ELISA assay. Nuclear and cytoplasmic extracts were obtained as described above and used to measure the relative amount of HIF‐1α and NF‐κB p65 using the TransAM kit from Active Motif and following the manufacturer’s instructions. Briefly, equivalent amounts of protein from nuclear and cytoplasmic extracts were loaded on a 96‐well plate coated with oligonucleotides containing HIF‐1α or NF‐κB responsive elements. After 1‐h incubation at room temperature, wells were washed three times in wash buffer and incubated for 1 h with a primary antibody at room temperature. Subsequently, wells were washed and incubated for 1 h with HRP‐conjugated secondary antibody followed by the addition of a developing solution. A stop solution was added to block the reaction and the color intensity was read in a plate reader with a 450 nm filter. The color intensity in each well was proportional to the amount of the transcription factor bound to the oligonucleotides.
Immunofluorescence and confocal analysis. Cells were plated on 35‐mm glass bottom dishes (MatTek, Ashland, MA, USA) in complete medium and incubated overnight at 37°C under an atmosphere of 95% air and 5% CO2. Immunofluorescence analysis was conducted as previously described.( 22 )
Western blot assay. Cells were pelleted at 700 g (5 min at 4°C) and lysed in 50 μL of cell lysis buffer (20 mm Tris [pH 7.4] 100 mm NaCl, 1% Triton, 1 mm phenylmethylsulfonyl fluoride, 10 μg/mL leupeptin, 10 μg/mL aprotinin). Lysates were clarified by centrifugation (10 min at 4°C) and the supernatant collected. Protein concentration was determined by the Bradford assay (Bio‐Rad, Hercules, CA, USA). Equivalent amounts of protein were electrophoresed on SDS‐polyacrylamide gels. The gels were then electroblotted onto PVDF membranes. After blocking with 5% milk, membranes where incubated with the primary antibody overnight. Finally, the relevant protein was visualized by staining with the appropriate secondary horseradish peroxidase‐labeled antibody for 1 h followed by enhanced chemiluminescence. Densitometric scanning analysis was performed using NIH Image 1.62 software (National Institutes of Health (NIH), Bethesda, MD, USA).
Transient transduction with HIF‐1α shRNA lentiviral particles. Mission TRC shRNA lentiviral transduction particles expressing short hairpin RNA (shRNA) targeting HIF‐1α and lentiviral negative control particles were purchased from Sigma‐Aldrich. Transient transduction was performed according to the manufacturer’s instructions. Briefly, cells were seeded on a 24‐well plate. The following day cells were infected. After 24 h, medium was changed with fresh RPMI and the cells treated as indicated in the text. Reduced expression of HIF‐1α was confirmed by western blotting.
Cell invasion and migration assay. Cell invasion and migration was measured using the 24‐well cell invasion assay kit from Millipore (Billerica, MA, USA), following manufacturer’s instructions. Briefly, an equivalent number of cells was resuspended in serum‐free medium containing 1% BSA, seeded in an insert, and then placed inside a 24‐well plate. Each well was filled with 500 μL of serum‐free medium/1% BSA and a chemoattractant. The plate was incubated in normoxia or hypoxia for the indicated time. Subsequently, the insert was placed in a staining solution. Non‐invading cells at the top of the membrane were removed. Invading cells, from three separate experiments, at the bottom of the membrane were visualized with an EclipseNet 2000 microscope and counted in triplicate (Nikon Instruments, Florence, Italy).
RNA isolation and real‐time quantitative polymerase chain reaction (RT‐PCR). Control and treated cells were washed in PBS, removed from the dish and transferred to a conical tube. Cell pellet was lysed to extract total RNA with the BioRobot EZ1 workstation (Qiagen, Milan, Italy). Approximately 1 μg of RNA was reverse transcribed using the High‐Capacity cDNA Archive Kit (Applied Biosystems, Milan, Italy) following the manufacturer’s instructions. Aliquots of cDNA were subjected to real‐time PCR in 50 μL of 1× Universal PCR Master Mix, 0.5 μm TaqMan probe, and 5 ng of cDNA. Primers and probes for P2X7R, RAGE, NOS2, COX2, PTX3, CXCR4, were designed using the Assays on‐Demand facility (Applied Biosystems). Each sample was loaded in triplicate, and a negative and positive control was included. Amplification of 18S rRNA was used as the internal reference gene. PCR amplifications were performed as follows: 50°C for 2 min, 95°C for 10 min, and 40 cycles each with 95°C for 15 s and 60°C for 1 min using an ABI Prism 7000 sequence detector (Applied Biosystems). Amplification data were analyzed using the Sequence Detector version 1.7 software (Applied Biosystems). Statistical analysis of real‐time PCR results were done using mean normalized cycle threshold (ΔC t) values and the pooled SD of the mean ΔC t. Experiments were repeated at least three times with different cellular preparations.
Patients: control subjects. Ten control subjects, aged 21–50 years, hospitalized for mammary plastic surgery were enrolled. All patients had no prior long standing anti‐inflammatory treatment. They were selected on the basis of: (i) absence of clinical (echo and mammography) and histopathological evidence of any proliferative process; and (ii) absence of mastitis on their clinical history, Reactive C Protein (RCP) negative or below 10 mg/L. All patients gave their informed consent for the study.
Patients with mammary carcinoma. Twenty patients, aged 45–75 years, were selected according to their clinical history, clinical staging (TNM), and cytological diagnosis of mammary carcinoma. All patients had no prior long standing anti‐inflammatory treatment. Echographic, X‐ray radiography, and mammographic studies were done. Patients underwent surgery and histopathology assessment of the tumor confirmed the clinical diagnosis as invasive mammary carcinoma. Again, they were enrolled when RCP was negative or below 10 mg/L, leukocyte infiltrate was absent at histology, and CD45 was absent. All patients gave their informed consent for the study.
Laser‐capture microdissection (LCMD). Tumor and host normal tissues were microdissected and separated from stained frozen sections, using a Nikon LCMD apparatus as previously described.( 2 ) Microdissected tissue areas were collected on adhesive cap of nanotubes (Supporting Fig. S1). A correlation between area and number of cells was obtained by staining the specimen with the HistoGene Staining Solution (Molecular Devices, Sunnyvale, CA, USA) and determined the nuclear density of the tumor and normal host tissue as previously described.( 2 ) CD45 levels in host and tumor tissue were determined by western blot as shown in Supporting Figure S2.
RNA isolation and high‐throughput real‐time PCR analysis from LCMD samples. The microdissected tissue was removed from the top of LCM caps with lysis buffer (Qiagen). RNA was extracted and cDNA obtained by reverse transcription following the protocol described for the cell line. Briefly, up to eight samples containing 500 ng of cDNA diluted in 1× Universal PCR Master Mix were loaded on one or two (if in duplicate) main wells. Afterwards, the plate was centrifuged twice at 250g for 1 min. in order to distribute the mix with the cDNA along the 48 mini‐wells containing the 48 genes. The list of the genes is reported in Supporting Figure S3 and they were provided as TaqMan Custom Array by Applied Biosystems. In particular, the following classes of genes were chosen: alarmin receptors (RAGE, P2X7R, TLRs), inducible enzymes (NOS2, COX2, HMOX1, PTGS2, PTGES), cytokines and cytokines receptors (IL8RB, IRF4, TGFB1), migration and invasion‐related molecules (CXCR4, MMP9, TIMP2, ICAM1, VCAM1), acute phase protein (SAA1, APCS, PTX3), angiogenesis (VEGF), and growth and survival factors (EGFR/EGF, ERα/ERβ, PDGF/PDGFR). Briefly, each sample was loaded in triplicate with a negative and positive control. PCR amplifications were performed using an ABI Prism 7900HT Fast Real‐Time PCR System Detector (Applied Biosystems). Amplification data were analyzed and expressed as described for the cell line. Experiments were repeated at least three times with different preparations.
Western blot analysis. Fresh frozen mammary microdissected tissues were resuspended in lysis buffer containing 1% Triton‐X‐100, 50 mm Tris‐HCl (pH 7.5), 150 mm NaCl, 5 mm EDTA, and 75 U of aprotinin and incubated for 20 min. The tissue suspension was mechanically disrupted by Ultra‐Turrax‐T25 basic homogenization. The homogenate was centrifuged at 13 000 g for 30 min at 4°C and protein concentration was determined using the Bradford assay (Bio‐Rad). An equal amount of proteins was separated following the protocol described for the cell line.
Isolation of cytosol and nuclear fractions in microdissected tissues. Nuclear and cytosolic fractions were isolated using the nuclear extraction kit from Active Motif following the manufacturer’s instructions as described for the cells. In this case microdissected tumor and host tissues were lysed directly on the top of the CapSure HS LCM Cap. Samples were then studied by western blotting.
Statistical analysis. Quantitative values were presented as mean ± SE. Significant differences between sets of values for control and test groups were assessed by a one‐way anova using a student Newman–Keuls post‐hoc test. The parametric unpaired t‐test and the nonparametric Mann–Whitney test were used to evaluate the variations in gene expression between tumor and peritumor tissues. A P‐value refers to a comparison of a measured parameter in the experimental group with that of the appropriate control; significance was set at P < 0.05.
Results
Effect of hypoxia on the breast cancer cell line MCF‐7. Figure 1 shows a western blot analysis of HIF‐1α, NF‐κB and IκB‐α in MCF‐7 cells under normoxic and hypoxic conditions. Hypoxia caused a nuclear translocation of both HIF‐1α and NF‐κB that started after 30 min. By contrast, total IκB‐α showed a decrease after 30 min and a subsequent increase at 45 and 60 min (Fig. 1). Lamin A/C and β‐actin were used as loading controls for the nuclear and cytosolic fraction, respectively. The densitometric analysis of each protein is shown on the right‐hand side of Figure 1. Figure 2 shows an immunofluorescence analysis for HIF‐1α, NF‐κB, and IκB‐α in normoxic and hypoxic cells. PI was used to stain cellular nuclei. Thirty min of hypoxia increased the co‐localization of both HIF‐1α and NF‐κB with PI while decreasing that of IκB‐α and PI (Fig. 2). Table 1 shows the results obtained by measuring the colocalization of fluorescence from HIF‐1α, NF‐κB, and IκB‐α with that from PI and evidence, more accurately, the nuclear increase or decrease of these proteins similar to what was shown in the confocal microscope image.
Figure 1.

Nuclear translocation of hypoxia‐inducible factor 1α (HIF‐1α) and nuclear factor‐kappa B (NF‐κB) and down‐regulation of IκB‐α in hypoxic MCF‐7 cells. MCF‐7 cells were incubated under normoxic or hypoxic conditions. After the times indicated, cells were processed to obtain a nuclear and cytosolic fraction as described in the Materials and Methods. The contents of HIF‐1α, NF‐κB p65, and IκB‐α were determined by western blotting. Expression levels for the studied proteins were determined by densitometric analysis of the blots shown on the left side of the figure. β‐Actin and Lamin A/C were used as a loading control for the cytosolic and nuclear fraction, respectively. Blots are representative of at least three separate experiments. C, control normoxic cells.
Figure 2.

Intracellular localization of hypoxia‐inducible factor 1α (HIF‐1α), nuclear factor‐kappa B (NF‐κB), and IκB‐α in hypoxic MCF‐7 cells. MCF‐7 cells were incubated under normoxic or hypoxic conditions for the time indicated. Cells were fixed, permeabilized, and the localization of HIF‐1α, NF‐κB and IκB‐α was determined by immunofluorescence as described in the Materials and Methods. Nuclei were counterstained by using propidium iodide (PI).
Table 1.
Effect of hypoxia on HIF‐1α, IκB, and NF‐κB in MCF‐7 cells
| Molecule | Time | |||
|---|---|---|---|---|
| 0′ | 15′ | 30′ | 45′ | |
| HIF‐1α* | 3440 ± 156 | 4220 ± 124 | 6285 ± 261 | 9774 ± 570 |
| IκB** | 4985 ± 123 | NS | 2017 ± 83 | NS |
| NF‐κB* | 2632 ± 382 | NS | 9739 ± 1218 | NS |
A similar number of cells (100) from four different fields, has been evaluated at different times. *Values ±SD represent total pixels of co‐localization of green fluorescence (hypoxia‐inducible factor 1α [HIF‐1α] or nuclear factor‐kappa B [NF‐κB]) and red fluorescence (nuclear DNA). **Values ±SD represent total pixels of blue fluorescence (IκB). NS, not shown in the figures.
HIF‐1α and NF‐κB expression profiles. Role of HIF‐1α in regulating NF‐κB expression. The expression of HIF‐1α and NF‐κB, clearly induced by a short time exposure to hypoxia, was studied after incubating MCF‐7 cells to prolonged hypoxia. Figure 3(a) shows that expression and nuclear accumulation of HIF‐1α increased from 30 min to 6 h of hypoxia, when it reached its maximum, and then decreased from 17 to 48 h. By contrast, Figure 3(b) shows that expression of NF‐κB p65 increased and accumulated in the nucleus from 30 min to 48 h without any significant alteration. However, when HIF‐1α was silenced, the expression of NF‐κB was reduced from 3 to 24 h of hypoxia (Fig. 3b). Interestingly, NF‐κB expression was significantly increased in HIF‐1α‐silenced cells after 48 h of hypoxia (Fig. 3b). Figure 3(c) shows that transient silencing of HIF‐1α significantly reduced expression of HIF‐1α after 3 and 6 h of hypoxia. Importantly, Figure 3(d) shows that HIF‐1α‐silencing inhibited nuclear accumulation of NF‐κB at 3 and 6 h of hypoxia.
Figure 3.

Expression of hypoxia‐inducible factor 1α (HIF‐1α) and nuclear factor‐kappa B (NF‐κB) in wild‐type and HIF‐1α‐silenced MCF‐7 cells under hypoxia. (a) MCF‐7 cells were kept under hypoxia for the times indicated. HIF‐1α content was measured in the nuclear fractions by Trans‐AM ELISA assay as described in the Materials and Methods. (b) Wild‐type and HIF‐1α‐silenced MCF‐7 cells were kept under hypoxia for the times indicated. NF‐κB p65 content was measured in the nuclear fractions by Trans‐AM ELISA assay as described in the Materials and Methods. *P < 0.005. (c) Wild‐type and HIF‐1α‐silenced MCF‐7 cells were incubated under normoxic or hypoxic conditions. After the times indicated, cells were processed as described in the Materials and Methods. The contents of HIF‐1α was determined by western blotting. β‐Actin was used as a loading control. (d) Wild‐type and HIF‐1α‐silenced MCF‐7 cells were incubated under normoxic or hypoxic conditions. After the times indicated, cells were processed to obtain a nuclear and cytosolic fraction as described in the Materials and Methods. The content of NF‐κB p65 was determined by western blotting.
IR genes are overexpressed in hypoxic MCF‐7 cells. The effects of hypoxia on the expression of IR genes was studied by RT‐PCR in hypoxic MCF‐7 cells. mRNA expression levels of the same IR genes in the control normoxic cells was set at 0. Figure 4 shows that the expression of the alarmin or DAMP receptors RAGE and P2X7R mRNA reached a maximum after 30 min and decreased at 45 and 60 min. However, throughout the treatment, mRNA expression levels of RAGE and P2X7R were above that of the control normoxic cells. Furthermore, Figure 4 shows that RAGE and P2X7R mRNA expression was maintained up to 17 h of hypoxia. Addition of the HIF‐1α inhibitor chetomin up to 1 h of hypoxia strongly inhibited the mRNA expression of RAGE, whereas P2X7R mRNA expression was reduced to a lesser extent. By contrast, the NF‐κB inhibitor, parthenolide showed a better inhibition of P2X7R than RAGE mRNA (Fig. 4). mRNA expression of the inducible enzymes COX2 and NOS2 was up‐regulated after 30 and 45 min and down‐regulated after 60 min of hypoxia (Fig. 4). In this case, Figure 4 shows that 17 h of hypoxia did not increase mRNA expression of COX2 but increased that of NOS2. Again, both chetomin and parthenolide inhibited mRNA expression of COX2 and NOS2. However, chetomin showed a strong inhibition of COX2 mRNA (Fig. 4). Figure 4 also shows that the mRNA expression of the acute phase reactant PTX3 was up‐regulated after 60 min of hypoxia and was maintained up to 17 h. Chetomin and parthenolide reduced PTX3 mRNA expression. However, a stronger effect was observed in the presence of parthenolide (Fig. 4).
Figure 4.
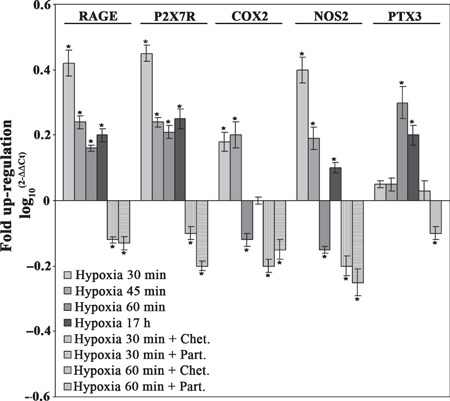
mRNA expression levels of pro‐inflammatory genes in hypoxic MCF‐7 cells. MCF‐7 cells were incubated under hypoxic conditions in the presence or absence of chetomin or parthenolide. After the times indicated, cells were processed and the mRNA was obtained as described in the Materials and Methods. The mRNA expression levels for receptor for advanced glycation end products (RAGE), purinoreceptor (P2X7R), cycloxygenase (COX2), nitric oxide synthase (NOS2), and pentraxin‐3 (PTX3) were determined by real‐time PCR. The bar graph shows fold up‐regulation of the studied molecules in cancer cells with respect to host cells, set at 0. Mean values ± SD obtained from three separate experiments repeated in triplicate. *P < 0.005.
IR proteins are overexpressed in hypoxic MCF‐7 cells. Figure 5(a) shows western blot and densitometric analysis of a set of IRR proteins. In particular, the expression of RAGE and P2X7R increased after 30 and 45 min of hypoxia, respectively. Similarly, COX2 showed an increase after 45 min of hypoxia (Fig. 5a). Figure 5(a) also shows that hypoxia influenced the expression of the monomeric form of NOS2. Finally, PTX3 expression increased after 45 and 60 min of hypoxia (Fig. 5a). Figure 5(b) shows that chetomin and parthenolide reduced expression levels of RAGE, P2X7R, and COX2. The expression levels of PTX3 were partially but not completely reduced by chetomin and parthenolide (Fig. 5b). We next studied the expression of RAGE and P2X7R after prolonged hypoxia. Figure 5(c) shows that these two receptors were both up‐regulated in MCF‐7 cells incubated under hypoxia for 12 and 24 h.
Figure 5.

Overexpression of pro‐inflammatory proteins and increased invasive behavior in hypoxic MCF‐7 cells are inhibited by chetomin and parthenolide. (a) MCF‐7 cells were incubated under normoxic or hypoxic conditions. After the times indicated, cells were processed as described in the Materials and Methods. The contents of receptor for advanced glycation end products (RAGE), purinoreceptor (P2X7R), cycloxygenase (COX2), nitric oxide synthase (NOS2), and pentraxin‐3 (PTX3) were determined by western blotting. β‐Actin was used as a loading control. Expression levels for the studied proteins were determined by densitometric analysis of the blots shown on the right side of the figure. Blots are representative of at least three separate experiments. *P < 0.005. C, control normoxic cells. (b) MCF‐7 cells were incubated under hypoxic conditions in the presence or absence of chetomin or parthenolide. After the times indicated, cells were processed. The contents of RAGE, P2X7R, COX2, and PTX3 were determined by western blotting. β‐Actin was used as a loading control. Blots are representative of at least three separate experiments. (c) MCF‐7 cells were incubated under hypoxic conditions. After 12 and 24 h, cells were processed to obtain whole cell lysates. The contents of RAGE and P2X7R were determined by western blotting. β‐Actin was used as a loading control. Blots are representative of at least three separate experiments. (d) Upper panel: MCF‐7 cells were incubated under hypoxic conditions. After 12 h, cells were processed and the mRNA obtained as described in the Materials and Methods. The mRNA expression levels for chemokine (C‐X‐C motif) receptor 4 (CXCR4) was determined by real‐time PCR. The bar graph shows fold up‐regulation of the studied molecules in cancer cells with respect to host cells, set at 0. Mean values ± SD obtained from three separate experiments repeated in triplicate. *P < 0.005. Lower panel: MCF‐7 cells were cultured under hypoxia in the presence of stromal‐derived factor‐1α (SDF‐1α), SDF‐1α + chetomin, and SDF‐1α + parthenolide as indicated. Invading cells were counted as described in the Materials and Methods. *P < 0.005.
Hypoxic treatment increases invasive and migratory properties of MCF‐7 cells. Expression of CXCR4, a Gi protein‐coupled receptor for the ligand CXCL12/stromal cell‐derived factor 1α (SDF‐1α), has been shown to play a role in breast cancer metastasis.( 23 , 24 ) Figure 5(d) shows that 12 h of hypoxia increased the mRNA expression of CXCR4 in MCF‐7 cells. We did not observe any significant increase in CXCR4 mRNA before that hypoxic incubation time (data not shown). Figure 5(d) also shows that 24 h of hypoxic treatment increased the number of invading and migrating MCF‐7 cells. Addition of SDF‐1α during 24 h of hypoxia greatly increased the number of invading MCF‐7 cells whereas the same chemokine did not have any effect on the invasion of normoxic MCF‐7 cells. Interestingly, addition of chetomin or parthenolide during hypoxia and SDF‐1α incubation reduced the number of invading MCF‐7 cells back to the control (Fig. 5d).
Nuclear localization of HIF‐1α and NF‐κB in the mammary tumor microenvironment. Activation of HIF‐1α and NF‐κB, observed in hypoxic MCF‐7 cells, was also studied in human solid mammary carcinoma. Therefore, each surgical sample was microdissected to separate host from tumor tissue and then subjected to nucleus/cytoplasm fractionation and protein analysis. Figure 6 shows a representative western blot with the relative densitometric analysis. Nuclear accumulation of HIF‐1α was observed in both tumor and host tissue. However, in the tumor tissue there was an increased expression of HIF‐1α in both the cytosolic and nuclear fraction. Increased nuclear accumulation of NF‐κB p65 was observed in the tumor compared to the host tissue where some p65 was still present in the cytoplasm. Lamin A/C and β‐actin were used as loading controls for the nuclear and cytosolic fraction, respectively.
Figure 6.

Hypoxia‐inducible factor 1α (HIF‐1α) and nuclear factor‐kappa B (NF‐κB) expression in host and tumor fraction separated by laser‐capture microdissection (LCMD). Host and tumor fractions, derived from the same tissue sample, were separated from three different mammary carcinoma biopsies by LCMD. Afterwards, cells were processed to obtain a nuclear and cytosolic fraction as described in the Materials and Methods. The contents of HIF‐1α and NF‐κB subunit p65 was determined by Western blotting. Values obtained from the densitometric analysis of the cytosolic and nuclear fraction are shown. β‐Actin and Lamin A/C were used as a loading control for the cytosolic and nuclear fraction, respectively.
IR gene expression in the tumor microenvironment. Figure 7 shows a high throughput RT‐PCR analysis of a panel of 48 typical IR genes from four tumor tissue samples after LCMD. The averaged expression level of each gene shown in Figure 6 is relative to that measured in the LCMD samples from host tissue. Interestingly, the majority of these genes are up‐regulated in the samples from tumor tissue. In particular, as observed during the hypoxic incubation of MCF‐7 cells, RAGE, P2X7R, NOS2, and COX2 mRNA were up‐regulated, whereas no significant increase was observed for PTX3 mRNA. Moreover, mRNA up‐regulation of additional IR genes was observed. In particular up‐regulation of toll‐like receptors 2, 3, and 4 (TLR2, 3, and 4), VEGF, matrix metalloproteinase‐9 (MMP‐9), chemokine receptor CXCR4, acute phase protein SAA1, EGFR, and ERα mRNA was observed (arrows in Fig. 7). The complete list of the 48 IRR genes analyzed and the selection criteria are reported in Figure S3 and in the Supporting Materials and Methods section.
Figure 7.

High‐throughput RT‐PCR analysis of 48 inflammatory and proliferative reparative genes obtained from tumor versus host tissue by laser‐capture microdissection (LCMD). Host and tumor fractions were separated from mammary carcinoma biopsies by LCMD. Afterwards mRNA was obtained as described in the Materials and Methods. The mRNA expression for 48 inflammatory and proliferative reparative genes was determined by high‐throughput RT‐PCR analysis. Results are shown as increase or decrease mRNA expression of tumor versus host samples.
IR protein expression in the tumor microenvironment. Figure 8(a) shows a western blot analysis for the IR proteins in microdissected host and tumor tissue samples. RAGE and P2X7R were significantly more expressed in tumor than in host tissue in all the samples analyzed. In fact, immunostaining was very intense in tumor epithelium, in contrast to the poor stain of the host adjacent tissue (Supporting Fig. S4a–d). Figure 8(a) also shows that the expression of two inducible enzymes COX2 and NOS2 was increased in the tumor tissue. Furthermore, NOS2 showed an increase in both the monomeric (130 kDa) and dimeric (250 kDa) form. IHC studies confirmed that tumor epithelium displayed an intense immunostaining for COX2 and NOS2 surrounded by an almost negative stromal tissue (Supporting Fig. S4e–h). By contrast, immunostaining of these two enzymes was absent or weak in normal host epithelium. In addition, immunostaining for pentraxin‐3 (Supporting Fig. S4i,j) was more intense in tumor than in host tissue. In fact, Figure 8(a) shows that PTX3 expression was more abundant in the tumor than in the host tissue. The two receptors EGFR and ERα were more expressed in the tumor than in the host tissue (Fig. 8a). Finally, as observed in the hypoxic MCF‐7 cells, tumor tissue samples showed an increased expression of the chemokine receptor CXCR4 (Fig. 8b).
Figure 8.

Protein expression levels of pro‐inflammatory and proliferative reparative molecules from tumor and host samples obtained by laser‐capture microdissection (LCMD). (a) Host and tumor fractions were separated from mammary carcinoma biopsies by LCMD and protein expression levels of the pro‐inflammatory and proliferative‐reparative molecules were measured by western blotting. Values obtained from the densitometric analysis of receptor for advanced glycation end products (RAGE), purinoreceptor (P2X7R), cycloxygenase (COX2), nitric oxide synthase (NOS2), pentraxin‐3 (PTX3), estrogen receptor α (ERα), and epithelial growth factor receptor (EGFR) in cancer with respect to host cells from each biopsy are expressed as arbitrary units in each graph. A representative western blot for each molecule is shown on top of the corresponding graph. β‐Actin was used as a loading control. (b) Host and tumor fractions were separated from three mammary carcinoma biopsies by LCMD. The content of chemokine (C‐X‐C motif) receptor 4 (CXCR4) was determined by western blotting. Values obtained from the densitometric analysis of the blots are also shown.
Discussion
We have recently shown that a complex pro‐inflammatory gene expression, in the absence of a leukocyte infiltrate, was present in microenvironment of human solid invasive prostatic carcinoma.( 2 ) In the present study, using a LCMD approach, we show that a nuclear accumulation of HIF‐1α and NF‐κB and a coordinated expression of pro‐inflammatory genes are also present in human solid invasive mammary carcinoma. However, tumor samples cannot be manipulated to individuate a cause/effect relationship between hypoxia and inflammatory gene expression and acquisition of new biological properties. Therefore, we used the breast cancer cell line MCF‐7 to show that hypoxia causes nuclear translocation of HIF‐1α and NF‐κB, up‐regulation of pro‐inflammatory genes and acquisition of invasive and migratory behavior. Furthermore, MCF‐7 cells were either treated with inhibitors of HIF‐1α and NF‐κB or silenced for HIF‐1α to demonstrate the presence of a cause/effect relationship between hypoxia, activation of pro‐inflammatory genes, and cell invasion.
Hypoxia activates IR in MCF‐7 cells. HIF‐1α is a transcription factor activated by hypoxia.( 25 ) The inactive form of HIF localizes in the cytoplasm whereas, its active form translocates into the nucleus.( 25 ) Similarly, NF‐κB, the major transcription factor for IR, may be activated by hypoxia and translocated into the nucleus.( 26 )
Here we show that during hypoxia HIF‐1α and NF‐κB accumulate in the nucleus (1, 2, 3) and that mRNA and protein expression of alarmin receptors RAGE and P2X7R, inducible enzymes COX2 and NOS2, and acute phase protein PTX3 (4, 5) is up‐regulated. Importantly, when HIF‐1α was silenced there was a decrease in nuclear NF‐κB (Fig. 3b,d), a decrease of RAGE and P2X7R expression (data not shown), and an inhibition of cell invasion (data not shown). Moreover, hypoxia‐stimulated invasiveness of MCF‐7 cells was enhanced by the presence of SDF‐1α a ligand for the chemokine receptor CXCR4. Inhibition of HIF‐1α or NF‐κB prevented the mRNA and protein expression of the studied molecules and the invasiveness of hypoxic MCF‐7 cells.
We suggest that up‐regulation of RAGE and P2X7R in hypoxic MCF‐7 renders these cells sensitive to alarmins released by necrotic cells thereby facilitating and maintaining NF‐κB activation and pro‐inflammatory gene expression. In fact, the RAGE gene posses a consensus sequence for HIF‐1α and NF‐κB in its promoter.( 9 , 27 ) Once accumulated in the plasma membrane, RAGE will allow the tumoral cell to activate the NF‐κB pathway in the presence of necrosis. Similarly, P2X7R is up‐regulated in hypoxic MCF‐7 cells allowing tumoral cells to activate NF‐κB in the presence of ATP/ADP released from the necrotic cells.( 28 ) Our results indicate that in hypoxic MCF‐7 cells, RAGE and P2X7R expression is influenced by both HIF‐1α and NF‐κB. However, the influence of each one of these two transcription factors is different. In fact, a strong inhibition of RAGE mRNA is similarly observed in the presence of chetomin and parthenolide whereas, P2X7R mRNA expression is inhibited more by parthenolide than chetomin (Fig. 4). Expression of RAGE, P2X7R, COX2, and PTX3 proteins is up‐regulated after 60 min of hypoxia and decreased in the presence of chetomin and parthenolide. Importantly, both RAGE and P2X7R expression was up‐regulated in cells after 12 and 24 h of hypoxia. This result indicates that expression of pro‐inflammatory proteins is up‐regulated by both short and prolonged hypoxia allowing tumoral cells to maintain a constant activation of intracellular survival signals and to gain properties important for migration, invasion, and growth.
The pro‐inflammatory inducible enzymes COX2 and NOS2 and the acute‐phase protein pentraxin‐3 were up‐regulated by hypoxia. However, selective inhibition of HIF‐1α by chetomin and NF‐κB by parthenolide differentially influenced the expression of these genes. In fact, COX2 expression was greatly inhibited by chetomin and less efficiently by parthenolide whereas, NOS2 and PTX3 expression was significantly inhibited by parthenolide and less effectively by chetomin (4, 5). This indicates that the coordinated activation of the pro‐inflammatory genes studied is under the control of both HIF‐1α and NF‐κB.
NF‐κB is the master transcription factor for the inflammatory and reparative response in mammalian tissues.( 29 , 30 ) We have shown that nuclear accumulation of NF‐κB in hypoxic MCF‐7 cells paralleled activation of HIF‐α. Silencing of HIF‐1α reduced nuclear accumulation of NF‐κB in hypoxic cells. However, when hypoxia was prolonged up to 48 h, we observed a decrease in nuclear HIF‐1α and an increase in nuclear NF‐κB in both wild‐type and HIF‐1α‐silenced cells. Therefore, we can suggest that hypoxia in MCF‐7 cells induces a direct change in both HIF‐1α and NF‐κB, with NF‐κB expression being dependent on HIF‐1α.( 31 , 32 ) However, the significant NF‐κB increase that we observed in HIF‐1α‐silenced cells when hypoxia was prolonged up to 48 h may derive from the signaling generated by RAGE, P2X7R, and other membrane damage receptors when cells are under prolonged hypoxia and necrosis is activated. In fact, both RAGE and P2X7R up‐regulation was maintained up to 24 h of hypoxia. Our observation my shed some light on the apparently diverging results regarding HIF‐1α/NF‐κB regulation. In fact, Walmsley reported that in hypoxic neutrophils, HIF‐1α activates NF‐κB.( 10 ) By contrast, a recent paper by Rius and colleagues shows that NF‐κB is a transcriptional activator of HIF‐1α and that a basal activity of NF‐κB is required for HIF‐1α stabilization during hypoxia.( 1 ) Therefore, our hypothesis is that initially, hypoxia activates HIF‐1α which in turn regulates NF‐κB and activates expression of IR proteins such as RAGE, P2X7R, COX2, NOS2, and PTX3. However, when hypoxia is prolonged up to 48 h or more, there is a decrease in HIF‐1α expression with a consequent accumulation of necrotic cells, release of DAMPS, activation of membrane damage receptors (RAGE, P2X7R), and a secondary activation and nuclear accumulation of NF‐κB. Such a mechanism would allow tumoral cells to maintain an increased expression level of molecules important for survival and other biological functions crucial for the malignant phenotype.
The coordinated pro‐inflammatory gene expression is also accompanied by the up‐regulation of the receptor for CXC chemokine CXCR‐4 in hypoxic MCF‐7 cells clearly present after 12 h of hypoxia (Fig. 5d). The biological effects of this up‐regulation is the increased ability of hypoxic MCF‐7 cells to degrade the ECM and to migrate upon a SDF‐1α gradient. Invasiveness of MCF‐7 cells was inhibited by the presence of either chetomin or partenolide. It is worth noting that at 12 h of hypoxia both HIF‐1α and NF‐κB are expressed and accumulated in the nucleus. Similarly, both RAGE and P2X7R expression is up‐regulated after 12 and 24 h of hypoxia. Therefore, we can conclude that there might be an association between the pro‐inflammatory gene expression and CXCR4/SDF‐1α up‐regulation. However, preliminary results from RAGE and P2X7R‐silenced cells (not shown) suggest that these are two separated pathways both, however, under the control of HIF‐1α and NF‐κB and both contributing to cell invasion and to the acquisition of malignant phenotype.
LCMD analysis of the mammary tumor microenvironment. The same proteins and genes studied in hypoxic MCF‐7 cells were analyzed in a parallel study conducted on human solid invasive mammary carcinoma in which tumor and host tissues were analyzed after separation by LCMD.
Microdissected fractions of tumor and host tissue showed that HIF‐1α and NF‐κB were present into the nucleus. However, HIF‐1α translocated into the nucleus, both in tumor and in host tissue. This suggests that, at least in the area delimited and identified by LCMD, a hypoxic condition is present in the tumor microenvironment. Based on the current observations,( 33 , 34 , 35 ) an explanation for this finding is that the gradient of free radicals generated from the central hypoxic region of the tumor may diffuse and activate HIF‐1α also in the adjacent regions. Afterwards, we observed an up‐regulation of RAGE and P2X7R in tumor versus host tissue from mammary carcinoma biopsies (6, 7, 8). The initial HIF‐1α‐dependent up‐regulation of these two receptors and their activation by alarmins released by necrotic cells may make a substantial contribution to the activation of NF‐κB. Therefore, we suggest that in the tumor microenvironment at least three events may contribute to the observed NF‐κB‐activation: (i) the change in the redox state of cytosol induced by hypoxia;( 36 ) (ii) the up‐regulation of RAGE by HIF‐1α, followed by its activation by HMGB1; and (iii) the up‐regulation of P2X7R and its activation by ATP/ADP.
High‐throughput RT‐PCR analysis of a panel of 48 typical pro‐inflammatory and reparative genes in tumor and host tissue after LCMD revealed an up‐regulation of different families of genes usually involved or regulated during the inflammatory response (Fig. 7). In fact, genes coding for alarmins or DAMPS receptors,( 11 ) for inducible enzymes, for acute phase proteins, for MMPs, for growth factor receptors and the corresponding proteins are up‐regulated in tumor versus host tissue from mammary carcinoma samples.
Data linking inflammation and malignant transformation and progression mainly refer to the leukocyte infiltrate with the tumor cells being able to use their plasticity to express some pro‐inflammatory molecules.( 37 , 38 , 39 ) However, using the LCMD approach, we have demonstrated that our data must refer to the tumor cells rather than to an inflammatory infiltrate.( 2 ) Furthermore, even if some of the molecules analyzed herewith have been already associated with tumor presence, our high‐throughput real‐time PCR and western blot analysis of tumor tissue show, for the first time, that their presence is part of a complex and coordinated activation of genes typically associated with inflammation. We also acknowledge the possibility that our results from the cell line and tumor samples could be due to the presence of stem/progenitor cancer cells.( 40 , 41 ) These cells would activate a more robust IR than differentiated tumor cells. In this direction, we are performing preliminary experiments using stem/progenitors cells from different human tumors (glioblastoma, mammary carcinoma, prostatic carcinoma, thyroid follicular, and papillary carcinoma) which seem to indicate that these cells under hypoxic conditions activate a stronger IR than the one observed in differentiated tumor cells (not shown).
The response of transformed cells to the presence of a hypoxic microenvironment is summarized by the drawing in Figure 9. Hypoxia induces three main events in transformed cells: stabilization of HIF‐1α, direct or indirect activation of NF‐κB followed by IR, and cellular necrosis. Activated HIF‐1α influences the transcription and the up‐regulation of alarmin receptors that, in the presence of necrotic cells, activate an intracellular pathway leading to NF‐κB and IR activation. Finally, sustained NF‐κB and IR activation confers a new invasive and metastatic phenotype to the tumor cells.
Figure 9.

Mechanism showing the response of transformed cells to the presence of a hypoxic microenvironment.
In conclusion, our data suggest that hypoxia induces in mammary tumor cells a phenotype that resembles that of activated leukocytes. The similarity between activated leukocytes and activated tumor cells resides in the coordinated expression of IR molecules and in crucial biological properties needed for invasion, migration, and probably specific homing.
Acknowledgments
This work was supported by grants Progetti finalizzati 2006 and 2007 from the Ministero della Salute, Italy, and Programma Oncotecnologico from the Ministero della Salute and Istituto Superiore di Sanità, Rome, Italy.
Disclosure Statement
The authors have no conflict of interest.
Supporting information
Supporting Materials and Methods. Analysis of mammary carcinoma by laser‐capture microdissection, real time polymerase chain reaction, western blot and immunohistochemistry.
Fig. S1. Laser‐capture microdissection (LCMD) procedure. LCMD of a mammary carcinoma (a–d). Panel (a) represents the original histology section on which LCMD has been performed. In panel (b), the laser cutting is clearly visible and surrounds homogenous epithelial host and tumor cell populations. Panel (c) shows the negative area of the section after the microdissected area has been removed. Finally, panel (d) shows the captured microdissected tissue fraction utilized for molecular analysis.
Fig. S2. Absence of leukocytes infiltration in the mammary tumor carcinomas. Host and tumor fraction from mammary carcinoma were separated by laser‐capture microdissection (LCMD). The contents of the pan leukocyte marker, CD45 was determined by SDS‐PAGE and western blotting. A positive control for the antibody, represented by white cells isolated from a blood sample, is shown in the left lane.
Fig. S3. Complete list of the 48 inflammatory and proliferative reparative genes analyzed by high‐throughput real time PCR.
Fig. S4. Immunohistochemical analysis of receptor for advanced glycation end products (RAGE), purinoreceptor (P2X7R), cycloxygenase (COX2), nitric oxide synthase (NOS2) and pentraxin‐3 (PTX3).
Please note: Wiley‐Blackwell are not responsible for the content or functionality of any supporting materials supplied by the authors. Any queries (other than missing material) should be directed to the corresponding author for the article.
Supporting info item
Supporting info item
Supporting info item
Supporting info item
Supporting info item
References
- 1. Rius J, Guma M, Schachtrup C et al. NF‐kappaB links innate immunity to the hypoxic response through transcriptional regulation of HIF‐1alpha. Nature 2008; 453: 807–11. [DOI] [PMC free article] [PubMed] [Google Scholar]
- 2. Ravenna L, Sale P, Di Vito M et al. Up‐regulation of the inflammatory‐reparative phenotype in human prostate carcinoma. Prostate 2009; 69: 1245–55. [DOI] [PubMed] [Google Scholar]
- 3. Chen CD, Sawyers CL. NF‐kappa B activates prostate‐specific antigen expression and is upregulated in androgen‐independent prostate cancer. Mol Cell Biol 2002; 22: 2862–70. [DOI] [PMC free article] [PubMed] [Google Scholar]
- 4. Karin M, Cao Y, Greten FR, Li ZW. NF‐kappaB in cancer: from innocent bystander to major culprit. Nat Rev Cancer 2002; 2: 301–10. [DOI] [PubMed] [Google Scholar]
- 5. Pikarsky E, Porat RM, Stein I et al. NF‐kappaB functions as a tumour promoter in inflammation‐associated cancer. Nature 2004; 431: 461–6. [DOI] [PubMed] [Google Scholar]
- 6. Richmond A. Nf‐kappa B, chemokine gene transcription and tumour growth. Nat Rev Immunol 2002; 2: 664–74. [DOI] [PMC free article] [PubMed] [Google Scholar]
- 7. Irwin DC, McCord JM, Nozik‐Grayck E et al. A potential role for reactive oxygen species and the HIF‐1alpha‐VEGF pathway in hypoxia‐induced pulmonary vascular leak. Free Radic Biol Med 2009; 47: 55–61. [DOI] [PMC free article] [PubMed] [Google Scholar]
- 8. Song IS, Wang AG, Yoon SY et al. Regulation of glucose metabolism‐related genes and VEGF by HIF‐1alpha and HIF‐1beta, but not HIF‐2alpha, in gastric cancer. Exp Mol Med 2009; 41: 51–8. [DOI] [PMC free article] [PubMed] [Google Scholar]
- 9. Pichiule P, Chavez JC, Schmidt AM, Vannucci SJ. Hypoxia‐inducible factor‐1 mediates neuronal expression of the receptor for advanced glycation end products following hypoxia/ischemia. J Biol Chem 2007; 282: 36330–40. [DOI] [PubMed] [Google Scholar]
- 10. Walmsley SR, Print C, Farahi N et al. Hypoxia‐induced neutrophil survival is mediated by HIF‐1alpha‐dependent NF‐kappaB activity. J Exp Med 2005; 201: 105–15. [DOI] [PMC free article] [PubMed] [Google Scholar]
- 11. Kono H, Rock KL. How dying cells alert the immune system to danger. Nat Rev Immunol 2008; 8: 279–89. [DOI] [PMC free article] [PubMed] [Google Scholar]
- 12. Baud V, Karin M. Is NF‐kappaB a good target for cancer therapy? Hopes and pitfalls. Nat Rev Drug Discov 2009; 8: 33–40. [DOI] [PMC free article] [PubMed] [Google Scholar]
- 13. Fulton AM. The chemokine receptors CXCR4 and CXCR3 in cancer. Curr Oncol Rep 2009; 11: 125–31. [DOI] [PubMed] [Google Scholar]
- 14. Chu CY, Cha ST, Lin WC et al. Stromal cell‐derived factor‐1alpha (SDF‐1alpha/CXCL12)‐enhanced angiogenesis of human basal cell carcinoma cells involves ERK1/2‐NF‐kappaB/interleukin‐6 pathway. Carcinogenesis 2009; 30: 205–13. [DOI] [PubMed] [Google Scholar]
- 15. Bos PD, Zhang XH, Nadal C et al. Genes that mediate breast cancer metastasis to the brain. Nature 2009; 459: 1005–9. [DOI] [PMC free article] [PubMed] [Google Scholar]
- 16. Hussain SP, He P, Subleski J et al. Nitric oxide is a key component in inflammation‐accelerated tumorigenesis. Cancer Res 2008; 68: 7130–6. [DOI] [PMC free article] [PubMed] [Google Scholar]
- 17. Rocconi RP, Kirby TO, Seitz RS et al. Lipoxygenase pathway receptor expression in ovarian cancer. Reprod Sci 2008; 15: 321–6. [DOI] [PubMed] [Google Scholar]
- 18. Deban L, Bottazzi B, Garlanda C, de la Torre YM, Mantovani A. Pentraxins: multifunctional proteins at the interface of innate immunity and inflammation. Biofactors 2009; 35: 138–45. [DOI] [PubMed] [Google Scholar]
- 19. Souza DG, Amaral FA, Fagundes CT et al. The long pentraxin PTX3 is crucial for tissue inflammation after intestinal ischemia and reperfusion in mice. Am J Pathol 2009; 174: 1309–18. [DOI] [PMC free article] [PubMed] [Google Scholar]
- 20. Crabtree M, Pileggi R, Bhattacharyya I et al. RAGE mRNA expression and its correlation with nuclear factor kappa beta mRNA expression in inflamed human periradicular tissues. J Endod 2008; 34: 689–92. [DOI] [PMC free article] [PubMed] [Google Scholar]
- 21. Tateno T, Ueno S, Hiwatashi K et al. Expression of receptor for advanced glycation end products (RAGE) is related to prognosis in patients with esophageal squamous cell carcinoma. Ann Surg Oncol 2009; 16: 440–6. [DOI] [PubMed] [Google Scholar]
- 22. Tafani M, Schito L, Anwar T et al. Induction of autophagic cell death by a novel molecule is increased by hypoxia. Autophagy 2008; 4: 1042–53. [DOI] [PubMed] [Google Scholar]
- 23. Müller A, Homey B, Soto H et al. Involvement of chemokine receptors in breast cancer metastasis. Nature 2001; 410: 50–6. [DOI] [PubMed] [Google Scholar]
- 24. Cabioglu N, Summy J, Miller C et al. CXCL‐12/stromal cell‐derived factor‐1alpha transactivates HER2‐neu in breast cancer cells by a novel pathway involving Src kinase activation. Cancer Res 2005; 65: 6493–7. [DOI] [PubMed] [Google Scholar]
- 25. Semenza GL. Hypoxia‐inducible factor 1 and cancer pathogenesis. IUBMB Life 2008; 60: 591–7. [DOI] [PubMed] [Google Scholar]
- 26. Chen LF, Greene WC. Shaping the nuclear action of NF‐kappaB. Nat Rev Mol Cell Biol 2004; 5: 392–401. [DOI] [PubMed] [Google Scholar]
- 27. Tanaka N, Yonekura H, Yamagishi S, Fujimori H, Yamamoto Y, Yamamoto H. The receptor for advanced glycation end products is induced by the glycation products themselves and tumor necrosis factor‐alpha through nuclear factor‐kappa B, and by 17beta‐estradiol through Sp‐1 in human vascular endothelial cells. J Biol Chem 2000; 275: 25781–90. [DOI] [PubMed] [Google Scholar]
- 28. Di Virgilio F. Liaisons dangereuses: P2X(7) and the inflammasome. Trends Pharmacol Sci 2007; 28: 465–72. [DOI] [PubMed] [Google Scholar]
- 29. Baeuerle PA, Baltimore D. NF‐kappa B: ten years after. Cell 1996; 87: 13–20. [DOI] [PubMed] [Google Scholar]
- 30. Vallabhapurapu S, Karin M. Regulation and function of NF‐kappaB transcrip‐tion factors in the immune system. Annu Rev Immunol 2009; 27: 693–733. [DOI] [PubMed] [Google Scholar]
- 31. Semenza GL. Targeting HIF‐1 for cancer therapy. Nat Rev Cancer 2003; 3: 721–32. [DOI] [PubMed] [Google Scholar]
- 32. Kabe Y, Ando K, Hirao S, Yoshida M, Handa H. Redox regulation of NF‐kappaB activation: distinct redox regulation between the cytoplasm and the nucleus. Antioxid Redox Signal 2005; 7: 395–403. [DOI] [PubMed] [Google Scholar]
- 33. Hwang KY, Oh YT, Yoon H et al. Baicalein suppresses hypoxia‐induced HIF‐1alpha protein accumulation and activation through inhibition of reactive oxygen species and PI 3‐kinase/Akt pathway in BV2 murine microglial cells. Neurosci Lett 2008; 444: 264–9. [DOI] [PubMed] [Google Scholar]
- 34. Sonveaux P, Végran F, Schroeder T et al. Targeting lactate‐fueled respiration selectively kills hypoxic tumor cells in mice. J Clin Invest 2008; 118: 3930–42. [DOI] [PMC free article] [PubMed] [Google Scholar]
- 35. Zou GM, Karikari C, Kabe Y, Handa H, Anders RA, Maitra A. The Ape‐1/Ref‐1 redox antagonist E3330 inhibits the growth of tumor endothelium and endothelial progenitor cells: therapeutic implications in tumor angiogenesis. J Cell Physiol 2009; 219: 209–18. [DOI] [PubMed] [Google Scholar]
- 36. Tajima M, Kurashima Y, Sugiyama K, Ogura T, Sakagami H. The redox state of glutathione regulates the hypoxic induction of HIF‐1. Eur J Pharmacol 2009; 606: 45–9. [DOI] [PubMed] [Google Scholar]
- 37. de Visser KE, Coussens LM. The inflammatory tumor microenvironment and its impact on cancer development. Contrib Microbiol 2006; 13: 118–37. [DOI] [PubMed] [Google Scholar]
- 38. Kundu JK, Surh YJ. Inflammation: gearing the journey to cancer. Mutat Res 2008; 659: 15–30. [DOI] [PubMed] [Google Scholar]
- 39. Goswami B, Rajappa M, Sharma M, Sharma A. Inflammation: its role and interplay in the development of cancer, with special focus on gynecological malignancies. Int J Gynecol Cancer 2008; 18: 591–9. [DOI] [PubMed] [Google Scholar]
- 40. Quante M, Wang TC. Inflammation and stem cells in gastrointestinal carcinogenesis. Physiology (Bethesda) 2008; 23: 350–9. [DOI] [PMC free article] [PubMed] [Google Scholar]
- 41. Herfs M, Hubert P, Delvenne P. Epithelial metaplasia: adult stem cell reprogramming and (pre)neoplastic transformation mediated by inflammation? Trends Mol Med 2009; 15: 245–53. [DOI] [PubMed] [Google Scholar]
Associated Data
This section collects any data citations, data availability statements, or supplementary materials included in this article.
Supplementary Materials
Supporting Materials and Methods. Analysis of mammary carcinoma by laser‐capture microdissection, real time polymerase chain reaction, western blot and immunohistochemistry.
Fig. S1. Laser‐capture microdissection (LCMD) procedure. LCMD of a mammary carcinoma (a–d). Panel (a) represents the original histology section on which LCMD has been performed. In panel (b), the laser cutting is clearly visible and surrounds homogenous epithelial host and tumor cell populations. Panel (c) shows the negative area of the section after the microdissected area has been removed. Finally, panel (d) shows the captured microdissected tissue fraction utilized for molecular analysis.
Fig. S2. Absence of leukocytes infiltration in the mammary tumor carcinomas. Host and tumor fraction from mammary carcinoma were separated by laser‐capture microdissection (LCMD). The contents of the pan leukocyte marker, CD45 was determined by SDS‐PAGE and western blotting. A positive control for the antibody, represented by white cells isolated from a blood sample, is shown in the left lane.
Fig. S3. Complete list of the 48 inflammatory and proliferative reparative genes analyzed by high‐throughput real time PCR.
Fig. S4. Immunohistochemical analysis of receptor for advanced glycation end products (RAGE), purinoreceptor (P2X7R), cycloxygenase (COX2), nitric oxide synthase (NOS2) and pentraxin‐3 (PTX3).
Please note: Wiley‐Blackwell are not responsible for the content or functionality of any supporting materials supplied by the authors. Any queries (other than missing material) should be directed to the corresponding author for the article.
Supporting info item
Supporting info item
Supporting info item
Supporting info item
Supporting info item