

Abstract
The authors designed an elemental analysis system using an ion microbeam combined with a microparticle‐induced X‐ray emission (micro‐PIXE) method for the analysis of biomedical samples in air with a spatial resolution of 1 µm (in‐air micro‐PIXE system). This system was used to develop an imaging and quantification method for intracellular cis‐diamminedichloro‐platinum(II) (CDDP) in a human lung cancer cell line. A human lung adenocarcinoma cell line, A549, was cultured and nuclear labeling was carried out by incubating the cells with BrdU. The cells were then exposed to CDDP at concentrations ranging from 1 µmol to 1 mmol, for 30 min to 24 h. After drug treatment, samples were washed and frozen with liquid nitrogen, and freeze‐dried for 24 h. Standard samples were made using agar containing several concentrations of CDDP. Experiments using standard samples showed a linear correlation between CDDP concentration and platinum signal strength. No clear platinum signal was detected after exposure to CDDP for 24 h at doses between 1 and 100 µmol. However, significant platinum signals were observed at 1 mmol. When nucleus and cytoplasm visualization was sufficiently clear to efficiently use in‐air micro‐PIXE, the platinum image quality was considered satisfactory. The detected signals of CDDP were stronger in the nucleus than in the cytoplasm. A time‐course study showed increased CDDP uptake in cells after longer drug exposure periods. The present study demonstrates the application of element analysis using in‐air micro‐PIXE to biomedical samples. The use of this system enables the high‐resolution visualization of intracellular CDDP distribution and measurement of intracellular CDDP concentrations. (Cancer Sci 2008; 99: 901–904)
In current clinical practice, several types of human cancers are treated using a key anticancer agent, cis‐diamminedichloro‐platinum(II) (CDDP).( 1 , 2 , 3 , 4 ) The effect of CDDP is known to vary widely among individual patients, however, with cancer cells often showing drug resistance after repeated use.( 5 ) In general, drug sensitivity to an anticancer agent depends on its cellular uptake and intracellular distribution. For drug‐resistant cells, CDDP excretion is carried out through several mechanisms, including overexpression of p‐glycoprotein and intracellular glutathione.( 6 , 7 ) Better understanding of the mechanisms involved in sensitivity and resistance to CDDP can be potentially achieved by direct visualization and quantification in individual cells.
The development by the Takasaki Advanced Radiation Research Institute of the Japan Atomic Energy Agency (JAEA Takasaki) of an analysis technique involving in‐air microparticle induced X‐ray emission (micro‐PIXE) using a light ion microbeam system has yielded the highest spatial resolution in full width half maximum (FWHM) in the world, at 0.25 µm. This technique has been used in numerous research fields, such as biology, archeology, geology, and environmental science. For cancer research in particular, high‐resolution visualization facilitates determination of the spatial distribution and dynamics of various chemical elements in a single cancer cell found in the atmosphere.( 8 ) Here, the authors used the micro‐PIXE technique to establish a method of imaging and quantifying intracellular CDDP in a human lung cancer cell line.
Materials and Methods
Standard sample preparation. Standard samples were developed to allow quantitative assessment of the accuracy of the amount of platinum measured using the authors’ system. These samples consisted of 10% agar (Wako Pure Chemical Industries Ltd, Osaka, Japan) with various amounts of CDDP. First, CDDP in dimethylsulfoxide (DMSO; Wako Pure Chemical Industries, Kumamoto, Japan) solution was dissolved in agar solution that had been boiled for 1 h. The agar was then cooled to room temperature, and agar lumps containing CDDP were weighed. The agar lumps were then frozen and their volume was measured using computed tomography (CT; Asteion, Toshiba, Tokyo, Japan). The lumps were then cut into 20‐µm thick sections and placed on 4‐µm thick Mylar films. Sample thickness was confirmed using a confocal laser microscope, with an estimated average thickness of 20.21 ± 0.37 µm (±standard error, n = 12). The samples were then dried for 24 h in a freeze‐drier (Labconco Corporation, Kansas City, MI, USA) and kept in a desiccator until PIXE analysis.
Cell line and culture. A human lung adenocarcinoma cell line, A549, was obtained from the Cell Resource Center for Biomedical Research Institute of Development, Aging and Cancer, Tohoku University, Japan. Cells were cultured in Roswell Park Memorial Institute (RPMI)‐1640 medium supplemented with 10% fetal calf serum, antibiotics (penicillin, streptomycin) and 0.3% N‐2‐hydroxyethlpiperazine‐N′‐2‐ethanesulfonic acid (HEPES; Immuno Biological Laboratories Ltd, Gunma, Japan). Cell suspensions were prepared from culture stock flasks and inoculated in 25‐cm2 cell culture flasks (Corning, New York, NY, USA). Before treatment, cells were incubated for 24 h at 37°C in a humidified atmosphere of 5% CO2 and 95% air.
Cell sample preparation. Exponentially growing cells were labeled with 10 µmol bromodeoxyuridine (BrdU; BD Biosciences, San Jose, CA, USA) five times every 12 h for 3 days. The 4‐µm thick Mylar films were stretched between Pyrex glass and Viton rings, followed by immersion in 5 mol sulfuric acid for 2 h and washing with distilled water three times.( 9 ) Twelve hours after the final BrdU labeling procedure, cells were trypsinized and counted using a hemocytometer. Sixteen hours before CDDP exposure, single cells were seeded on a Mylar film in a culture dish. CDDP obtained from Wako Pure Chemical Industries, Ltd (Osaka, Japan) was dissolved in DMSO immediately before treatment. A 100‐mmol solution was diluted with complete medium to concentrations ranging from 1 µmol to 1 mmol. The original medium on Mylar film was then replaced with CDDP‐containing medium. After 1, 3, 6, or 24 h of drug exposure, this medium was removed and cells were washed five times with a tris‐hydroxymethylaminomethane‐HNO3 solution (pH 7.4). The cells were then cryofixed by soaking the samples in isopentane at liquid nitrogen temperature.( 9 ) The frozen samples were dried for 24 h in a freeze‐drier (Labconco Corporation, MI, USA) and kept in a desiccator until PIXE analysis.
In‐air micro‐PIXE analysis. The in‐air micro‐PIXE system used has been described previously.( 9 ) Briefly, the system consists of a microbeam system combined with 3‐MV single‐ended electrostatic accelerators, a beam position control, and three X‐ray detectors (Fig. 1). In the present experiment, the microbeam scanned a 100 × 100 µm2 region of the sample. Because biological samples can potentially be damaged under vacuum, samples were analyzed at atmospheric pressure and optionally cooled with a flow of helium gas. The beam spot size in the target plane and the spreading of the beam passing through the Mylar film were approximately 1 µm and 0.2 µm, respectively. Fig. 2 shows the X‐ray spectrum and elemental distribution of a cell sample. Elemental maps were obtained using image analysis software (Transform, Fortner Software LLC, Sterling, VA, USA). Phosphorus, sulfur and potassium corresponded with cell shape, and bromine was concentrated in the cell nucleus. Each element amount was determined from a peak area with no background noise as counts by electric charge (count/nC). The cell shape was estimated from the phosphorus peak area, and the cell nucleus from the labeled bromine area. The concentration of intracellular CDDP was estimated by measuring the platinum count/nC in a selected area of a cell.
Figure 1.
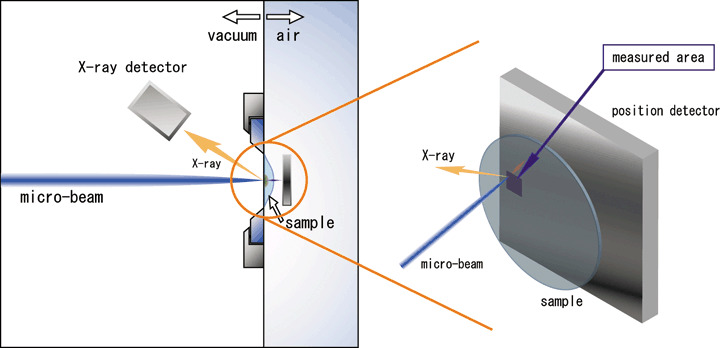
Cross‐sectional view of the in‐air microparticle induced X‐ray emission (micro‐PIXE) system. The system consists of a microbeam system combined with 3‐MV single‐ended electrostatic accelerators, a beam position control, and three X‐ray detectors.
Figure 2.
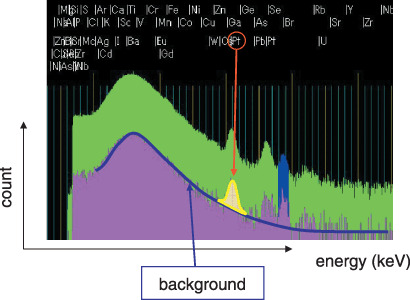
X‐ray spectrum and elemental distribution of a cell sample. The green area represents the entire count of trace elements in a specific sample area, and the red area represents the background. The red arrow shows the platinum peak, and the amount of platinum is calculated from the peak area.
Results
Quantification of platinum. Three standard samples with different CDDP concentrations were analyzed using in‐air micro‐PIXE. From the weight and volume measurements of the agar lumps, sample density was estimated at 1.121 g/mc3. From the observed area of the three samples, the final CDDP amounts were 2.66 × 10⁻¹⁶, 2.24 × 10⁻¹⁷, and 2.34 × 10⁻¹⁸ mol/µm2. A linear correlation was found between the platinum count observed using in‐air micro‐PIXE and the true CDDP amount (Fig. 3; r = 0.949, P < 0.0001). These findings confirm the validity of in‐air micro‐PIXE analysis as a tool for the direct measurement of CDDP.
Figure 3.
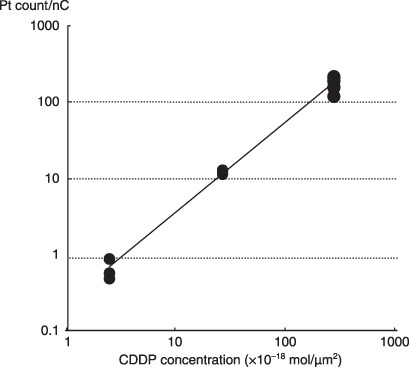
Correlation between actual cis‐diamminedichloro‐platinum(II) (CDDP) concentration and measured count/nC of platinum in standard samples using air microparticle induced X‐ray emission (micro‐PIXE; r = 0.949, P < 0.0001).
Detection of CDDP in cells. Phosphorus, sulfur and potassium peaks were clearly observed in the X‐ray spectrum and were uniformly distributed in the cultured cells. Further, bromine was concentrated in the cell nucleus (Fig. 4). In contrast, platinum peaks were not clearly observed in cells exposed for 24 h to CDDP doses ranging from 1 to 100 µmol. At a dose of 1 mmol, however, significant platinum signals were detected. When nucleus and cytoplasm visualization was sufficiently clear to efficiently use in‐air micro‐PIXE, the platinum image quality was considered satisfactory. Signals detected in the intracellular nucleus were stronger than in the cytoplasm (Fig. 5). The time‐course study showed increased CDDP uptake in cells with linear correlation after longer drug exposure periods (Fig. 6; intracellular platinum: r = 0.753, P < 0.0001; nuclear platinum: r = 0.732, P < 0.0001). However, the intranuclear distribution patterns after various drug exposure times were similar.
Figure 4.
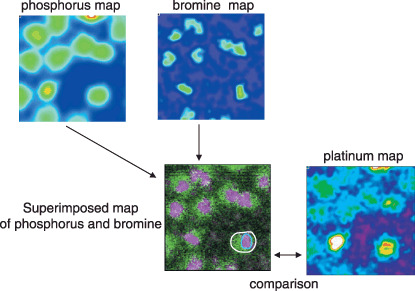
Elemental maps of phosphorus and bromine using image analysis software. The concentration of intracellular cis‐diamminedichloro‐platinum(II) (CDDP) is also estimated by measuring the platinum count/nC in a selected area of the cells. Intracellular and intranuclear platinum are counted in individual cells.
Figure 5.
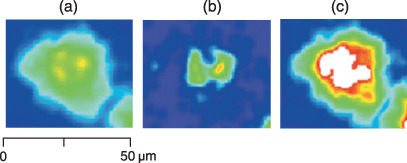
Elemental maps of (a) phosphorus, (b) bromine and, (c) platinum in a human lung cancer cell line, A549. The cells were periodically treated with 10 µmol bromodeoxyuridine (BrdU) before exposure to 1 mmol cis‐diamminedichloro‐platinum(II) (CDDP) for 24 h. Diffused intracellular phosphorus distribution is observed, and bromine accumulation is apparent in cell nuclei. The platinum signal detected in the intracellular nucleus is stronger than that in the cytoplasm.
Figure 6.
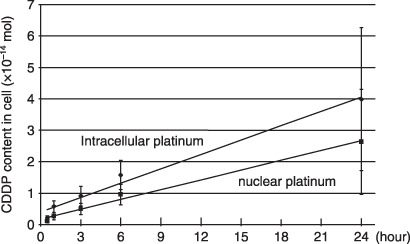
Intracellular and nuclear platinum after exposure to 1 mmol cis‐diamminedichloro‐platinum(II) (CDDP). Increased CDDP uptake is observed in cells with linear correlation after longer drug exposure. CDDP uptake is higher in the nucleus than in the cytoplasm.
Discussion
Trace elements play an important role in the pathology of biological systems. Detailed analysis of elemental imaging of a biological sample is an important challenge in biological chemistry, and many spectroscopic techniques based on elemental signals have been reported.( 10 ) Among these, ion beam microanalysis is fully quantitative within detection limits ranging from 1 to 10 µg/g. In the present study, initial confirmation of the reliability of the authors’ system showed sufficient quantitative information for intracellular detection of CDDP from a human lung cancer cell line. Because ion beam microanalysis can achieve very fine spatial resolution ranging from 0.2 to 2 µm, the authors’ proton microbeam system provides detailed information on the lateral distribution of elemental species, and enables single cell analysis of biological samples. In addition, because the authors’ in‐air micro‐PIXE system is able to analyze biological samples in air instead of a vacuum, biological sample conservation under suitable conditions is facilitated.
The use of this system will allow the determination of the distribution and concentration of a drug in a cell. In oncology, Ortega et al. used micro‐PIXE for the determination of intracellular distribution of anticancer agents.( 11 , 12 , 13 ) These drugs contain specific trace elements in their molecular structure, such as platinum, iodine and gallium, suggesting the feasibility of their detection in individual cells using micro‐PIXE analysis. In their analysis, 4′‐iodo‐4′‐deoxy‐doxorubicin, a DNA intercalating agent, was mainly detected in the cell nucleus, indicating that the iodine distribution map corresponds to the nucleus area. In the present study, the distribution of phosphorus, sulfur and potassium elements showed the cell shape, whereas BrdU administration showed the specific accumulation of bromine in the nucleus. These observations suggest that analysis of platinum in the cell nucleus, as well as the whole cell, is possible. The authors’ experimental system enables the amount of CDDP to be measured in individual cells, facilitating further studies on CDDP resistance and heterogeneity of cellular CDDP sensitivity.
The present results showed that the accumulation of CDDP in human lung cancer cells increased with drug exposure time. Because the concentration of CDDP is very high and most cells lose viability after 24 h exposure to CDDP, the uptake of CDDP in the cells must occur by a passive mechanism under no physiological condition. Further efforts are needed to increase the sensitivity of the authors’ system for detecting lesser amounts of platinum in the cells.
In conclusion, the present study demonstrates the application of elemental analysis using in‐air micro‐PIXE to biomedical samples. The use of this system enabled the high‐resolution visualization of intracellular CDDP distribution and measurement of intracellular CDDP concentrations. In the postgenomic era, the use of trace elements through this technique may promote new findings in cancer research.
Acknowledgments
This work was supported in part by a Grant‐in‐Aid from the Ministry of Education, Science, Sports and Culture of Japan, and by the 21st Century Center of Excellence (COE) program of the Gunma University Graduate School of Medicine for Biomedical research using accelerator technology. The authors would like to thank Miss Masako Shin for her technical support. The authors also appreciate the work of the TIARA accelerator staff at JAEA Takasaki.
References
- 1. Ajani JA, Moiseyenko VM, Tjulandin S et al . Quality of life with docetaxel plus cisplatin and fluorouracil compared with cisplatin and fluorouracil from a phase III trial for advanced gastric or gastroesophageal adenocarcinoma: the V‐325 Study Group. J Clin Oncol 2007; 25: 3210–16. [DOI] [PubMed] [Google Scholar]
- 2. Eifel PJ. Chemoradiotherapy in the treatment of cervical cancer. Semin Radiat Oncol 2006; 16: 177–85. [DOI] [PubMed] [Google Scholar]
- 3. Schild SE, Bonner JA, Hillman S et al . Results of a phase II study of high‐dose thoracic radiation therapy with concurrent cisplatin and etoposide in limited‐stage small‐cell lung cancer (NCCTG 95–20–53). J Clin Oncol 2007; 25: 3124–9. [DOI] [PubMed] [Google Scholar]
- 4. Posner MR, Hershock DM, Blajman CR et al . Cisplatin and fluorouracil alone or with docetaxel in head and neck cancer. N Engl J Med 2007; 357: 1705–15. [DOI] [PubMed] [Google Scholar]
- 5. Boulikas T, Vougiouka M. Cisplatin and platinum drugs at the molecular level. Oncol Rep 2003; 10: 1663–82. [PubMed] [Google Scholar]
- 6. Kuo T, Liu F, Chuang C, Wu H, Wang J, Kao A. To predict response chemotherapy using technetium‐99m tetrofosmin chest images in patients with untreated small cell lung cancer and compare with p‐glycoprotein, multidrug resistance related protein‐1, and lung resistance‐related protein expression. Nucl Med Biol 2003; 30: 627–32. [DOI] [PubMed] [Google Scholar]
- 7. Godwin AK, Meister A, O'Dwyer PJ, Huang CS, Hamilton TC, Anderson ME. High resistance to cisplatin in human ovarian cancer cell lines is associated with marked increase of glutathione synthesis. Proc Natl Acad Sci 1992; 89: 3070–4. [DOI] [PMC free article] [PubMed] [Google Scholar]
- 8. Nakano T, Arakawa K, Sakurai H et al . Research of disease onset mechanism by determining the distribution of intracellular trace elements using an in‐air micro‐PIXE analyzer system. Int J PIXE 2006; 16: 69–76. [Google Scholar]
- 9. Ishii K, Sugimoto A, Tanaka A et al . Elemental analysis of cellular samples by in‐air micro‐PIXE. Nucl Instr Meth 2001; B181: 448–153. [Google Scholar]
- 10. Lobinski R, Moulin C, Ortega R. Imaging and speciation of trace elements in biological environment. Biochimie 2006; 88: 1591–604. [DOI] [PubMed] [Google Scholar]
- 11. Ortega R, Moretto P, Fajac A, Benard J, Llabador Y, Simonoff M. Quantitative mapping of platinum and essential trace metal in cisplatin resistant and sensitive human ovarian adenocarcinoma cells. Cell Mol Biol 1996; 42: 77–88. [PubMed] [Google Scholar]
- 12. Ortega R. Intracellular distributions of the anthracycline 4′‐iodo‐4′‐deoxy‐doxorubicin and essential trace metals using nuclear microprobe analysis. Polycyclic Aromatic Compd 2000; 21: 99–108. [Google Scholar]
- 13. Ortega R, Suda A, Deves G. Nuclear microprobe imaging of gallium nitrate in cancer cell. Nucl Instr Meth 2003; B210: 364–7. [Google Scholar]