

Abstract
DJ‐1 is frequently overexpressed in a large variety of solid tumors, but the DJ‐1 expression in laryngeal squamous cell cancer and its clinical/prognostic significance is unclear. We aimed to evaluate DJ‐1 protein expression in glottic squamous cell carcinoma (GSCC) and to correlate this with clinicopathological data including patient survival. The expression of DJ‐1 in GSCCs (60) and adjacent normal tissue (44) was assessed by immunohistochemistry and western blot analysis. In addition, the role of DJ‐1 was investigated in tumorigenesis by transfecting DJ1‐specific siRNA into laryngeal squamous cell carcinoma (LSCC) Hep‐2 cells. Our data showed that positive expression of DJ‐1 was found in 85% of GSCCs. In univariate survival analysis of the GSCC cohorts, a highly significant association between DJ‐1 expression with shortened patient overall survival (5‐year survival rate 92.9%vs 66.6%; P = 0.001; log rank test) was demonstrated. In multivariate analyses, DJ‐1, tumor grading, and pT status were significant prognostic parameters for shortened patient overall survival. Furthermore, siRNA targeting DJ‐1 can effectively inhibit DJ‐1 expression, resulting in enhanced apoptosis and less proliferation of Hep‐2 cells. We concluded that DJ‐1 overexpression might be a novel independent molecular marker for poor prognosis (shortened overall survival) of patients with GSCC.
(Cancer Sci 2010; 101: 1320–1325)
Laryngeal carcinoma accounts for approximately 2.4% of new malignancies worldwide every year, of which over 95% are of the squamous cell carcinoma.( 1 , 2 ) Glottic squamous cell carcinoma (GSCC) is the most common type of laryngeal cancer. Patients with GSCC often display considerable variability in survival.( 3 ) It is of general importance to predict the biology of the tumor and, thus, the course of the disease in the individual patient to ensure adequate therapy and patient surveillance. Conventional prognostic and predictive markers for GSCC are nodal status, tumor grade, tumor status, and tumor type.( 3 ) Additionally, molecular markers are being sought and established to allow for a refined classification of prognosis, especially in patient subgroups whose outcome can only insufficiently be predicted by conventional parameters. These include, among others, activation of various oncogenes (Ras, ( 4 , 5 ) Myc,( 6 ) epidermal growth factor receptor,( 7 ) and cyclin D1( 8 )), and tumor suppressor gene inactivation (P53 and p16).( 9 , 10 ) However, accurate and reliable biomarkers that serve for prognosis have yet to be identified.
DJ‐1 encodes a conserved protein belonging to the ThiJ/PfpI/DJ‐1 superfamily.( 11 ) The THEMATICS (theoretical microscopic titration curves) predicted eight DJ‐1 family members and three different probable functional classes.( 12 ) The exact molecular function of DJ‐1 is still unclear although increasing evidence suggests that DJ‐1 plays a role in cancer cell lines to protect against stress( 13 , 14 , 15 ) and affects cell survival by modulating the phosphorylation status of protein kinase B (PKB)/Akt,( 16 , 17 , 18 , 19 ) down‐regulating the DAXX–ASK1 proapoptotic pathway,( 20 ) altering p53 activity through Topors‐mediated sumoylation,( 21 ) and stabilizing the antioxidant transcriptional master regulator Nrf2.( 22 ) Human DJ‐1 was initially discovered as a putative oncogene that could transform NIH‐3T3 in cooperation with Ras;( 23 ) it was later found that DJ‐1 expression is relatively high in primary lung and prostate cancer biopsies;( 24 , 25 ) and its expression correlates positively with the incidence of relapse in patients with non‐small cell lung carcinoma.( 19 ) Employing proteomic profiling, DJ‐1 was found in sera from 37% of newly diagnosed patients with breast cancer( 26 ) and was overexpressed in pancreatic juice from pancreatic ductal adenocarcinoma patients.( 27 )
To date, the relationship between the molecular state of the DJ‐1 gene in GSCC and the clinicopathological/prognostic significance is unknown. We aimed to investigate the expression of DJ‐1 in a large tumor collection of GSCC and evaluate its prognostic significance. In in vitro study, the role of DJ‐1 in tumorigeneses was investigated by transfecting silenced DJ‐1 into laryngeal squamous cell carcinoma (LSCC) Hep‐2 cells.
Materials and Methods
Patients. A total of 74 patients were eligible for this study. Eight patients were excluded from this study because of incomplete follow‐up data, and six were excluded because of insufficient tissue samples. Sixty subjects with GSCCs and 44 subjects with adjacent normal tissues were thus examined. These patients underwent surgery in our department from January 1995 to September 2003, and clinical follow‐up data were completed. The average observation time for overall survival was 66 months for patients still alive at the time of analysis, and ranged from 9 to 142 months. Seventeen patients (28.3%) died during follow‐up. Tumor tissues were dissected from the resected specimens and adjacent normal tissues were used as a normal control; tumor and adjacent normal tissues were confirmed by pathologic examination. The tissues used for immunohistochemistry were fixed in 10% buffered formalin and embedded in paraffin. Among these 60 surgical specimens, eight GSCC and eight control tissues were selected randomly for western blot analysis. All specimens and clinical data in this study were procured, handled, and maintained according to the protocols approved by Institutional Review Board.
The principal inclusion criteria were primary squamous cell carcinoma of the glottis type only, no history of previous malignancies, and no history of previous radio‐ or chemotherapy treatment. All specimens were obtained from the resected tissues during the operation: (i) tumor excision with a safe margin for patients with stage pTis and pT1a; (ii) partial laryngectomy for patients with stage pT1b–pT2 (vertical partial laryngectomy [anterior] for anterior commissure lesion); a vertical partial laryngectomy for patients with stage pT3 (select patients with fixed vocal cord lesion not extending across the midline); and (iii) total laryngectomy for patients with stage pT3 (select patients with fixed vocal cord lesion extending across the midline) to pT4. The main clinical and pathologic characteristics of the patients are presented in Table 1: 55 (91.7%) were male and the median age was 61 years (ranging from 41 to 76 years of age). Clinical staging and the anatomic site of the tumors were assessed according to the 6th edition of the International Union Against Cancer (UICC) tumor‐node‐metastasis classification of malignant tumors.
Table 1.
Clinicopathological parameters of the tumor set
| No. cases | % | |
|---|---|---|
| Gender | ||
| Male | 55 | 91.7 |
| Female | 5 | 8.3 |
| Age (years) | ||
| ≤61 | 34 | 56.7 |
| >61 | 26 | 43.3 |
| pT status | ||
| Tis | 3 | 71.6 |
| T1 | 22 | 36.6 |
| T2 | 18 | 30.0 |
| T3 | 10 | 16.7 |
| T4a | 6 | 10.0 |
| T4b | 1 | 1.7 |
| pN status | ||
| N0 | 58 | 96.6 |
| N1 | 1 | 1.7 |
| N2 | 1 | 1.7 |
| Stage (UICC) | ||
| 0 | 3 | 5.0 |
| I | 22 | 36.6 |
| II | 17 | 28.3 |
| III | 10 | 16.7 |
| IVA | 7 | 11.7 |
| IVB | 1 | 1.7 |
| Tumor grade | ||
| G1 | 27 | 45 |
| G2 | 26 | 43.3 |
| G3 | 7 | 11.7 |
UICC, International Union Against Cancer.
Immunohistochemical staining. All tissues were routinely fixed in 10% buffered formalin and embedded in paraffin. Sections (5 μm) were deparaffinized in xylene. Endogenous peroxidase was blocked with 3% hydrogen peroxide in deionized water for 10 min. Sections were incubated with normal rabbit serum (Zymed Laboratories, South San Francisco, CA, USA) for 15 min to block the nonspecific binding sites. Section were immunostained with polyclone antibody to DJ‐1 (N‐20, SC‐27004, goat polyclone; Santa Cruz Biotechnology, Santa Cruz, CA, USA) at 1:700 dilution for 60 min at 37°C, followed by biotinylated secondary antibody (rabbit antigoat IgG) (Zymed Laboratories) for 30 min, subsequently reacted with by S‐A/HRP (Zymed Laboratories) for 30 min. For visualization, hydrogen peroxide‐activated diamino benzidine (DAB) was applied. Three‐minute washes in PBS were carried out between each step. Tissue sections were lightly counterstained with hematoxylin, dehydrated through graded alcohols, cleared with xylene, and mounted in mounting medium.
DJ‐1 staining was graded according to the intensity and extent of staining of the epithelium as follows: negative = 0, weak/very limited moderate staining = 1, moderate widespread/strong localized staining = 2, or strong widespread = 3. The cases with DJ‐1 staining, from 0 to 2, were grouped into the low‐grade category, whereas the other cases were grouped into the high‐grade category.( 28 ) All slides were evaluated for immunostaining in a blinded manner, without any clinical information. The negative controls for getting rid of the impact of nonspecific immunohistochemical staining were routinely included.
RNA extraction and semiquantitative RT‐PCR. Total RNA from LSCC Hep‐2 cells was extracted using Trizol Reagent (Fermentas Life Sciences, Burlington, ON, Canada) according to the manufacturer’s instructions. The total RNA (2 μg) was reverse transcribed using a RevertAid First Strand cDNA synthesis kit (Fermentas Life Sciences) in a 20‐μL reaction containing 1× reverse transcriptase (RT) reaction buffer (Fermentas Life Sciences), 0.5 μg oligo(dT)18 primer, and 1 μL RevertAid M‐MuLV (Fermentas Life Sciences) reverse transcriptase for 60 min at 42°C, and then heated for 10 min at 70°C. After heat inactivation of the RT at 94°C for 5 min, 1 μL of the RT reaction mixture and 19 μL of the polymerase chain reaction (PCR) mixture were mixed and then amplified with PCR. The DJ‐1 primers were: sense, 5′‐GCCAGCCTTGAAGATGCAAA‐3′; antisense, 5′‐GGCTTGTAAGAATCAGGCCGT‐3′. The S26 primers were: sense, 5′‐CCGTGCCTCCAAGATGACAAAG‐3′; antisense, 5′‐GTTCGGTCCTTGCGGGCTTCAC‐3′ (primers from Genewindows, Guangzhou, China). The conditions for PCR were 94°C for 45 s, 51°C for 45 s, and 72°C for 10 min for 29 cycles. The RT‐PCR products were then electrophoresed on 1.5% agarose gel containing ethidium bromide. S26 served as the positive control, and RT‐negative samples served as the negative control.
Western blotting. Eight GSCC and eight control tissues were selected randomly for western blot analysis. Proteins in tissues were isolated using the standard method. Cells were harvested and washed with cold phosphate‐buffered saline solution, and total proteins were extracted in lysis buffer. Immunoblotting experiments were performed according to standard procedures. Protein concentration was determined by the Bradford assay (Bio‐Rad Laboratories, Hercules, CA, USA). Equal amounts of protein were separated by electrophoresis on 12% SDS/polyacrylamide gels and transferred onto Biodyne A Membrane (Pall Gelman Laboratory, Ann Arbor, MI, USA). The membrane was probed with an anti‐DJ‐1 goat polyclonal antibody (1:2000; Santa Cruz Biotechnology). Expression of DJ‐1 was determined with horseradish peroxidase‐conjugated rabbit antigoat immunoglobulin G (1:2000; Santa Cruz Biotechnology). An anti‐GAPDH mouse monoclonal antibody (1:4000; Santa Cruz Biotechnology) was used as an internal loading control.
RNA silencing. Three pairs of DJ‐specific siRNA were designed in this study and an unrelated siRNA was used as negative control. Three pairs of DJ‐1‐specific siRNA were siRNA1 targeting GATTAAGGTCACCGTTGCA (positive‐sense strand, 5′‐GAUUAAGGUCACCGU UGCA‐3′; antisense strand, 3′‐CUAAUUCCAGUGGCAACGU‐5′), siRNA2 targeting GAATTTATCTGAGTCTGCT (positive‐sense strand, 5′‐GAAUUUAUCUGAGUC UGCU‐3′; antisense strand, 3′‐CUUAAAUAGA‐CUCAGACGA‐5′), and siRNA3 targeting TGATGAATGGAGGTCATTA (positive‐sense strand, 5′‐UGAUGAAUG GAGGUCAUUA‐3′; antisense strand, 3′‐ACUACUUACCUCCAG‐UAAU‐5′). Unrelated siRNA were negative control targeting TTCTCCGAACGTGTCACGT (positive‐sense strand, 5′‐UUCUCCGAACGUGUCACGU‐3′; antisense strand, 3′‐AAGAGGCUUGCA CAGUGCA‐5′).
LSCC Hep‐2 cells were cultured in RPMI‐1640 medium supplemented with 10% FCS, at 37°C with 5% CO2. For transfection, 2 mL of LSCC Hep‐2 cells were seeded in a six‐well plate at the concentration of 0.75 × 10⁵ cells/mL 24 to 48 h. When LSCC Hep‐2 cells grew to 30% to 50% confluence, cells were transfected with a mixture of 10 μL‐specific DJ‐1 siRNA (50 nm) or negative control DJ‐1 siRNA and 10 μL lipofectamine 2000 (Invitrogen, Carlsbad, CA, USA) in 2 mL serum‐free OptiMEMI per well. Five hours after transfection, the medium was replaced by RPMI‐1640 medium supplemented with 10% FCS and cultured for 72 h.
Flow cytometric analysis. The apoptosis of siRNA targeting DJ‐1 on the LSCC Hep‐2 cell line was evaluated using flow cytometric analysis. LSCC Hep‐2 cells were cultured in RPMI‐1640 medium supplemented with 10% FCS, at 37°C with 5% CO2. For transfection, 2 mL of LSCC Hep‐2 cells were seeded in a six‐well plate at the concentration of 0.75 × 10⁵ cells/mL 24 to 48 h. When LSCC Hep‐2 cells grew to 30% to 50% confluence, cells were transfected with a mixture of 10 μL‐specific DJ‐1 siRNA (50 nm) or negative control DJ‐1 siRNA and 10 μL lipofectamine 2000 (Invitrogen) in 2 mL serum‐free OptiMEMI per well. At 5 h after transfection, the medium was replaced by RPMI‐1640 medium supplemented with 10% FCS and cultured for 72 h. LSCC Hep‐2 cells were harvested and fixed in 70% ice‐cold (4°C) ethanol overnight at −20°C. Cell pellets were resuspended in PBS, and then in 20 μg/mL PI solution (BD Bioscience, San Diego, CA, USA) at 37°C for 30 min in the dark. Analyses were done in triplicate. In each analysis, a total of 104 cells were calculated.
MTT (3‐[4,5‐dimethylthiazol‐2,5‐diphenyltetrazolium bromide]) assay. LSCC Hep‐2 cells were seeded in a 96‐well plate at a concentration of 1 × 10⁴ cells/well for 24 h and transfected with DJ‐1‐specific siRNA or negative control siRNA by lipofectamine 2000 (Invitrogen). The cell cultures proliferation was analyzed at 72 h after transfection using MTT assay. All experiments were repeated three times, and the mean and SD were calculated.
Statistical analysis. Statistical analysis was performed with the SPSS software (SPSS Standard version 10.0; SPSS, Chicago, IL, USA). The association of DJ‐1 protein expression with GSCC patients’ clinicopathological features and the recorrelation between molecular features detected with each other were analyzed by the χ2 test or Fischer’s exact test. For survival analysis, we analyzed all GSCC patients by Kaplan–Meier analysis. The log‐rank test was used to compare different survival curves. Multivariate survival analysis was performed on all parameters using the Cox regression model. P < 0.05 was considered to be statistically significant.
Results
DJ‐1 expression in normal tissue and GSCCs. DJ‐1 was detected mainly in GSCCs and less frequently in adjacent normal tissues. A different pattern of DJ‐1 staining was observed within the cytoplasm of GSCCs from pT1 to pT4. In comparison, DJ‐1 staining in normal adjacent tissues was generally weaker and less common (Fig. 1a).
Figure 1.
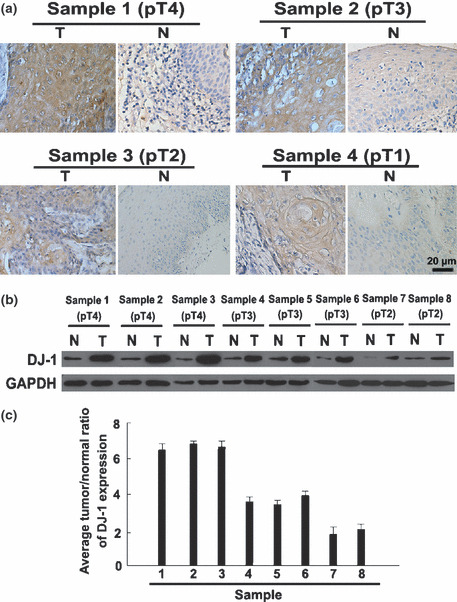
DJ‐1 expression level was up‐regulated in glottic squamous cell carcinoma (GSCC) specimens compared with adjacent normal specimens from the same patient. High expression of DJ‐1 was detected in high stage (pT3–pT4) GSCC specimens compared with low stage (pTis–pT2) GSCCs. Immunohistochemistry confirmed that DJ‐1 protein was up‐regulated in the GSCC tissue (T) compared with the paired adjacent normal tissue (N) from the same patient (a). Western blot analysis of DJ‐1 expression in each of the GSCC tissue (T) and adjacent normal tissue (N) paired from the same patient (b) and the average tumor/normal (T/N) ratios of DJ‐1 protein expression (c).
DJ‐1 staining was quantitatively assessed and grouped into low‐ or high‐grade categories. A summary of DJ‐1 expression in normal and GSCC tissues is given in Table 2. DJ‐1 expression was detected in 85% of GSCCs and in 52% of normal tissues examined. Moreover, 76% of GSCCs were assessed as high grade, whereas 77.3% of normal tissue had either no or low‐grade DJ‐1 staining. A significant difference in grade of DJ‐1 expression was demonstrated between GSCCs and adjacent normal tissues (P < 0.001). In addition, eight GSCC samples (from pT2–pT4) and eight adjacent normal tissues were selected for western blot analysis; the high level of DJ‐1 protein expression in GSCCs was the same as our data obtained with DJ‐1 immunostaining (Fig. 1b,c).
Table 2.
DJ‐1 expression in normal tissue and GSCCs
| DJ‐1 expression, n (%) | Total | |||
|---|---|---|---|---|
| Absent | Low | High | ||
| GSCC | 9 (15) | 6 (10.0) | 45 (75.0) | 60 |
| Normal | 21 (47.7) | 13 (29.6) | 10 (22.7) | 44 |
χ2 = 27.849; d.f. = 2; P = 0.000. GSCC, glottic squamous cell carcinoma.
Furthermore, we did not find any significant association between overall DJ‐1 staining intensity and patient age, gender, nodal status, and tumor grade. Only pT status (P = 0.046) and UICC clinical stage (P = 0.025) were linked to DJ‐1 expression (Table 3).
Table 3.
Relationship between DJ‐1 expression and various clinicopathological factors
| Characteristic | All cases | DJ‐1 low grade | DJ‐1 high grade | P‐values |
|---|---|---|---|---|
| All carcinomas | 60 | 15 | 45 | |
| Age (years) | ||||
| ≤61 | 34 | 9 | 25 | 1.000 |
| >61 | 26 | 6 | 20 | |
| Gender | ||||
| Male | 55 | 14 | 41 | 1.000 |
| Female | 5 | 1 | 4 | |
| pT status | ||||
| Tis‐2 | 43 | 14 | 29 | 0.046 |
| T3‐4 | 17 | 1 | 16 | |
| pN status | ||||
| N0 | 58 | 14 | 44 | 0.441 |
| N1‐3 | 2 | 1 | 1 | |
| UICC stage | ||||
| 0–II | 42 | 14 | 28 | 0.025 |
| III–IV | 18 | 1 | 17 | |
| Histological grade | ||||
| G1 | 27 | 5 | 22 | 0.375 |
| G2‐3 | 33 | 10 | 23 | |
UICC, International Union Against Cancer.
DJ‐1 expression and patient survival.
Univariate survival analysis. In univariate survival analyses, cumulative survival curves were calculated according to the Kaplan–Meier method (Table 4). Differences in survival were assessed with the long‐rank test. We analyzed the impact of all of the parameters on overall survival. The conventional prognostic markers tumor grade, pT status, nodal status, and UICC clinical reached significance for overall survival. DJ‐1 positivity was associated with overall survival (P = 0.001). Figure 2 illustrates the impact of DJ‐1 expression on survival times.
Table 4.
Univariate survival analyses (Kaplan–Meier): survival time of all patients with GSCC according to clinicopathological factors and DJ‐1 expresion
| Overall survial | ||||
|---|---|---|---|---|
| Characteristic | No. cases | No. events | 5‐year survival rate (±SE) | P‐values |
| DJ‐1 expression | ||||
| Low grade | 15 | 2 | 92.9 ± 6.9 | 0.001 |
| High grade | 45 | 15 | 66.6 ± 8.7 | |
| Gender | ||||
| Male | 55 | 16 | 78.5 ± 6.2 | 0.80 |
| Female | 5 | 1 | 66.7 ± 27.2 | |
| Age (years) | ||||
| ≤61 | 34 | 7 | 83.6 ± 7.6 | 0.16 |
| >61 | 26 | 10 | 70.1 ± 9.7 | |
| pT status | ||||
| Tis‐2 | 43 | 8 | 86.3 ± 5.7 | 0.01 |
| T3‐4 | 17 | 9 | 58.6 ± 13.8 | |
| pN status | ||||
| N0 | 58 | 16 | 77.1 ± 6.2 | 0.49 |
| N1‐3 | 2 | 1 | 0.0 | |
| UICC stage | ||||
| 0–II | 42 | 7 | 88.4 ± 5.5 | 0.002 |
| III–IV | 18 | 10 | 55.3 ± 13.0 | |
| Histological grade | ||||
| G1 | 27 | 8 | 77.6 ± 9.1 | 0.53 |
| G2‐3 | 33 | 9 | 78.1 ± 8.0 | |
GSCC, glottic squamous cell carcinoma; UICC, International Union Against Cancer.
Figure 2.
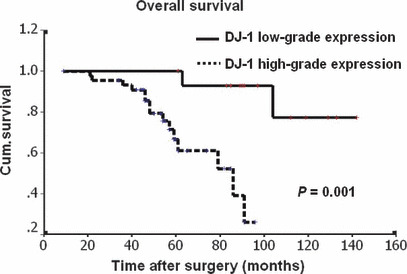
Kaplan–Meier curves with univariate analyses (log‐rank) comparing tumors with low‐grade DJ‐1 expression with those with high‐grade DJ‐1 expression. Patients with low‐grade DJ‐1 expression (bold line) had a cumulative 5‐year survival rate of 92.9% compared with 66.6% for patients with high‐grade DJ‐1 expression (dotted line).
Multivariate survival analysis. The Cox regression model was applied to test the influence of each parameter on overall survival. Since variables analysis may covariate, the expression of DJ‐1 and those clinical pathological parameters that were significant in univariate analysis (i.e. pT status, clinical stage) were further examined in multivariate analysis. In multivariate analysis, we included DJ‐1 expression (low grade vs high grade), clinical stage (I–II vs III–IV), and pT status (pTis–pT2 vs pT3–pT4). We tested the impact of DJ‐1 expression on overall survival. The results showed that the overall survival time was significantly dependent on pT status, clinical stage, and DJ‐1 expression (Table 5).
Table 5.
Results of the Cox regression model, conventional parameters, and DJ‐1 expression
| Overall survival (17 events) | |||
|---|---|---|---|
| Relative ratio | 95% Confidence interval | P‐values | |
| DJ‐1 | 10.382 | 1.123–96.005 | 0.039 |
| pT status | 34.341 | 2.023–582.827 | 0.014 |
| UICC stage | 0.019 | 0.001–0.321 | 0.006 |
UICC, International Union Against Cancer.
Down‐regulation of DJ‐1‐induced apoptosis of LSCC Hep‐2 cells. Hep‐2 cells were transfected with DJ‐1 or unrelated siRNA, and the expression of DJ‐1 mRNA and protein levels in LSCC Hep‐2 cells of siRNA1 were significantly lower than those of other and control siRNA (Fig. 3a). Hep‐2 cells were transfected with various concentrations of siRNA1 against DJ‐1 (20 nm, 50 nm, 100 nm) by lipofectamine plus (Invitrogen). Seventy‐two hours after transfection, the absorbance (A) value of cells was measured by MTT assay (n = 3). The results showed that Hep‐2 cell proliferation in the siRNA1 group (final concentration 50 nm, 100 nm) was inhibited (1.32 ± 0.08 vs 1.81 ± 0.57, P = 0.006; 1.45 ± 0.23 vs 0.94 ± 0.23, P = 0.000); the absorbance (A) value in the 20 nm siRNA1 and control groups showed no significant difference (1.02 ± 0.03 vs 1.35 ± 0.15, P = 0.253). The transient silencing of DJ‐1 significantly inhibited the proliferation of LSCC Hep‐2 cells compared with the negative control (Fig. 3b). Flow cytometry showed that DJ‐1‐siRNA1 enhanced cell apoptosis (Fig. 3c) (n = 3): the apoptosis rate of the siRNA1 was significantly higher than that of the negative control and the untransfected group (15.7 ± 4.8%vs 4.5 ± 0.36%, P = 0.002; 15.7 ± 4.8%vs 3.5 ± 1.4%, P = 0.003).
Figure 3.
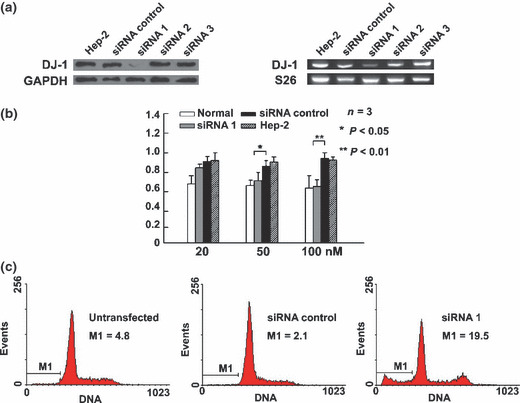
Down‐regulation of DJ‐1‐induced apoptosis of Hep‐2 cell. (a, b) Control siRNA and three specific DJ‐1 siRNAs (siRNA1, siRNA2, siRNA3) were introduced into Hep‐2 cells for 72 h. After transfection, the expression of DJ‐1 mRNA and protein levels in Hep‐2 cells of the DJ‐1 siRNA1 group were significantly lower than those of the nonspecific siRNA control group. Suppression of DJ‐1 expression was confirmed at the protein level by western blot analysis and at the transcript level by RT‐PCR (a). Hep‐2 cells were transfected with various concentrations of siRNA1 against DJ‐1 (20 nm, 50 nm, 100 nm) by lipofectamine plus. At 72 h after transfection, the absorbance A value of cells were measured by an MTT assay (n = 3). Asterisks indicate significant difference from transfection of siRNA targeting the DJ‐1 gene (b). Untransfected, control, or DJ‐1 siRNA1 (50 nm) were introduced into Hep‐2 cells for 72 h, after which they were stained with propidium iodide (PI), and cell cycle analysis was performed. Values correspond to the percentage of sub‐G1 cells or cell death as measured by flow cytometry (n = 3) (c).
Discussion
Current pTNM staging and histopathological grading systems are well established and are useful prognostic indicators for LSCC.( 29 ) Based on specific clinicopathological characteristics and extent of the disease, these parameters have their limits in providing critical information regarding patient prognosis and treatment strategies. Patients with the same clinical stage and/or pathological grade of laryngeal cancer often display considerable variability in disease recurrence and survival.( 3 ) Therefore, there is a need for new objective measures that can effectively differentiate between patients with favorable or unfavorable outcomes. Molecular biomarkers in conjunction with standard pTNM and/or histopathological strategies have the potential to be more effective in predicting prognosis.
Our study suggests DJ‐1 protein expression as a new prognostic marker in GSCC that retained its prognostic impact on overall survival both in univariate and multivariate analysis. Because the majority of GSCCs in our study were DJ‐1 positive, this new information is especially valuable for patients with DJ‐1‐negative tumors, who appear to carry a low risk of shortened overall survival, as shown in the Kaplan–Meier curves (Fig. 2). Thus, expression of DJ‐1 appears to have the potential to predict GSCC patients’ outcome. These results are consistent with previous findings that overexpression of DJ‐1 is associated with poor outcomes in malignant tumors. ( 16 , 17 , 18 , 19 )
In this immunohistochemistry‐based study, we examined the expression of DJ‐1 protein in GSCCs and adjacent normal tissues and, thus, made a comprehensive analysis of clinically characterized archive material possible. Our results indicate that DJ‐1 was highly expressed in the cytoplasm of GSCC cells in comparison to that of the adjacent normal tissues (P = 0.000). Furthermore, the data also showed that high expression of DJ‐1 protein was detected in high‐stage (pT3–pT4) GSCC specimens compared to low‐stage (pTis–pT2) GSCCs. The high expression of DJ‐1 protein in GSCCs also was confirmed by western blot study. These findings suggest the possibility that up‐regulated expression of DJ‐1 protein is actively involved in GSCC tumorigenic processes.
DJ‐1 is mapped at chromosome 1p36.2–p36.3, where a hotspot of chromosome abnormalities has been reported in several tumors.( 30 ) It was reported that DJ‐1 may play an important role in the development and/or progression of several solid tumors.( 21 , 22 , 23 ) and was commonly overexpressed in several types of human cancers, including ovarian,( 16 ) leukemia,( 17 ) esophagus,( 18 ) lung,( 24 ) prostate,( 25 , 31 ) breast,( 26 ) liver carcinoma,( 32 ) and uveal melanoma tumor.( 33 ) Interestingly, a recent study has revealed that DJ‐1 is a regulator of the tumor suppressor phosphatase and tension homology deleted on chromosome 10.( 16 , 19 ) To confirm whether DJ‐1 is involved in the tumorigenic processes in GSCC, the role of DJ‐1 in the proliferation and apoptosis of Hep‐2 cells was investigated in this present study. The MTT assay showed that the DJ‐1 siRNA1 group inhibited proliferation of LSCC Hep‐2 cells. Flow cytometry showed that the apoptosis rate of the DJ‐1 siRNA1 group (15.7%) was significantly higher than that of the siRNA control group. RNAi transfection of siRNA‐DJ‐1 in LSCC Hep‐2 cells not only reduced cell growth, but also enhanced apoptosis in vitro. Suppression of DJ‐1 protein led to cell cycle arrest and apoptotic cell death of LSCC Hep‐2 cells. Taken together, our results suggest the potential importance of DJ‐1 in the control of GSCC cell apoptosis and in induction of proliferation, an important activity in GSCC tumorigenesis. Also, this may partly explain the relationship between DJ‐1 expression and pT status in GSCC.
In conclusion, we reported the protein expression of DJ‐1 in GSCC and adjacent normal tissues. Our results provide evidence that high expression of DJ‐1 in human GSCC cells led to a poor prognostic phenotype, suggesting that the expression of DJ‐1 is a valuable factor in determining the prognosis of patients with GSCC. This might help the clinician to individualize the surveillance scheme/therapy; for example, by favoring a more aggressive regimen in strongly DJ‐1‐positive tumors.
Acknowledgment
This work was supported by the Natural Science Foundation of Guangdong Province (grant no. 81510008901000153).
References
- 1. Parkin DM, Bray F, Ferlay J, Pisani P. Global cancer statistics, 2002. CA Cancer J Clin 2005; 55: 74–108. [DOI] [PubMed] [Google Scholar]
- 2. Marioni G, Marchese‐Ragona R, Cartei G, Marchese F, Staffier A. Current opinion in diagnosis and treatment of laryngeal carcinoma. Cancer Treat Rev 2006; 32: 504–15. [DOI] [PubMed] [Google Scholar]
- 3. Kleinsasser O. Revision of classification of laryngeal cancer; is it long overdue? (Proposals for an improved TN‐classification) J Laryngol Otol 1992; 106: 197–204. [DOI] [PubMed] [Google Scholar]
- 4. Rumsby G, Carter RL, Gusterson BA. Low incidence of ras oncogene activation in human squamous cell carcinomas. Br J Cancer 1990; 61: 365–8. [DOI] [PMC free article] [PubMed] [Google Scholar]
- 5. Scambia G, Catozzi L, Benedetti Panici P et al. Expression of ras oncogene p21 protein in normal and neoplastic laryngeal tissues: correlation with histopathological features and epidermal growth factor receptors. Br J Cancer 1994; 69: 995–9. [DOI] [PMC free article] [PubMed] [Google Scholar]
- 6. Haughey BH, Von Hoff DD, Windle BE, Wahl GM, Mock PM. A c‐myc oncogene copy number in squamous carcinoma of the head and neck. Am J Otolaryngol 1992; 13: 168–71. [DOI] [PubMed] [Google Scholar]
- 7. Almadori G, Cadoni G, Maurizi M et al. Oncogenes and cancer of the larynx. EGFR, p21 ras and HPV‐DNA infections. Acta Otorhinolaryngol Ital 1995; 15(1 Suppl 46): 1–22. [PubMed] [Google Scholar]
- 8. Jares P, Femandez PL, Campo E et al. PRAD‐1/cyclin D1 gene amplification correlates with messenger RNA overexpression and tumor progression in human laryngeal carcinomas. Cancer Res 1994; 54: 4813–7. [PubMed] [Google Scholar]
- 9. Motamed M, Banerjee AR, Bradley PJ, Powe D. MIB‐1 and p53 expression in radiotherapy‐resistant T1aN0M0 glottic squamous cell carcinoma. Clin Otolaryngol Allied Sci 2001; 26: 227–30. [DOI] [PubMed] [Google Scholar]
- 10. Gallo O, Santucci M, Franchi A. Cumulative prognostic value of p16/CDKN2 and p53 oncoprotein expression in premalignant laryngeal lesions. J Natl Cancer Inst 1997; 89: 1161–3. [DOI] [PubMed] [Google Scholar]
- 11. Yang YF, Gehrke S, Haque ME et al. Inactivation of Drosophila DJ‐1 leads to impairments of oxidative stress response and phosphatidylinoditol 3‐kinase/ Akt signaling. Proc Natl Acad Sci U S A 2005; 102: 13670–5. [DOI] [PMC free article] [PubMed] [Google Scholar]
- 12. Wei Y, Ringe D, Wilson MA, Ondrechen MJ. Identification of functional subclasses in the DJ‐1 superfamily proteins. PloS Comput Biol 2007; 3: 0120–6. [DOI] [PMC free article] [PubMed] [Google Scholar]
- 13. Taira T, Saito Y, Niki T, Iguchi‐Ariga SM, Takahashi K, Ariga H. DJ‐1 has a role in antioxidative stress to prevent cell death. EMBO Rep 2004; 5: 213–8. [DOI] [PMC free article] [PubMed] [Google Scholar]
- 14. Yokota T, Sugawara K, Ito K, Takahahi R, Ariga H, Mizusawa H. Down regulation of DJ‐1 enhances cell death by oxidative stress, ER stress, and proteasome inhibition. Biochem Biophys Res Commun 2003; 312: 1342–8. [DOI] [PubMed] [Google Scholar]
- 15. Zhang HY, Wang HQ, Liu HM, Guan Y, Du ZX. Regulation of tumor necrosis factor‐related apoptosis‐inducing ligand‐induced apoptosis by DJ‐1 in thyroid cancer cells. Endocr Relat Cancer 2008; 15: 535–44. [DOI] [PubMed] [Google Scholar]
- 16. Davidson B, Hadar R, Schlossberg A et al. Expression and clinical role of DJ‐1, a negative regulator of PTEN, in ovarian carcinoma. Hum Pathol 2008; 39: 87–95. [DOI] [PubMed] [Google Scholar]
- 17. Liu H, Wang M, Li M et al. Expression and role of DJ‐1 in leukemia. Biochem Biophys Res Commun 2008; 375: 477–83. [DOI] [PubMed] [Google Scholar]
- 18. Yuen HF, Chan YP, Law S et al. DJ‐1 could predict worse prognosis in esophageal squamous cell carcinoma. Cancer Epidemiol Biomarkers Prev 2008; 17: 3593–602. [DOI] [PubMed] [Google Scholar]
- 19. Kim RH, Peters M, Jang Y et al. DJ‐1, a novel regulator of the tumor suppressor PTEN. Cancer Cell 2005; 7: 263–73. [DOI] [PubMed] [Google Scholar]
- 20. Junn E, Taniguchi H, Jeong BS, Zhao X, Mouradian MM. Interaction of DJ‐1 with Daxx inhibits apoptosis signal‐regulating kinase 1 activity and cell death. Proc Natl Acad Sci U S A 2005; 102: 9691–6. [DOI] [PMC free article] [PubMed] [Google Scholar]
- 21. Shinbo Y, Taira T, Niki T, Lguchi‐Ariga SM, Ariga H. DJ‐1 restores p53 transcription activity inhibited by Topors/p53BP3. Int J Oncol 2005; 26: 641–8. [PubMed] [Google Scholar]
- 22. Clements CM, McNally RS, Conti BJ, Mak TW, Ting JP. DJ‐1, a cancer‐ and Parkinson’s disease‐associated protein, stabilizes the antioxidant transcriptional master regulator Nrf2. Proc Natl Acad Sci U S A 2006; 103: 15091–6. [DOI] [PMC free article] [PubMed] [Google Scholar]
- 23. Nagakubo D, Taira T, Kitaura H et al. DJ‐1, a novel oncogene which transforms mouse NIH3T3 cells in cooperation with ras. Biochem Biophys Res 1997; 231: 509–13. [DOI] [PubMed] [Google Scholar]
- 24. MacKeigan JP, Clements CM, Lich JD, Pope RM, Hod Y, Ting JP. Proteomic profiling drug‐induced apoptosis in non‐small cell lung carcinoma: identification of RS/DJ‐1 and RhoGDIalpha. Cancer Res 2003; 63: 6928–34. [PubMed] [Google Scholar]
- 25. Hod Y. Differential control of apoptosis by DJ‐1 in prostate benign and cancer cells. J Cell Biochem 2004; 92: 1221–3. [DOI] [PubMed] [Google Scholar]
- 26. Le Naour F, Misek DE, Krause MC et al. Proteomics‐based identification of RS/DJ‐1 as a novel circulating tumor antigen in breast cancer. Clin Cancer Res 2001; 7: 3328–35. [PubMed] [Google Scholar]
- 27. Tian M, Cui YZ, Song GH et al. Proteomic analysis identifies MMP‐9, DJ‐1 and A1BG as overexpressed proteins in pancreatic juice from pancreatic ductal adenocarcinoma patients. BMC Cancer 2008; 8: 241. [DOI] [PMC free article] [PubMed] [Google Scholar]
- 28. Kristiansen G, Winzer KJ, Mayordomo E et al. CD24 expression is a new prognostic marker in breast cancer. Clin Cancer Res 2003; 9: 4906–13. [PubMed] [Google Scholar]
- 29. Sobin LH, Wittekind C, eds. TNM: Classification of Malignant Tumours. 5th ed. New York, NY: John Wiley & Sons Inc; 1997. [Google Scholar]
- 30. Taira T, Takahashi K, Kitagawa R, Lguchi‐Ariga SM, Ariga H. Molecular cloning of human and mouse DJ‐1 genes and identification of Sp1dependent activation of the human DJ‐1 promoter. Gene 2001; 263: 285–92. [DOI] [PubMed] [Google Scholar]
- 31. Tillman JE, Yuan J, Gu G et al. DJ‐1 binds androgen receptor directly and mediates its activity in hormonally treated prostate cancer cells. Cancer Res 2007; 67: 4630–7. [DOI] [PubMed] [Google Scholar]
- 32. Zhang D, Lim SG, Koay ES. Proteomic identification of down‐regulation of oncoprotein DJ‐1 and proteasome activator subunit 1 in hepatitis B virus‐infected well‐differentiated hepatocellular carcinoma. Int J Oncol 2007; 31: 577–84. [PubMed] [Google Scholar]
- 33. Pardo M, Garcia A, Thomas B et al. The characterization of the invasion phenotype of uveal melanoma tumour cells shows the presence of MUC18 and HMG‐1 metastasis markers and leads to the identification of DJ‐1 as a potential serum biomarker. Int J Cancer 2006; 119: 1014–22. [DOI] [PubMed] [Google Scholar]