

Abstract
This study aimed to determine the expression profiles of microRNAs (miRNAs) in endometrial serous adenocarcinoma and to examine the association between miRNA expression and clinical outcomes. Twenty‐one patients diagnosed with endometrial serous adenocarcinoma between January 2001 and December 2006 were enrolled. miRNA expression profiles were examined using miRNA microarray and qRT‐PCR. miRNA expression levels were correlated with clinicopathological variables and survival rates. A total of 120 miRNAs were differentially expressed in endometrial serous adenocarcinoma compared to normal endometria. Of these, 54 miRNAs were down‐regulated (>2‐fold), including miR‐101, miR‐10b*, miR‐152, and miR‐29b, and the remainder were up‐regulated (>2‐fold), including miR‐200a, miR‐200b, and miR‐205. Decreased expression of miR‐10b*, miR‐29b, and miR‐455‐5p was correlated with vascular invasion (P = 0.048, P = 0.013, and P = 0.032, respectively). Univariate analysis revealed that lower expression of miR‐101, miR‐10b*, miR‐139‐5p, miR‐152, miR‐29b, and miR‐455‐5p was significantly correlated with poor overall survival (P < 0.05), and reduced expression of miR‐152, miR‐29b, and miR‐455‐5p was significantly correlated with poor disease‐free survival (P < 0.05). Multivariate analysis demonstrated that decreased expression of miR‐152 (P = 0.021) was a statistically independent risk factor for overall survival, and decreased expression levels of miR‐101 (P = 0.016) and miR‐152 (P = 0.010) were statistically independent risk factors for disease‐free survival. In addition, transfection of miR‐101 or miR‐152 precursors into an endometrial serous carcinoma cell line inhibited cell growth (P < 0.0001 and P = 0.01, respectively). Moreover, strong positive immunoreactivity of cyclooxygenase‐2 (COX‐2) was significantly correlated with down‐regulation of miR‐101 (P = 0.035). These findings suggest that the dysregulation of miRNAs is associated with the poor prognosis in endometrial serous adenocarcinoma patients. (Cancer Sci 2009)
Serous adenocarcinoma of the endometrium was first identified as a distinct clinical entity by Hendrickson et al. in 1982.( 1 ) This disease accounts for 10% of all endometrial cancers and generally occurs in postmenopausal women.( 2 ) Serous adenocarcinoma is considered to be an aggressive tumor with a high relapse rate, early and deep myometrial invasion, and frequent lymphovascular space involvement.( 1 , 2 ) Patients without any myometrial invasion are as likely to have extrauterine disease as those with deeply invasive tumors.( 3 ) The 5‐year survival rate for stage I serous adenocarcinomas varies from 15 to 51%.( 4 ) Thus, the prognosis of these patients is similar to or worse than that of patients with grade 3 endometrial carcinomas confined to the uterus.( 5 , 6 ) The identification of new prognostic factors may facilitate the development of novel treatments, thereby leading to an improved clinical outcome for this uncommon, highly aggressive tumor.
MicroRNAs (miRNAs) are noncoding, single‐stranded RNAs of 18 to 24 nucleotides in length that constitute a novel class of gene regulators. miRNAs function as guide molecules by base‐pairing with the mRNAs that are partially complementary to the miRNAs in miRNA‐associated effector complexes.( 7 ) The binding of miRNAs to their target mRNAs leads to translational repression or decreases the stability of the mRNA molecule.( 7 ) miRNAs have a profound impact on many processes that are frequently disrupted during malignant transformation, including cell proliferation,( 8 ) apoptosis, stress responses, maintenance of stem cell potency, and metabolism.
Several miRNAs have emerged as candidate components of oncogene and tumor suppressor gene networks. The miR‐17‐92 cluster, as well as miR‐155 and miR‐372‐373, have been identified as proto‐oncogenes in B‐cell lymphomas and testicular tumors.( 9 , 10 ) The miR‐17‐92 cluster accelerates c‐Myc–induced oncogenesis in a mouse model of B‐cell lymphoma.( 11 ) In contrast, some miRNAs act as tumor suppressors by suppressing expression of oncogenes. For instance, miR‐15a and miR‐16, which can induce apoptosis by targeting the anti‐apoptotic gene Bcl‐2, are frequently lost in B‐cell chronic lymphocytic leukemia (CLL) due to chromosomal deletions.( 12 , 13 ) The let‐7 family, which is down‐regulated in lung cancers in which RAS is frequently mutated,( 14 ) negatively regulates RAS.( 15 ) Moreover, several reports have identified metastasis‐mediating miRNAs.( 16 ) These findings suggest that aberrant miRNA expression contributes not only to tumorigenesis but also to metastasis. Under normal physiological conditions, individual miRNAs show strict tissue‐ and developmental‐stage‐specific expression patterns. In contrast, miRNAs display unique expression patterns depending on clinical features in several cancers, including CLL,( 17 ) breast cancer,( 18 ) and lung cancer,( 19 ) suggesting that some miRNAs could be used as diagnostic and/or prognostic markers.
In this study, we investigated miRNA expression profiles in specimens from patients with serous adenocarcinoma of the endometrium and attempted to identify miRNAs capable of predicting clinical prognosis as novel clinical biomarkers.
Materials and Methods
Cell lines and tissue samples. The established human endometrial serous carcinoma cell line SPAC‐1‐L was provided by the laboratory of Dr. Hirai from the Department of Gynecology, Cancer Institute Hospital (Tokyo, Japan).( 20 ) This cell line was cultured in the appropriate medium and passed at confluence to a 10‐cm2 dish (Becton Dickinson, Lincoln Park, NJ, USA). The dishes were incubated at 37°C in a CO2 incubator supplied with humidified 5% CO2 and 95% air. The medium was changed twice a week.
After obtaining informed consent, 21 serous adenocarcinoma tissues and seven normal endometrial tissues (four proliferative phase, three secretory phase) were retrieved from surgical pathology files at Tohoku University Hospital (Sendai, Japan). The clinical data and patient information are shown in Table 1. The research protocol was approved by the Ethics Committee at Tohoku University Graduate School of Medicine (Sendai, Japan). All specimens were obtained from surgery that was performed from January 2001 to December 2006 at Tohoku University Hospital (Sendai, Japan). We also obtained non‐pathologic endometrial tissue as a normal control from hysterectomy specimens performed due to non‐endometrial carcinomas. All endometrial carcinoma specimens were obtained during hysterectomy. No patient had received preoperative irradiation or chemotherapy. Information about age, performance status on admission, histology including the percentage of the tumor comprised of serous adenocarcinoma, stage, degree of myometrial invasion, degree of lymphovascular space invasion, degree of lymph node invasion, and overall survival was retrieved from patient charts. The median follow‐up time of patients examined in this study was 23 months (range, 3–64 months). Disease‐free survival and overall survival were calculated from the time of initial surgery to recurrence and/or death or the date of last contact. Survival times of patients still alive or lost to follow‐up were censored in September 2008. The standard primary treatment for endometrial carcinoma at Tohoku University Hospital was surgery consisting of total abdominal hysterectomy, salpingo‐oophorectomy, pelvic and/or para‐aortic lymphadenectomy, and cytologic analysis of peritoneal washings. If the patient was diagnosed with serous adenocarcinoma by curettage before surgical treatment, omentectomy was also performed. Of the 21 patients, 19 patients received platinum‐based chemotherapy and one patient underwent postoperative radiotherapy. The lesions were classified according to the histological typing of female genital tract tumors by the World Health Organization and staged according to the International Federation of Gynecology and Obstetrics system.( 21 , 22 ) This study only enrolled patients whose endometrial carcinoma was comprised of pure serous adenocarcinoma and did not have any other histological components. These specimens were processed in 10% formalin, fixed for 24–48 h, paraffin embedded, and thin (3 μm) sectioned. All of these archival specimens were embedded immediately in OCT compound (Sakura Finetechnical, Tokyo, Japan) and stored at −80°C until further use. Only sections containing a minimum of 90% carcinoma by examination with hematoxylin–eosin staining were used for total RNA preparation.
Table 1.
Patient and clinical data
| Total (n = 21) | % | |
|---|---|---|
| Median age (years) | 64.9 (54–87) | |
| Death | 11 | 52.4 |
| Stage | ||
| I | 8 | 38.1 |
| II | 2 | 9.5 |
| III | 3 | 14.3 |
| IV | 8 | 38.1 |
| Myometrial invasion | ||
| Absent | 8 | 38.1 |
| <1/2 | 7 | 33.3 |
| ≧1/2 | 6 | 28.6 |
| Lymph node metastasis† | ||
| Absent | 13 | 61.9 |
| Present | 2 | 9.5 |
| Vascular invasion | ||
| Absent | 16 | 76.2 |
| Present | 5 | 23.8 |
| COX‐2 immunoreactivity | ||
| Weakly positive | 10 | 47.6 |
| Strongly positive | 11 | 52.4 |
†Six patients did not receive lymphadenectomy. COX‐2, cyclooxygenase 2.
Immunohistochemistry. Immunohistochemical analysis was performed employing the streptavidin–biotin amplification method using a Histofine kit (Nichirei, Tokyo, Japan). Goat polyclonal antibody for cyclooxygenase (COX)‐2 (C‐20) was purchased from Santa Cruz Biotechnology (Santa Cruz, CA, USA). For immunostaining of COX‐2, the slides were heated in an autoclave at 120°C for 5 min in 0.01M citric acid buffer (2 mmol/L citric acid and 9 mmol/L trisodium citrate dehydrate [pH 6.0]) following deparaffinization for antigen retrieval. The primary antibody was diluted 1:500. The antigen–antibody complex was visualized with 3,3′‐diaminobenzidine solution (1 mmol/L 3,3′‐diaminobenzidine, 50 mmol/L Tris‐HCl buffer [pH 7.6], and 0.006% H2O2) and counterstained with hematoxylin. Tissue sections of kidney were used as positive controls. For COX‐2 expression, the distribution and intensity was scored according to the method which has been previously described:( 23 ) negative, weakly positive, and strongly positive. The immunohistochemical expression was independently reviewed by two of the authors (E. H. and J. A.).
MicroRNA isolation and microarray analysis. For microRNA microarray and further studies, total RNA, including miRNA, was isolated from frozen pure and typical serous adenocarcinoma tissues and normal endometrial tissues using the miRNeasy Mini Kit (Qiagen, Valencia, CA, USA) according to the manufacturer’s instructions. Frozen tissues were homogenized in QIAzol Lysis reagent (Qiagen). RNA purity and concentration were confirmed by spectrophotometry using the NanoDrop ND‐1000 (NanoDrop Technologies, Wilmington, DE, USA) and the Agilent 2100 Bioanalyzer (Agilent Technologies, Santa Clara, CA, USA).
miRNA microarrays were manufactured by Agilent Technologies and contained 20–40 features targeting each of the 470 human miRNAs. The labeling and hybridization of total RNA samples were performed according to the manufacturer’s protocol. Total RNA (100 ng) was dephosphorylated with calf intestine alkaline phosphatase (Takara Biomedicals, Tokyo, Japan), denatured with dimethyl sulfoxide, and labeled with pCp‐Cy3 using T4 RNA ligase (Ambion, Austin, TX, USA). After hybridization and washing, the arrays were scanned with an Agilent microarray scanner using high dynamic range settings as specified by the manufacturer. Microarray results were extracted using Agilent Feature Extraction software version 9.5.3.1 (Agilent Technologies) and analyzed using Gene Spring GX 7.3.1 software (Agilent Technologies) to obtain gene expression ratios.
Quantitative real‐time RT‐PCR. Quantitative RT‐PCR analysis was performed using Taqman MicroRNA Assays (Applied Biosystems, Foster City, CA, USA), according to the manufacturer’s protocol. cDNA was made from 5 ng total RNA from each sample using the TaqMan MicroRNA Reverse Transcription Kit (Applied Biosystems) and miRNA specific primers (Applied Biosystems) for eight down‐regulated (miR‐101, miR‐10b*, miR‐133a, miR‐133b, miR‐152, miR‐29b, miR‐34b, and miR‐411) and three up‐regulated (miR‐200a, miR‐200b, and miR‐205) miRNA species. Reactions were performed on an ABI 7500 thermocycler (Applied Biosystems), with cycle threshold values determined using the manufacturer’s software. Negative control reactions without RNA and without reverse transcriptase were also performed. U6 snRNA (RNU6B; Applied Biosystems) served as an endogenous control. The fold‐change for each miRNA, relative to RNU6B, was calculated using the 2−ΔΔCt method.( 24 ) Two independent RT‐PCR reactions were performed.
Transfection of precursor miRNA and cell proliferation assay. SPAC‐1‐L cells (1 × 10⁵) were transfected with 100 pmol of Pre‐miR miRNA Precursor Molecules (Applied Biosystems) or Pre‐miR miRNA Molecules Negative Control 1 (Applied Biosystems) using a Lipofectamine RNAi MAX (Invitrogen, Carlsbad, CA, USA) according to the manufacturer’s instructions. For biological assays, cells were used 72 h after transfection. All experiments were performed in duplicate, and each experiment was repeated independently in triplicate. The cell number was evaluated using a Cell counting kit‐8 (Dojindo, Kumamoto, Japan) according the manufacturer’s instructions.
Statistical analysis. Raw microarray data were normalized and analyzed using the Gene Spring GX 7.3.1 software (Agilent Technologies). Expression data were median centered. Statistical analysis was performed using StatView software version 5.0 (SAS Institute, Cary, NC, USA). miRNAs that had a >2‐fold change were considered to have significant differential expression compared to normal endometrium. The Mann–Whitney U‐test was performed to identify miRNAs that demonstrated statistically significant differential expression between normal endometrium and carcinoma tissues, and to evaluate differences between miRNA expression and patient characteristics. For survival analysis and generation of Kaplan–Meier survival curves, miRNA levels measured on miRNA chips were converted into discrete variables by splitting the samples into two classes (high and low expression), using the respective median level of miRNA expression levels as a threshold. Survival curves were compared by log‐rank analysis. Significance was accepted with 95% confidence. Multivariate analysis was performed using the Cox proportional hazards model. Results were expressed as means ± SD and analyzed by one‐way anova and the Bonferroni test for cell proliferation assays. P < 0.05 was considered to be statistically significant.
Results
Distinct microRNA signatures in endometrial serous adenocarcinoma compared to normal endometrial tissues. miRNA microarray analysis was used to identify miRNAs that were differentially expressed between endometrial serous carcinoma and normal endometrial tissue (Fig. 1). Table 2 lists the differentially expressed miRNAs with at least a 2‐fold change in expression. A total of 66 miRNAs were up‐regulated and 54 were down‐regulated in endometrial serous carcinoma. Of these miRNAs, miR‐205 exhibited the largest degree of up‐regulation (267.8‐fold), and miR‐133a displayed the smallest degree of down‐regulation (142.1‐fold) (Table 2).
Figure 1.

Unsupervised hierarchical clustering analysis of microRNAs (miRNAs) that exhibited a >2‐fold increase or decrease in expression in endometrial serous adenocarcinoma. The level of miRNA expression is color‐coded as follows: red, higher miRNA expression; green, lower miRNA expression; black, no difference. The bar at the bottom indicates the group of cancer samples (blue) or normal endometrial tissues (yellow). Normal, normal endometrial tissues; ESC, endometrial serous adenocarcinoma. *1, secretory phase; *2; proliferative phase.
Table 2.
Differentially expressed miRNAs with >2‐fold change in endometrial serous adenocarcinoma vs normal endometrial tissues
| miRNA | P‐values | Fold change |
|---|---|---|
| Down | ||
| miR‐1 | 0.002 | 15.7 |
| miR‐101 | 0.016 | 3.59 |
| miR‐10b* | 0.028 | 2.27 |
| miR‐127‐3p | 0.036 | 4.5 |
| miR‐132* | 0.003 | 2.04 |
| miR‐133a | 0.001 | 142.1 |
| miR‐133b | 0.003 | 27.8 |
| miR‐136 | <0.001 | 11.6 |
| miR‐136* | 0.002 | 21.3 |
| miR‐139‐5p | 0.009 | 9.42 |
| miR‐140‐3p | 0.021 | 2.83 |
| miR‐140‐5p | 0.002 | 3.86 |
| miR‐142‐3p | 0.005 | 3.18 |
| miR‐142‐5p | 0.01 | 2.69 |
| miR‐143 | 0.002 | 8.6 |
| miR‐143* | 0.001 | 15.5 |
| miR‐145 | 0.005 | 7.15 |
| miR‐145* | 0.005 | 6.31 |
| miR‐152 | <0.001 | 4.09 |
| miR‐195 | <0.001 | 10.5 |
| miR‐196b | 0.004 | 6.16 |
| miR‐199a‐5p | 0.009 | 5.92 |
| miR‐199b‐3p | 0.01 | 4.98 |
| miR‐199b‐5p | 0.012 | 7.08 |
| miR‐214 | 0.009 | 5.13 |
| miR‐214* | 0.009 | 13.6 |
| miR‐23b | 0.014 | 3.8 |
| miR‐24‐1* | 0.001 | 4.6 |
| miR‐27b | 0.016 | 3.82 |
| miR‐299‐3p | 0.004 | 9.43 |
| miR‐299‐5p | 0.002 | 26.9 |
| miR‐29b | 0.032 | 2.25 |
| miR‐33a | 0.002 | 6.1 |
| miR‐337‐5p | 0.005 | 17.1 |
| miR‐34b | 0.014 | 40.2 |
| miR‐34b* | 0.016 | 2.97 |
| miR‐34c‐5p | 0.014 | 6.17 |
| miR‐376a | 0.024 | 8.29 |
| miR‐376c | 0.018 | 6.74 |
| miR‐377 | 0.001 | 27.2 |
| miR‐379 | 0.005 | 6.53 |
| miR‐381 | 0.01 | 9.43 |
| miR‐410 | 0.028 | 6.38 |
| miR‐411 | 0.016 | 22.2 |
| miR‐424 | <0.001 | 24.8 |
| miR‐450a | <0.001 | 8.45 |
| miR‐455‐3p | 0.024 | 2.57 |
| miR‐455‐5p | 0.032 | 2.41 |
| miR‐497 | <0.001 | 11.3 |
| miR‐503 | <0.001 | 15.1 |
| miR‐542‐3p | <0.001 | 16.7 |
| miR‐542‐5p | 0.005 | 8.878 |
| miR‐654‐3p | 0.028 | 14.3 |
| miR‐873 | 0.001 | 17.6 |
| Up | ||
| miR‐106a | 0.047 | 2.08 |
| miR‐10a | 0.01 | 3.43 |
| miR‐10a* | 0.004 | 9.51 |
| miR‐1224‐5p | 0.001 | 3.7 |
| miR‐1225‐5p | 0.003 | 3.11 |
| miR‐1226* | 0.001 | 14.8 |
| miR‐125a‐3p | 0.001 | 2.62 |
| miR‐134 | 0.016 | 2.71 |
| miR‐135a* | <0.001 | 50.8 |
| miR‐135b | <0.001 | 10.4 |
| miR‐150* | 0.001 | 4.32 |
| miR‐17 | 0.014 | 2.32 |
| miR‐182 | 0.003 | 72.9 |
| miR‐183 | 0.001 | 8.49 |
| miR‐188‐5p | <0.001 | 4.24 |
| miR‐18a | 0.002 | 3.98 |
| miR‐18b | 0.012 | 2.84 |
| miR‐193a‐5p | 0.006 | 2.56 |
| miR‐198 | <0.001 | 54.2 |
| miR‐200a | 0.012 | 2.89 |
| miR‐200a* | <0.001 | 29.5 |
| miR‐200b | 0.004 | 3.82 |
| miR‐200b* | 0.001 | 6.93 |
| miR‐200c | 0.012 | 2.68 |
| miR‐202 | 0.002 | 24.9 |
| miR‐203 | 0.001 | 8.95 |
| miR‐205 | <0.001 | 267.8 |
| miR‐210 | 0.002 | 3.17 |
| miR‐223 | 0.01 | 4.45 |
| miR‐224 | 0.047 | 2.82 |
| mIR‐23a* | <0.001 | 56.6 |
| miR‐30c‐2* | 0.002 | 4.36 |
| miR‐31 | 0.041 | 2.45 |
| miR‐330‐3p | 0.021 | 8.17 |
| miR‐33b* | <0.001 | 7.57 |
| miR‐371‐5p | <0.001 | 10.8 |
| miR‐425 | 0.005 | 3.14 |
| miR‐429 | 0.001 | 4.61 |
| miR‐483‐5p | 0.001 | 4.64 |
| miR‐494 | 0.001 | 4.36 |
| miR‐501‐5p | 0.028 | 2.98 |
| miR‐505* | 0.047 | 2.36 |
| miR‐513a‐5p | 0.001 | 31.3 |
| miR‐513b | 0.002 | 6.56 |
| miR‐518c* | <0.001 | 128 |
| miR‐557 | 0.003 | 3.36 |
| miR‐564 | 0.021 | 2.39 |
| miR‐575 | 0.002 | 5.2 |
| miR‐601 | 0.001 | 5.21 |
| miR‐622 | <0.001 | 70.2 |
| miR‐623 | 0.001 | 9.81 |
| miR‐629* | 0.002 | 120.8 |
| miR‐630 | <0.001 | 13.8 |
| miR‐652 | 0.018 | 2.21 |
| miR‐663 | <0.001 | 13.7 |
| miR‐7 | 0.001 | 3.64 |
| miR‐760 | 0.012 | 3.53 |
| miR‐765 | <0.001 | 48.7 |
| miR‐768‐5p | 0.014 | 2.89 |
| miR‐801 | <0.001 | 4.28 |
| miR‐877 | <0.001 | 10.4 |
| miR‐892b | 0.004 | 4.86 |
| miR‐923 | 0.004 | 3.16 |
| miR‐939 | 0.002 | 2.42 |
| miR‐95 | 0.014 | 2.93 |
| miR‐96 | 0.005 | 3.65 |
P‐values <0.05 were considered significant.
Validation of microarray results. To validate the microarray results, quantitative RT‐PCR analysis of the differentially expressed miRNAs was independently performed. The following miRNAs that were differentially expressed between normal endometrial tissue and endometrial serous carcinoma tissue were selected: miR‐101, miR‐10b*, miR‐133a, miR‐133b, miR‐152, miR‐29b, miR‐34b, miR‐411 miR‐200a, miR‐200b, and miR‐205 (Fig. 2). In agreement with the microarray results, miR‐101, miR‐10b*, miR‐133a, miR‐133b, miR‐152, miR‐29b, miR‐34b, miR‐411 were down‐regulated, whereas miR‐205 was up‐regulated in endometrial serous carcinoma. miR‐200a and miR‐200b also appeared to be up‐regulated, but not to a statistically significant degree (data not shown).
Figure 2.
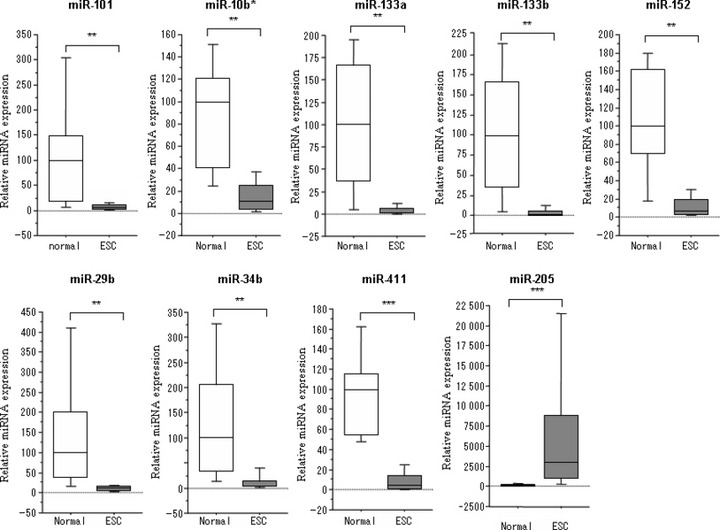
Quantitative RT‐PCR of nine different miRNA species (miR‐101, miR‐10b*, miR‐133a, miR‐133b, miR‐152, miR‐29b, miR‐34b, miR‐411, and miR‐205). Expression of miR‐101, miR‐10b*, miR‐133a, miR‐133b, miR‐152, miR‐29b, miR‐34b, and miR‐411 was down‐regulated, while miR‐205 expression was up‐regulated in endometrial serous adenocarcinoma. Normal, normal endometrial tissues; ESC, endometrial serous adenocarcinoma. **P < 0.01; ***P < 0.001.
Correlation between microRNA expression and clinicopathological parameters in patients with endometrial serous adenocarcinoma. We next analyzed results from miRNA expression profiles in endometrial serous carcinoma to evaluate whether a correlation existed with various clinicopathological features associated with tumor specimens. We analyzed endometrial serous carcinomas of different clinical stages (stage I, II/III, and IV), degree of myometrial invasion (pT1‐2/pT3), degree of lymph node metastasis, and degree of vascular invasion. While no statistically significant associations were observed between miRNA expression and clinical stage, myometrial invasion, or lymph node metastasis (data not shown), a statistically significant association with vascular invasion was noted (P < 0.05) (Table 3). Specifically, expression of miR‐10b*, miR‐29b, and miR‐455‐5p was lower in specimens with vascular invasion (P = 0.048, P = 0.013, and P = 0.032, respectively).
Table 3.
Clinicopathological features of differentially expressed miRNAs associated with endometrial serous adenocarcinoma
| No. of samples | Median expression | ||
|---|---|---|---|
| 16 | 5 | ||
| Feature | Vascular invasion absent | Vascular invasion present | P‐values |
| miR‐10b* | 12.5 | 6.2 | 0.048 |
| miR‐29b | 12.9 | 5 | 0.013 |
| miR‐455‐5p | 12.6 | 5.8 | 0.032 |
P‐values of <0.05 were considered significant.
Immunostaining for COX‐2 was detected in the cytoplasm of normal glandular cells and tumor cells (Fig. 3a,b). All tumor cases were positive for COX‐2: 10 out of 21 tumor cases (47.6%) were scored as weakly positive and the remainder (52.4%) as strongly positive. In contrast, all of normal cases were weakly positive. A more intense reactivity was noted in the infiltrating cells at the tumor periphery. Strong, positive COX‐2 immunoreactivity was significantly correlated with down‐regulation of miR‐101 (P = 0.035) (Fig. 3c).
Figure 3.

Immunohistochemistry for cyclooxygenase (COX)‐2 expression in endometrial tissues. (a) Immunoreactivity of COX‐2 was weakly detected in the cytoplasm of normal endometrium glandular cells. (b) Strong immunoreactivity was detected in the cytoplasm of carcinoma cells. Original magnification, ×200 for (a) and (b). (c) miR‐101 expression was significantly lower in tissues exhibiting COX‐2 strong immunoreactivity. *P < 0.05.
MicroRNA signatures are associated with the prognosis of patients with endometrial serous adenocarcinoma. We next investigated the correlation between miRNA expression level and survival. The association between median survival as calculated by Kaplan–Meier analysis and miRNA expression is shown in Fig. 4. Lower expression of miR‐101, miR‐10b*, miR‐139‐5p, miR‐152, miR‐29b, and miR‐455‐5p was significantly correlated with decreased overall survival (log‐rank test, P < 0.05), whereas lower expression of miR‐152, miR‐29b, and miR‐455‐5p was significantly correlated with decreased progression‐free survival. Multivariate analysis revealed that vascular invasion and miR‐152 expression were statistically independent risk factors for overall survival (P = 0.035 and P = 0.021, respectively). Moreover, vascular invasion, miR‐101 expression, and miR‐152 expression were statistically independent factors for progression‐free survival (P = 0.018, P = 0.016, and P = 0.010, respectively) (Table 4).
Figure 4.

Kaplan–Meier overall survival curve for patients with endometrial serous adenocarcinoma of based on miRNA expression. (a) Reduced expression of miRNA‐101, miR‐10b*, miR‐139‐5p, miR‐152, miR‐29b, and miR‐455‐5p was significantly correlated with shorter overall survival. (b) Decreased expression of miR‐152, miR‐29b, and miR‐455‐5p was significantly correlated with shorter disease‐free survival. The log‐rank test yielded significant P‐values (P < 0.05).
Table 4.
Multivariate analysis of predictors of overall survival and disease‐free survival for endometrial serous adenocarcinoma patients
| Variable | Overall survival | Disease‐free survival | ||
|---|---|---|---|---|
| HR (95% CI) | P | HR (95% CI) | P | |
| Stage (I/II vs III/IV) | 0.318 (0.034 to 2.97) | 0.315 | 0.170 (0.021 to 1.40) | 0.099 |
| Vascular invasion | 33.0 (1.28 to 852.9) | 0.035 | 53.2 (1.98 to 1425.4) | 0.018 |
| miR‐101 | 189.5 (0.981 to 36586.7) | 0.051 | 312.5 (2.969 to 32899.5) | 0.016 |
| miR‐10b* | 1.01 (0.037 to 27.4) | 0.998 | 25.3 (0.832 to 767.7) | 0.064 |
| miR‐139‐5p | 0.104 (0.005 to 2.10) | 0.14 | 0.142 (0.010 to 2.00) | 0.148 |
| miR‐152 | 0.005 (4.77E‐5 to 0.440) | 0.021 | 0.003 (4.37E‐5 to 0.250) | 0.01 |
| miR‐29b | 3.65 (0.249 to 53.4) | 0.345 | 5.83 (0.431 to 78.8) | 0.185 |
| miR‐455‐5p | 0.349 (0.001 to 202.2) | 0.746 | 0.033 (1.81E‐4 to 6.04) | 0.199 |
P‐values of <0.05 were considered significant. HR, hazard ratio; 95% CI, 95% confidence interval.
Restoration of miR‐101 and miR‐152 inhibits endometrial serous adenocarcinoma cell growth. SPAC‐1‐L cells were transfected with miR‐101 and miR‐152 precursor molecules, or a negative control to determine if either of the two miRNAs could suppress cancer cell growth. The proliferation assay revealed a significant reduction in cell growth following miR‐101 (P < 0.0001) and miR‐152 (P = 0.01) transfection (Fig. 5). The more striking decrease was observed after transfection of miR‐101 precursor molecules. The functional analysis was performed in duplicate and each experiment was repeated independently in triplicate.
Figure 5.

Cell proliferation assay in SPAC‐1‐L cells. SPAC‐1‐L cells were transfected with pre‐miR miR‐101, pre‐miR‐152 precursor molecules, or a negative control for 72 h. Nega, transfected with negative control; 152, transfected with pre‐miR‐152 molecules; 101, transfected with pre‐miR‐101 molecules. Data are presented as the mean ± SD of three independent experiments. *P < 0.05 and ***P < 0.001 vs controls.
Discussion
We identified 54 miRNAs that are significantly down‐regulated and 66 miRNAs that are significantly up‐regulated in endometrial serous carcinoma compared to normal endometrial tissue. These miRNAs may therefore serve as potential markers for distinguishing endometrial serous carcinoma from normal endometrial tissue. Despite the cancer specimens being obtained from different patients, miRNA expression patterns were nearly homogenous across all cases. The endometrial serous adenocarcinoma miRNA expression profiles observed in the present study were consistent with the results of previous endometrial endometrioid cancer studies published by Boren et al. ( 25 ) and Wu et al. ( 26 ) Specifically, the observed down‐regulation of miR‐152 and miR‐193 and the up‐regulation of miR‐106a, miR‐205, miR‐210, and miR‐429 are in agreement with previous results, despite the histological difference between tissues. This concordance further supports our findings and underscores the relevance of these miRNAs in endometrial cancer. To the best of our knowledge, this is the first study to examine miRNA expression profiles and their association with clinical outcomes and prognosis in patients with endometrial serous adenocarcinoma.
The 21 endometrial serous adenocarcinoma tissues used for the miRNA microarray analysis constitute a limited sample size. However, they were all that fulfilled our designed criteria as histologically pure and typical from 2001 to 2006 at Tohoku University Hospital. The most consistently down‐ and up‐regulated miRNAs in various cancers are miR‐133a and miR‐205, respectively. miR‐133b has been shown to be significantly down‐regulated in colorectal cancer,( 27 ) although it is significantly up‐regulated in gastric cancer.( 28 ) Tongue squamous cell carcinoma cell lines transfected with miR‐133a and miR‐133b precursors display a reduction in proliferation rate. Computational target gene prediction has suggested that both miR‐133a and miR‐133b are target transcripts of pyruvate kinase type M2 (PKM2), a potential oncogene in solid cancers.( 29 ) Wu et al. ( 26 ) reported that miR‐205 is greatly enriched in endometrial endometrioid adenocarcinoma. These investigators reported that high levels of miR‐205 expression are correlated with migration and invasion. Iorio et al. ( 30 ) demonstrated that DNA hypomethylation in ovarian tumors resulted in up‐regulation of miR‐205 compared to normal ovarian tissue. miR‐205 has also been shown to be up‐regulated in exosomes of ovarian serous carcinoma patients.( 31 ) These results indicate that levels of these exosomal miRNAs are stable and do not significantly change with storage. The use of exosomal miRNA profiling could extend this approach to screening of asymptomatic individuals, as well as to monitoring disease recurrence.
Eleven miRNAs (miR‐101, miR‐10b*, miR‐133a, miR‐133b, miR‐152, miR‐29b, miR‐34b, miR‐411, miR‐200a, miR‐200b, and miR‐205) were selected to validate the significance of their down‐ or up‐regulation by microarray analysis or because of their reported interesting functions. Dysregulated miRNA expression may occur via a number of mechanisms, such as gene copy gain or loss.( 32 ) germline mutation of precursor miRNA molecules,( 17 ) promoter methylation,( 33 ) aberrant miRNA processing due to altered expression of the miRNA biogenesis machinery,( 34 ) or transcription factors.( 35 ) In cancer specimens, the differential expression of nine out of 11 miRNAs compared to normal endometrial tissue expression reached statistical significance by qRT‐PCR analysis. Thus, overall, the microarray data appear to be sufficient to warrant further analyses in the clinical setting.
The differential expression of some miRNAs was determined to be correlated with various clinicopathologic features unique to serous endometrial carcinoma. Among these miRNAs, miR‐10b*, miR‐29b, and miR‐455‐5p appear to be potentially involved in cancer progression. These were down‐regulated in endometrial serous adenocarcinoma patients with high vascular invasion, suggesting that their down‐regulation occurs during the course of tumor progression and, in particular, during the acquisition of cancer metastatic potential.
Iorio et al. ( 18 ) found that miR‐29 was down‐regulated in aggressive breast cancer specimens, notably those that lacked estrogen and progesterone receptors (miR‐29b) and those with vascular invasion (miR‐29a). In contrast, other investigators have reported the up‐regulation of miR‐29b in breast cancer.( 36 ) miR‐29b has numerous predicted gene targets, including the majority of collagen mRNAs and insulin growth factor 1 (IGF1). In a cholangiocarcinoma cell line, miR‐29b has been shown to down‐regulate the expression of myeloid cell leukemia 1 (Mcl‐1) protein, an anti‐apoptotic member of the Bcl‐2 family, although it does not affect Mcl‐1 mRNA expression.( 37 ) miR‐29b acts directly at the Mcl‐1 3′UTR, sensitizing cells to apoptosis.( 37 ) Recently, Park et al. ( 38 ) reported that several miR‐29 family members participate upstream of the p53 pathway.
We observed a reduction of cell growth upon transfection of miR‐101 and miR‐152 precursor molecules into SPAC‐1‐L cells. miR‐152 has been shown to be involved in aberrant hypermethylation in breast cancer patients.( 39 ) One of its proposed target mRNAs is that of mutL homologue 1 (MLH1), a mismatch repair gene. Orbo et al. ( 40 ) demonstrated that MLH1 expression was significantly decreased in endometrial specimens from patients with a subsequent or coexisting endometrial carcinoma. Additional targets of miR‐152 include latent transforming growth factor‐β binding protein‐4 (LTBP‐4),( 41 ) as well as autotoxin (ENPP2),( 42 , 43 ) both of which have been implicated in cellular processes related to either oncogenesis, cell survival, migration, metastasis, and/or clinical outcome of human cancers.
miR‐101 down‐regulation is involved in COX‐2 overexpression in human colon cancer cells,( 44 ) and genomic loss of miR‐101 has been shown to lead to overexpression of the histone methyltransferase EZH2 in prostate cancer.( 45 ) Mcl‐1 has also been characterized as a direct target of miR‐101,( 46 ) and it is potentially involved in miR‐101–regulated apoptosis. Transfection of miR‐101 precursor molecules caused a much larger decrease in proliferation than the miR‐152 precursors. Therefore, miR‐101 may be involved in apoptotic mechanisms, including Mcl‐1. In our series, COX‐2 immunohistochemical overexpression was significantly correlated with down‐regulation of miR‐101. In endometrial carcinoma, several studies have shown that COX‐2 overexpression is associated with carcinogenesis and clinical outcomes.( 47 , 48 ) Recently, Chakrabarty et al. ( 49 ) reported that miR‐101a post‐transcriptionally suppresses COX‐2 expression in a human cancer cell line. In addition, hepatocyte growth factor (HGF) induces anoikis resistance in endometrial cancer cells, possibly through PI3K/Akt pathway‐dependent up‐regulation of COX‐2 expression.( 48 ) Although control of COX‐2 protein expression is complicated, our result might be used as further confirmation of COX‐2 as a candidate target of miR‐101 in patients with endometrial serous carcinoma. The data suggest that miR‐101 and miR‐152 affect cell proliferation and play important roles in controlling carcinogenesis in endometrial serous carcinoma.
Overall, our report contributes to the understanding of miRNA expression patterns and their relationship to tumorigenesis in endometrial serous carcinoma. The identification of miRNAs as oncogenic or pro‐metastatic factors holds the promise of revealing new diagnostic markers for human cancers and, quite possibly, novel targets for antitumor therapies. In conclusion, our data may serve as a foundation for the development of new pharmacologic and biologic therapy approaches for endometrial serous adenocarcinoma. A larger sample size is required to confirm the results of this study and to correlate them with clinical outcomes in patients with endometrial serous adenocarcinoma.
References
- 1. Hendrickson M, Ross J, Eifel P, Martinez A, Kempson R. Uterine papillary serous carcinoma: a highly malignant form of endometrial adenocarcinoma. Am J Surg Pathol 1982; 6: 93–108. [DOI] [PubMed] [Google Scholar]
- 2. Bancher TD, Neunteufel W, Williams KE et al. Influence of postoperative treatment on survival in patients with uterine papillary serous carcinoma. Gynecol Oncol 1998; 71: 344–7. [DOI] [PubMed] [Google Scholar]
- 3. Grice J, Ek M, Greer B et al. Uterine papillary serous carcinoma: evaluation of long‐term survival in surgically staged patients. Gynecol Oncol 1998; 69: 69–73. [DOI] [PubMed] [Google Scholar]
- 4. Lauchlan SC. Tubal (serous) carcinoma of the endometrium. Arch Pathol Lab Med 1981; 105: 615–8. [PubMed] [Google Scholar]
- 5. Creasman WT, Kohler MF, Odicino F, Maisonneuve P, Boyle P. Prognosis of papillary serous, clear cell, and grade 3 stage I carcinoma of the endometrium. Gynecol Oncol 2004; 95: 593–6. [DOI] [PubMed] [Google Scholar]
- 6. Hamilton CA, Cheung MK, Osann K et al. Uterine papillary serous and clear cell carcinomas predict for poorer survival compared to grade 3 endometrioid corpus cancers. Br J Cancer 2006; 94: 642–6. [DOI] [PMC free article] [PubMed] [Google Scholar]
- 7. Hannon GJ. RNA interference. Nature 2002; 418: 244–51. [DOI] [PubMed] [Google Scholar]
- 8. Bhattacharyya SN, Habermacher R, Martine U, Closs EI, Filipowicz W. Stress‐induced reversal of microRNA repression and mRNA P‐body localization in human cells. Cold Spring Harb Symp Quant Biol 2006; 71: 513–21. [DOI] [PubMed] [Google Scholar]
- 9. Ota A, Tagawa H, Karnan S et al. Identification and characterization of a novel gene, C13orf25, as a target for 13q31‐q32 amplification in malignant lymphoma. Cancer Res 2004; 64: 3087–95. [DOI] [PubMed] [Google Scholar]
- 10. Tagawa H, Seto M. A microRNA cluster as a target of genomic amplification in malignant lymphoma. Leukemia 2005; 19: 2013–6. [DOI] [PubMed] [Google Scholar]
- 11. He L, Thomson JM, Hemann MT et al. A microRNA polycistron as a potential human oncogene. Nature 2005; 435: 828–33. [DOI] [PMC free article] [PubMed] [Google Scholar]
- 12. Calin GA, Dumitru CD, Shimizu M et al. Frequent deletions and down‐regulation of micro‐RNA genes miR15 and miR16 at 13q14 in chronic lymphocytic leukemia. Proc Natl Acad Sci U S A 2002; 99: 15524–9. [DOI] [PMC free article] [PubMed] [Google Scholar]
- 13. Cimmino A, Calin GA, Fabbri M et al. miR‐15 and miR‐16 induce apoptosis by targeting BCL2. Proc Natl Acad Sci U S A 2005; 102: 13944–9. [DOI] [PMC free article] [PubMed] [Google Scholar]
- 14. Takamizawa J, Konishi H, Yanagisawa K. et al. Reduced expression of the let‐7 microRNAs in human lung cancers in association with shortened postoperative survival. Cancer Res 2004; 64: 3753–6. [DOI] [PubMed] [Google Scholar]
- 15. Johnson SM, Grosshans H, Shingara J et al. RAS is regulated by the let‐7 microRNA family. Cell 2005; 120: 635–47. [DOI] [PubMed] [Google Scholar]
- 16. Ma L, Weinberg RA. Micromanagers of malignancy: role of microRNAs in regulating metastasis. Trends Genet 2008; 24: 448–56. [DOI] [PubMed] [Google Scholar]
- 17. Calin GA, Ferracin M, Cimmino A et al. A microRNA signature associated with prognosis and progression in chronic lymphocytic leukemia. N Engl J Med 2005; 353: 1793–801. [DOI] [PubMed] [Google Scholar]
- 18. Iorio MV, Ferracin M, Liu CG et al. MicroRNA gene expression deregulation in human breast cancer. Cancer Res 2005; 65: 7065–70. [DOI] [PubMed] [Google Scholar]
- 19. Yanaihara N, Caplen N, Bowman E et al. Unique microRNA molecular profiles in lung cancer diagnosis and prognosis. Cancer Cell 2006; 9: 189–98. [DOI] [PubMed] [Google Scholar]
- 20. Hirai Y, Kawaguchi T, Hasumi K, Kitagawa T, Noda T. Establishment and characterization of human cell lines from a serous papillary adenocarcinoma of the endometrium. Gynecol Oncol 1994; 54: 184–95. [DOI] [PubMed] [Google Scholar]
- 21. Tavassoli FA, Devilee P. Pathology and genetics of tumours of the breast and female genital organs. In: Tavassoli FA, Devilee P, ed. WHO Classification of Tumours. Lyon: WHO, 2003; 113–45. [Google Scholar]
- 22. Creasman WT. Announcement FIGO stages: 1988 revisions. Gynecol Oncol 1989; 35: 125–7. [Google Scholar]
- 23. Charalambous MP, Lightfoot T, Speirs V, Horgan K, Gooderham NJ. Expression of COX‐2, NF‐κB‐p65, NF‐κB‐p50 and IKKα in malignant and adjacent normal human colorectal tissue. Br J Cancer 2009; 101: 106–15. [DOI] [PMC free article] [PubMed] [Google Scholar]
- 24. Livak KJ, Schmittgen TD. Analysis of relative gene expression data using real‐time quantitative PCR and the 2 (‐Delta Delta C (T)) Method. Methods 2001; 25: 402–8. [DOI] [PubMed] [Google Scholar]
- 25. Boren T, Xiong Y, Hakam A et al. MicroRNAs and their target messenger RNAs associated with endometrial carcinogenesis. Gynecol Oncol 2008; 110: 206–15. [DOI] [PubMed] [Google Scholar]
- 26. Wu W, Lin Z, Zhuang Z, Liang X. Expression profile of mammalian microRNAs in endometrioid adenocarcinoma. Eur J Cancer Prev 2009; 18: 50–5. [DOI] [PubMed] [Google Scholar]
- 27. Bandres E, Cubedo E, Agirre X et al. Identification by real‐time PCR of 13 mature microRNAs differentially expressed in colorectal cancer and non‐tumoral tissues. Mol Cancer 2006; 19: 5–29. [DOI] [PMC free article] [PubMed] [Google Scholar]
- 28. Guo J, Miao Y, Xiao B et al. Differential expression of microRNA species in human gastric cancer versus non‐tumorous tissues. J Gastroenterol Hepatol 2009; 24: 652–7. [DOI] [PubMed] [Google Scholar]
- 29. Wong TS, Liu XB, Chung‐Wai HA et al. Identification of pyruvate kinase type M2 as potential oncoprotein in squamous cell carcinoma of tongue through microRNA profiling. Int J Cancer 2008; 123: 251–7. [DOI] [PubMed] [Google Scholar]
- 30. Iorio MV, Visone R, Di L et al. MicroRNA signatures in human ovarian cancer. Cancer Res 2007; 67: 8699–707. [DOI] [PubMed] [Google Scholar]
- 31. Taylor DD, Gercel‐Taylor C. MicroRNA signatures of tumor‐derived exosomes as diagnostic biomarkers of ovarian cancer. Gynecol Oncol 2008; 110: 13–21. [DOI] [PubMed] [Google Scholar]
- 32. Zhang L, Huang J, Yang N et al. MicroRNAs exhibit high frequency genomic alterations in human cancer. Proc Natl Acad Sci U S A 2006; 103: 9136–41. [DOI] [PMC free article] [PubMed] [Google Scholar]
- 33. Saito Y, Liang G, Egger G et al. Specific activation of microRNA‐127 with downregulation of the protooncogene BCL6 by chromatin‐modifying drugs in human cancer cells. Cancer Cell 2006; 9: 435–43. [DOI] [PubMed] [Google Scholar]
- 34. Thomson JM, Newman M, Parker JS et al. Extensive post‐transcriptional regulation of microRNAs and its implications for cancer. Genes Dev 2006; 20: 2202–7. [DOI] [PMC free article] [PubMed] [Google Scholar]
- 35. Corney DC, Flesken‐Nikitin A, Godwin AK, Wang W, Nikitin AY. MicroRNA‐34b and microRNA‐34c are targets of p53 and cooperate in control of cell proliferation and adhesion‐independent growth. Cancer Res 2007; 67: 8433–8. [DOI] [PubMed] [Google Scholar]
- 36. Yan LX, Huang XF, Shao Q et al. MicroRNA miR‐21 overexpression in human breast cancer is associated with advanced clinical stage, lymph node metastasis and patient poor prognosis. RNA 2008; 14: 2348–60. [DOI] [PMC free article] [PubMed] [Google Scholar]
- 37. Mott JL, Kobayashi S, Bronk SF, Gores GJ. Mir‐29 regulates Mcl‐1 protein expression and apoptosis. Oncogene 2007; 26: 6133–40. [DOI] [PMC free article] [PubMed] [Google Scholar]
- 38. Park SY, Lee JH, Ha M, Nam JW, Kim VN. MiR‐29 miRNAs activate p53 by targeting p85α and CDC42. Nat Struct Mol Biol 2009; 16: 23–9. [DOI] [PubMed] [Google Scholar]
- 39. Lehmann U, Hasemeier B, Christgen M et al. Epigenetic inactivation of microRNA gene has‐mir‐9‐1 in human breast cancer. J Pathol 2008; 214: 17–24. [DOI] [PubMed] [Google Scholar]
- 40. Orbo A, Nilsen M, Arnes M, Petterson I, Larsen K. Loss of expression of MLH1, MLH2, MSH6, and PTEN related to endometrial cancer in 68 patients with endometrial hyperplasia. Int J Gynecol Pathol 2003; 22: 141–8. [DOI] [PubMed] [Google Scholar]
- 41. Mauel S, Kruse B, Etschmann B et al. Latent transforming growth factor binding protein 4 (LTBP‐4) is downregulated in human mammary adenocarcinomas in vitro and in vivo. APMIS 2007; 115: 687–700. [DOI] [PubMed] [Google Scholar]
- 42. Hama K, Aoki J, Fukaya M et al. Lysophosphatidic acid and autotaxin stimulate cell motility of neoplastic and non‐neoplastic cells through LPA1. J Bio Chem 2004; 279: 17634–9. [DOI] [PubMed] [Google Scholar]
- 43. Zhang G, Zhao Z, Xu S, Ni L, Wang X. Expression of autotaxin mRNA in human hepatocellular carcinoma. Chin Med J 1999; 112: 330–2. [PubMed] [Google Scholar]
- 44. Strillacci A, Griffoni C, Sansone P et al. Mir‐101 downregulation is involved in cyclooxygenase‐2 overexpression in human colon cancer cells. Exp Cell Res 2009; 315: 1439–47. [DOI] [PubMed] [Google Scholar]
- 45. Varambally S, Cao Q, Mani RS et al. Genomic loss of microRNA‐101 leads to overexpression of histone methyltrasferase EZH2 in cancer. Science 2008; 322: 1695–9. [DOI] [PMC free article] [PubMed] [Google Scholar]
- 46. Su H, Yang JR, Xu T et al. MicroRNA‐101, down‐regulated in hepatocellular carcinoma, promotes apoptosis and suppresses tumorigenicity. Cancer Res 2009; 69: 1135–42. [DOI] [PubMed] [Google Scholar]
- 47. Ferrandina G, Legge F, Ranelletti FO et al. Cyclooxygenase‐2 expression in rndometrial carcinoma correlation with clinicopathologic parameters and clinical outcome. Cancer 2002; 95: 801–7. [DOI] [PubMed] [Google Scholar]
- 48. Kanayama S, Yamada Y, Kawaguchi R, Tsuji Y, Haruta S, Kobayashi H. Hepatocyte growth factor induces anoikis resistance by up‐regulation of cyclooxygenase‐2 expression in uterine endometrial cancer cells. Oncol Rep 2008; 19: 117–22. [PubMed] [Google Scholar]
- 49. Chakrabarty A, Tranguch S, Daikoku T, Jensen K, Furneaux H, Dey SK. MicroRNA regulation of cyclooxygenase‐2 during embryo implantation. Proc Natl Acad Sci U S A 2007; 104: 15144–9. [DOI] [PMC free article] [PubMed] [Google Scholar]