

Abstract
Hypoxia‐inducible factor 1 (HIF‐1) plays essential roles in tumor angiogenesis and growth by regulating the transcription of several key genes in response to hypoxic stress and growth factors. HIF‐1 is a heterodimeric transcriptional activator consisting of inducible α and constitutive β subunits. In oxygenated cells, proteins containing the prolyl hydroxylase domain (PHD) directly sense intracellular oxygen concentrations. PHDs tag HIF‐1α subunits for polyubiquitination and proteasomal degradation by prolyl hydroxylation using 2‐oxoglutarate (2‐OX) and dioxygen. Our recent studies showed that 2‐OX reduces HIF‐1α, erythropoietin, and vascular endothelial growth factor (VEGF) expression in the hepatoma cell line Hep3B when under hypoxic conditions in vitro. Here, we report that similar results were obtained in Lewis lung cancer (LLC) cells in in vitro studies. Furthermore, 2‐OX showed potent antitumor effects in a mouse dorsal air sac assay and a murine tumor xenograft model. In the dorsal air sac assay, 2‐OX reduced the numbers of newly formed vessels induced by LLC cells. In a murine tumor xenograft model, intraperitoneal injection of 2‐OX significantly inhibited tumor growth and angiogenesis in tumor tissues. Moreover, 5‐fluorouracil combined with 2‐OX significantly inhibited tumor growth in this model, which was accompanied by reduction of Vegf gene expression and inhibited angiogenesis in tumor tissues. These results suggest that 2‐OX is a promising anti‐angiogenic therapeutic agent. (Cancer Sci 2009; 100: 1639–1647)
The growth of solid tumors is frequently accompanied by neovascularization. This requirement for angiogenesis implied that targeting tumor vascular endothelial cells might represent a novel therapeutic strategy.( 1 ) Proof of principle was established through clinical applications demonstrating efficacy of the anti‐vascular endothelial growth factor (VEGF) antibody, bevacizumab.( 2 )
VEGF is a potent angiogenic factor and endothelial cell‐specific mitogen( 3 , 4 , 5 ) that is regulated by hypoxia in vitro ( 6 ) and in vivo. ( 7 , 8 , 9 , 10 ) This hypoxic induction of VEGF is due to an increase in the steady state level of Vegf mRNA.( 11 ) Similar to the erythropoietin (Epo) gene,( 6 ) the Vegf gene is induced by metal ions and hypoxia.( 10 ) The implication of these studies is that there may be fundamental similarities in the oxygen‐sensing pathway leading to the activation of these two genes. Hypoxic induction of the Epo gene appears to be regulated by both transcriptional and post‐transcriptional mechanisms.( 12 , 13 , 14 ) Hypoxia‐inducible factor 1 (HIF‐1) was identified as a protein that specifically binds to an enhancer element 3′ to the Epo gene in a hypoxia‐regulated fashion.( 15 , 16 )
HIF‐1 is a key regulator of responses to hypoxia, occupying a central position in oxygen homeostasis in a wide range of organisms.( 17 ) Among its transcriptional targets are genes with critical roles in angiogenesis, erythropoiesis, energy metabolism, vasomotor function, and apoptotic/proliferative responses. HIF‐1 is also essential for normal development( 18 ) and plays key roles in pathophysiological responses to ischemia/hypoxia as well as in tumor growth and angiogenesis.( 17 )
HIF‐1 is a heterodimeric transcription factor composed of a HIF‐1α subunit and a HIF‐1β subunit.( 19 ) HIF‐1α is continuously synthesized and degraded under normoxic conditions. Under hypoxic conditions, HIF‐1α degradation is inhibited, allowing the protein to accumulate and dimerize with HIF‐1β. This heterodimer binds to cis‐acting hypoxia‐response elements in target genes and recruits coactivator proteins, all of which leads to increased transcription. In oxygenated cells, intracellular oxygen concentrations are directly sensed by HIF‐1α hydroxylation enzymes, prolyl hydroxylases (PHDs). PHDs tag HIF‐1α subunits for polyubiquitination and proteasomal degradation by prolyl hydroxylation using 2‐oxoglutarate (2‐OX) and dioxygen.( 20 , 21 ) Our recent studies have shown that 2‐OX reduces HIF‐1α, erythropoietin, and VEGF expression under hypoxic conditions in the hepatoma cell line Hep3B.( 22 ) To address the clinical usefulness of 2‐OX, we investigated its antitumor effect using a mouse dorsal air sac (DAS) assay and a murine tumor xenograft model. We found that 2‐OX exerts potent antitumor effects by inhibiting angiogenesis, and we discuss the possibility of 2‐OX as a novel anti‐angiogenesis drug.
Material and Methods
Cell culture. The Lewis lung carcinoma (LLC) and B16F10 melanoma cell lines were obtained from the American Type Tissue Culture Collection (Rockville, MD, USA). Cells were incubated under both 21% (normoxia) and 1% (hypoxia) oxygen. The exposure times were as described below.
2‐Oxoglutarate. 2‐Oxoglutarate (2‐OX) was obtained from Fluka Analysis (Buchs, Switzerland). For in vitro studies, 2‐OX was dissolved in growth medium. For in vivo studies, it was suspended in phosphate‐buffered saline (PBS), and the suspension was administered to animals within a day of preparation.
Cell proliferation assay. Cell survival was determined by a non‐radioactive cell proliferation assay (Promega, Madison, WI, USA). LLC cells (1.5 × 10⁴ cells) in a 96‐well plate (Nunc, Roskilde, Denmark) were incubated for 24 h. Then the medium was changed to new medium containing various concentrations of 2‐OX and incubated under normoxic (21% O2) or hypoxic (1% O2) conditions for 20 h. After incubation, the tetrazolium component of the dye solution was added. After incubation for 4 h, the Solubilization/Stop Solution was added to the cultures to solubilize the formazan product, and the absorbance reading at 570 nm was recorded by a 96‐well plate reader (Bio‐Rad, Hercules, CA, USA).
Semi‐quantitative RT‐PCR. We used the following primers for RT‐PCR: HIF‐1α‐sense, 5′‐GAGTTCTGAACGTCGAAAAG‐3′; HIF‐1α‐antisense, 5′‐CTCACACGTAAATAACTGATGG‐3′; HIF‐2α‐sense, 5′‐GGACGCTCTGCCTATGAGTT‐3′; HIF‐2α‐antisense, 5′‐GGCTCCTCCTTCAGTTTGG‐3′; β‐actin‐sense, 5′‐GTGCTATGTTGCCCTGGATT‐3′; and β‐actin antisense, 5′‐TGCTAGGGCTGTGATCTCCT‐3′. We extracted RNA using the RNeasy kit (Qiagen GmbH, Hilden, Germany). Total RNA (1 µg) was primed with 0.5 µg of oligo dT and reverse transcribed by Omniscript reverse transcriptase using a primeScript RT‐PCR kit (Takara, Shiga, Japan). PCR proceeded using the cDNA as a template and TakaRa EX Taq HS (Takara). The number of PCR cycles determined from the plot was 30 for both HIF‐1α and HIF‐2α and 25 for β‐actin.
Western blot analysis. Nuclear extracts (15 µg) prepared from LLC cells were electrophoresed on a 7.5% sodium dodecyl sulfate (SDS)‐polyacrylamide gel and transferred onto a polyvinylidene difluoride membrane (Millipore, Billerica, MA, USA). Blocking was performed at room temperature for 1 h in PBS containing 5% non‐fat milk. The membranes were incubated with anti‐HIF‐1α antibody (Lab vision, Fremont, CA, USA) in PBS containing 5% non‐fat milk. After washing with PBS containing 0.1% Tween 20, the membrane was incubated with horseradish peroxidase–conjugated goat antimouse IgG (Zymed, San Francisco, CA, USA) in PBS containing 5% non‐fat milk. Subsequently, proteins were detected by enhanced chemiluminescence (Millipore). Goat anti‐lamin B antibody (Santa Cruz Biotechnology, Santa Cruz, CA, USA) was used to monitor protein loading and transfer efficiency.
Quantitative RT‐PCR. We extracted RNA using the RNeasy kit (Qiagen). Total RNA (1 µg) was primed with 0.5 µg of oligo dT and reverse transcribed by Omniscript reverse transcriptase using a PrimeScript RT‐PCR kit (Takara). The reaction was performed at 42°C for 30 min. The mRNA expression levels were analyzed by quantitative PCR with a TaqMan probe using an applied Biosystems 7500 Real‐time PCR system (Perkin‐Elmer Applied Biosystems, Foster, CA, USA) as previously described. The expression of Actin mRNA was used as an internal control. The PCR mixture (25 µL total volume) consisted of 5‐carboxyfluorescein‐labeled primer probes (Roche Diagnostics, Mannheim, Germany) and FastStart Universal Probe Master (ROX) (Roche Diagnostics). Each PCR amplification was performed in triplicate, using the following profile: one cycle of 95°C for 10 min, 40 cycles of 94°C for 15 s, and 60°C for 1 min. The quantitative values of target mRNA were normalized to that of Actin mRNA expression.
Enzyme‐linked immunosorbent assay (ELISA). To determine the levels of VEGF protein from LLC cells, commercial enzyme‐linked immunosorbent assays (ELISA, mouse VEGF; R&D systems, Minneapolis, MN, USA) were performed using the cell culture supernatant. ELISA was performed following the recommendations of the manufacturer. The detection limits were 3 pg/mL for VEGF.
Mice. Seven‐week‐old‐male C57BL/6J mice were purchased from Clea‐Japan (Tokyo, Japan). They were housed in autocleaning metal cages in an air‐conditioned room and were offered a standard diet (CM; Oriental Yeast, Tokyo, Japan) and tap water ad libitum. This study was approved in accordance with the Regulations for Animal Experimentation at the University of Tsukuba and the Law on Human Treatment and Management of Animals (Law no. 105 of Japan).
Mouse DAS assay. Tumor‐induced blood vessel formation was assessed as described previously.( 23 ) In brief, Millipore chambers (Millipore) were filled with either PBS alone or a suspension of 1.5 × 10⁷ LLC cells in PBS with or without 2‐OX and sealed with membrane filters (0.45‐µm pores). Chambers were implanted subcutaneously in dorsal air sacs created surgically by injection of an appropriate volume of air in 7‐week‐old male C57BL/6J mice. Four days later, mice were given an overdose of diethyl ether. The skin was carefully removed and angiogenesis that had been induced around the chamber was examined under a stereomicroscope and photographed. Quantitative analyses were performed with angiogenesis‐measuring software (version 2.0; Kurabo, Osaka, Japan). Each experimental group included four mice, and each experiment was repeated at least twice. No obvious adverse effects appeared after treatment of animals with 2‐OX. All surgical procedures were performed under pentobarbital anesthesia (Dainabot, Osaka, Japan).
Effect of 2‐OX on growth of LLC cells in vivo. Cells in PBS were implanted into the right flank region of 7‐week‐old C57BL/6J mice. Daily intraperitoneal injections of 2‐OX were started the day after implantation. From 6 to 12 days after implantation, we measured tumors with calipers and calculated volumes as (length × width2) × 0.5. LLC tumors were removed from mice 12 days after implantation for quantitative RT‐PCR and immunohistochemical studies.
Effect of 2‐OX and/or 5‐fluorouracil (5‐FU) on growth of LLC cells in vivo. Cells in PBS were implanted into the right flank region of 7‐week‐old C57BL/6J mice. Mice were randomly assigned to four groups: (1) PBS alone, (2) 2‐OX alone, (3) 5‐FU alone, and (4) 5‐FU + 2‐OX. For all groups, 5‐FU or PBS were injected intraperitoneally on day 7 and 2‐OX or PBS were injected intraperitoneally daily from days 7–15. From 6 to 15 days after implantation, we measured tumors with calipers and calculated volumes as (length × width2) × 0.5. LLC tumors were removed from mice 15 days after implantation for quantitative RT‐PCR.
Analyses of blood cell counts. Peripheral blood samples were obtained from the orbital veins of anesthetized mice and collected into tubes containing ethylene diamine tetraacetic acid (EDTA). Automated blood cell counts were performed using Celltac (Nihon Kohden, Tokyo, Japan).
Immunohistochemistry and vessel density determination. Tumors were fixed overnight in 4% paraformaldehyde in PBS. Half of the tumor was frozen, and cryosectioning was carried out at a thickness of 5 µm for immunohistochemical staining. Briefly, all tissue sections were permeabilized with 0.1% Triton X‐100 (Sigma, St Louis, MO, USA), blocked with goat normal serum for 30 min for non‐specific binding, and then incubated with a rat monoclonal antibody against mouse CD31 (Pharmingen BD, Stockholm, Sweden) overnight at 4°C. Primary antibodies were detected with secondary chicken antirat IgG conjugated to Alexa 488 (Molecular Probes, Eugene, OR, USA) for immunofluorescence detection and nuclei were counterstained with Hoechst 33342 (Invitrogen, Carlsbad, CA, USA). Quantitative analyses were performed with angiogenesis‐measuring software (Kurabo).
Histologic analysis of smooth muscle actin–positive pericyte coverage of tumor vessels. Cells in PBS were implanted into the right flank region of 7‐week‐old C57BL/6J mice. Mice were randomly assigned to four groups: (1) PBS alone, (2) 2‐OX alone, (3) 5‐FU alone, and (4) 5‐FU + 2‐OX. For all groups, 5‐FU or PBS were injected intraperitoneally on day 7 and 2‐OX or PBS were injected intraperitoneally daily from days 7–15. Immunofluorescent staining of pericytes in tumors was done with Cy3‐conjugated monoclonal anti‐smooth muscle actin antibody (Sigma) following the staining of endothelial cells with anti‐CD31 antibody. Tissue images were captured digitally at ×100 magnification with a Leica DM RXA microscope (Leica Microsystems, Wetzlar, Germany). Four fields per section were randomly analyzed, excluding peripheral surrounding connective tissues and central necrotic tissues. The number of CD31‐positive objects and the number of those objects surrounded by regions positive for smooth muscle actin were quantified using Win ROOF software (Mitani, Fukui, Japan) after blind‐coding the histology slides to avoid operator bias.
Statistical analysis. Student's t‐tests were used to assess the level of significance between the treatment groups.
Results
2‐OX reduces HIF‐1α protein level in cultured LLC cells. Our previous studies showed that 2‐OX reduces HIF‐1α, Epo, and VEGF expression in a hepatoma cell line Hep3B when grown under hypoxic conditions. This implies that 2‐OX may be able to reduce tumor growth by inhibition of HIF‐1 activity in the tumor because VEGF induction by hypoxia is responsible for tumor growth and angiogenesis. In order to evaluate the effect of 2‐OX on LLC tumor growth in an animal model, we first investigated the cytotoxic effect of 2‐OX on LLC tumor cells. Cell cytotoxicity was determined by a cell proliferation assay following the addition of 2‐OX to LLC cells. There was no cell cytotoxicity up to 15 mM 2‐OX (Fig. 1a). LLC cells express HIF‐1α mRNA, but not HIF‐2α mRNA (Fig. 1b). To elucidate the effect of 2‐OX on the production of HIF‐1α protein in LLC cells, western blot analysis was performed. Compared with normoxia, hypoxia markedly induced the expression level of HIF‐1α protein (Fig. 1c, upper panel, lane 2). However, the addition of 7.5 and 15 mM 2‐OX dose‐dependently reduced HIF‐1α protein production (Fig. 1c, upper panel), although the addition of 2‐OX did not affect lamin B, which was used as a control (Fig. 1c, lower panel). These results suggest that 2‐OX reduces the HIF‐1α protein level.
Figure 1.
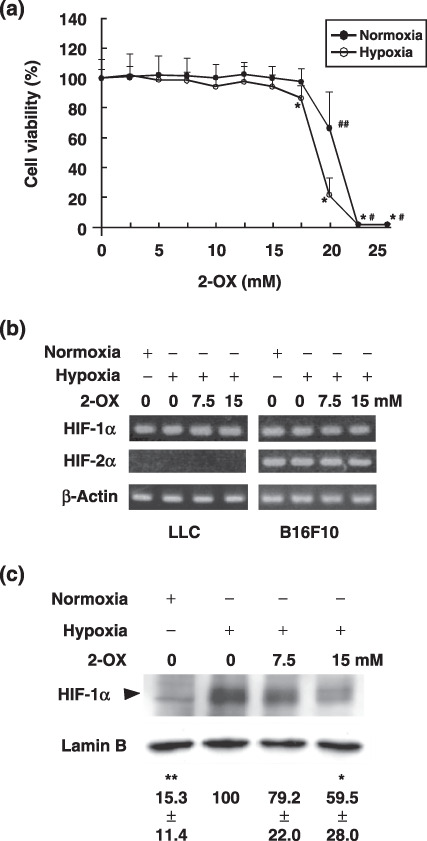
Effect of 2‐oxoglutarate (2‐OX) on hypoxia‐inducible factor (HIF)‐1α and HIF‐2α mRNA and protein expression in cultured Lewis lung carcinoma (LLC). (a) Effect of 2‐OX on LLC cell proliferation. LLC cells were incubated with the indicated concentrations of 2‐OX under normoxic or hypoxic conditions. Cell viability was measured by a non‐radioactive cell proliferation assay. The number of living cells incubated without 2‐OX was expressed as 100%. Error bars represent 1 SD (n = 9). Normoxia, 21% O2; hypoxia, 1% O2. # indicates significance compared with normoxic control, P < 0.001. ## indicates significance compared with normoxic control, P < 0.01. * indicates significance compared with hypoxic control, P < 0.001. (b) Effect of 2‐OX on HIF‐1α and HIF‐2α mRNA expression. LLC and B16F10 cells were incubated with and without 2‐OX under normoxic or hypoxic conditions. HIF‐1α and HIF‐2α mRNAs were detected by semi‐quantitative RT‐PCR. Normoxia, 21% O2; hypoxia, 1% O2. (c) Effect of 2‐OX on enhanced expression of HIF‐1α protein production in cultured LLC. LLC cells were treated with the indicated concentrations of 2‐OX under normoxic or hypoxic conditions for 1.5 h. The cells were then lysed, and protein was detected with anti‐HIF‐1α and lamin B antibodies by western blotting. The autoradiograph is representative of four different experiments using different cell extracts. Numbers below the bands are means ± 1 SD as determined by densitometric analysis of the ratio of the bands (HIF‐1α/lamin B) expressed relative to lane 2. Triangle indicates HIF‐1α. Normoxia, 21% O2; hypoxia, 1% O2. * indicates significance compared with control, P < 0.05. ** indicates significance compared with control, P < 0.001.
2‐OX reduces Vegf mRNA and protein levels in cultured LLC cells. Vegf mRNA expression induced by 1.5‐h hypoxic treatment in LLC cells was 1.65 ± 0.12‐fold times that of the normoxic control (Fig. 2a). To elucidate the dose‐dependent effects of 2‐OX on Vegf mRNA expression in LLC cells, different concentrations of 2‐OX were added to the cultures. Addition of 7.5 and 15 mM 2‐OX decreased Vegf mRNA expression to 1.47 ± 0.12 and 1.29 ± 0.14 times that of the normoxic control, respectively (Fig. 2a). Vegf mRNA expression in LLC cells induced by 3‐h hypoxia treatment was 3.70 ± 0.55‐fold times that of the normoxic control (Fig. 2a). Addition of 7.5 and 15 mM 2‐OX reduced the Vegf mRNA level to 3.32 ± 0.26 and 1.97 ± 0.27 times that of the normoxic control, respectively (Fig. 2a). These results indicate that 2‐OX inhibits Vegf mRNA expression in LLC cells in a dose‐dependent manner.
Figure 2.
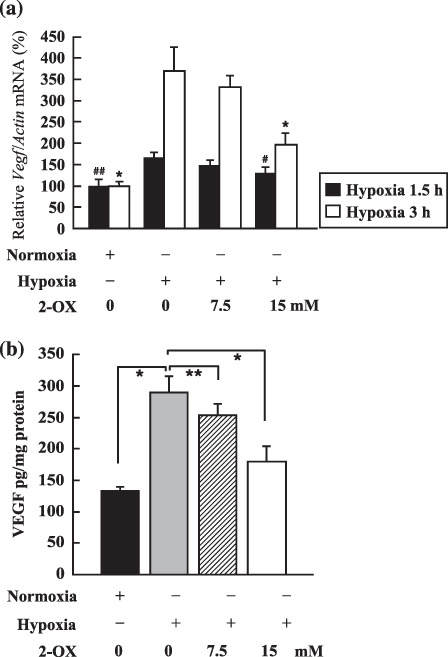
Effect of 2‐oxoglutarate (2‐OX) on vascular endothelial growth factor (Vegf) mRNA and protein expression in cultured Lewis lung carcinoma (LLC). (a) Effect of 2‐OX on Vegf mRNA expression. LLC cells were incubated with and without 2‐OX under normoxic or hypoxic conditions. Vegf mRNA expression was measured by quantitative RT‐PCR. Three separate experiments (hypoxia exposure time, 1.5 h) and six separate experiments (hypoxia exposure time, 3 h) were performed. Error bars represent 1 SD. Normoxia, 21% O2; hypoxia, 1% O2. # indicates significance compared with hypoxic control (hypoxia exposure time, 1.5 h), P < 0.05. ## indicates significance compared with hypoxic control (hypoxia exposure time, 3 h), P < 0.001. * indicates significance compared with hypoxic control (hypoxia exposure time, 3 h), P < 0.001. (b) Effect of 2‐OX on VEGF protein production from LLC cells. LLC cells were incubated with and without 2‐OX under normoxic or hypoxic conditions. VEGF protein was measured by ELISA. Five separate experiments were performed. Error bars represent 1 SD. Normoxia, 21% O2; hypoxia, 1% O2. * indicates significance compared with hypoxic control, P < 0.001. ** indicates significance compared with hypoxic control, P < 0.05.
To evaluate the VEGF protein levels after 2‐OX treatment, an ELISA assay was performed. Hypoxia‐induced VEGF protein production from LLC cells was 289.3 ± 25.6 pg/mg protein (Fig. 2b). To elucidate the dose‐dependent effects of 2‐OX on the production of VEGF by LLC cells, different concentrations of 2‐OX were added to the cultures. Addition of 7.5 or 15 mM 2‐OX inhibited VEGF protein production to 253.5 ± 17.8 and 178.6 ± 23.7 pg/mg protein, respectively (Fig. 2b). These results indicate that 2‐OX inhibits VEGF protein production by LLC cells in a dose‐dependent manner. Thus, consistent with the reduction of VEGF mRNA, VEGF protein is reduced by 2‐OX treatment in a dose‐dependent manner in LLC cells.
2‐OX inhibits blood vessel formation in vivo. To assess the effect of 2‐OX on tumor angiogenesis in vivo, we performed DAS assays using LLC cells. When mice were implanted with a chamber that carried LLC cells, blood vessels characterized by strikingly disorganized and tortuous vessels were induced towards the chamber from pre‐existing blood vessels beneath the epidermis (Fig. 3a). Such tumor‐induced blood vessel formation was, however, reduced by the administration of 2‐OX (Fig. 3a). Quantitative analysis of the values of blood vessel area by LLC cells using angiogenesis‐measuring software were as follows: LLC only, 100 ± 20.8%; LLC + 7.5 mM 2‐OX, 64.0 ± 9.4%; and LLC + 15 mM 2‐OX, 45.6 ± 4.4% (Fig. 3a). In contrast, 2‐OX had little influence on the pre‐existing blood vessels under the chamber (Fig. 3b). In this model, 2‐OX showed significant dose‐dependent anti‐angiogenic effects, reducing the number of newly formed vessels induced by LLC cells. This result indicates that 2‐OX clearly inhibited the angiogenesis induced by LLC cells in a dose‐dependent manner.
Figure 3.
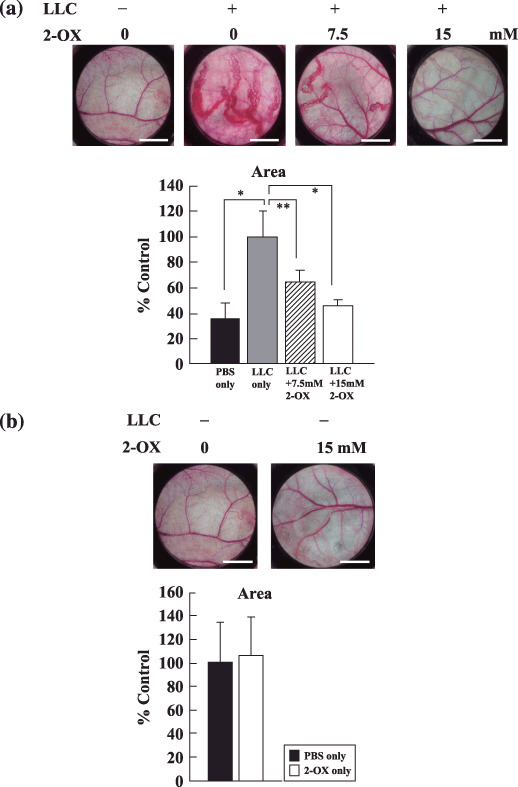
Effect of 2‐oxoglutarate (2‐OX) on in vivo blood vessel formation by dorsal air sac (DAS) assay. Chambers filled with either PBS alone or PBS plus Lewis lung carcinoma (LLC) cells with or without 2‐OX were implanted into 7‐week‐old mice. The dorsal skin was peeled off, and blood vessel formation was examined under a microscope and photographed. Scale bar, 3 mm. Area of tumor‐induced blood vessels were analyzed with angiogenesis‐measuring software. A representative result from three independent experiments with similar results is shown. Four separate experiments were performed. Error bars represent 1 SD. * indicates significance compared with LLC only, P < 0.01. ** indicates significance compared with LLC only, P < 0.05.
2‐OX inhibits tumor growth and angiogenesis in vivo. To assess the effect of 2‐OX on tumor growth, we injected 2‐OX into mice with solid tumors. Tumor volumes and weights 12 days after implantation were as follows: PBS alone, 330.8 ± 108.1 mm3 and 192.6 ± 66.4 mg; 50 mg/kg 2‐OX, 128.8 ± 16.4 mm3 and 111.0 ± 64.5 mg; and 100 mg/kg 2‐OX, 78.7 ± 43.7 mm3 and 88.8 ± 57.5 mg (Fig. 4a–c). These data indicate that 2‐OX reduces tumor size. We observed significant differences in microvessel density (PBS alone, 100 ± 16.5%; and 100 mg/kg 2‐OX, 46.0 ± 13.5%) by immunostaining for the endothelial cell marker CD31 (Fig. 5a,b). 2‐OX treatment (100 mg/kg) decreased the expression level of the Vegf gene in tumor tissues compared with the control (PBS alone, 100 ± 44.6%; and 100 mg/kg 2‐OX, 70.6 ± 31.9%) as determined by quantitative RT‐PCR (Fig. 5c). In this xenograft model, intraperitoneal injection of 2‐OX significantly inhibited tumor growth and angiogenesis in tumor tissues. We observed that topical 2‐OX treatment reduced tumor growth in C57BL/6J mice bearing LLC tumors (data not shown).
Figure 4.
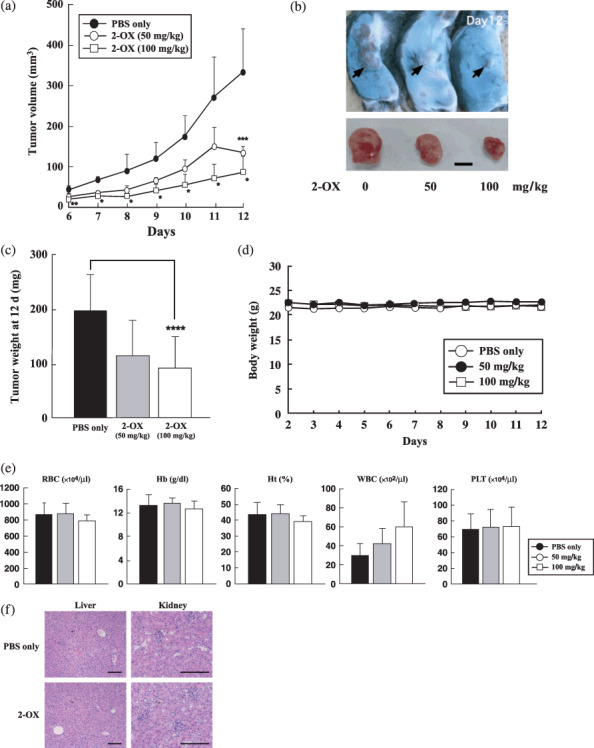
Effect of 2‐oxoglutarate (2‐OX) on growth of Lewis lung carcinoma (LLC) cells in vivo. Cells in PBS were implanted into the right flank region of 7‐week‐old C57BL/6J mice. Daily intraperitoneal injections of 2‐OX were started the day after implantation. From 6 to 12 days after implantation, we measured tumors with calipers and calculated volumes as (length × width2) × 0.5. (a) Tumor volume. (b) Gross appearance of xenografts and excised tumors at day 12. Scale bar, 5 mm. (c) Tumor weight at day 12. A representative result from three independent experiments with similar results is shown. Five separate experiments were performed. Error bars represent 1 SD. * indicates significance compared with control, P < 0.001. ** indicates significance compared with control, P < 0.01. *** indicates significance compared with control, P < 0.025. **** indicates significance compared with control, P < 0.05. (d) Time‐course of body weight change. Error bars represent 1 SD. (e) Blood cell counts. Error bars represent 1 SD. Hb, hemoglobin; Ht, hematocrit; PLT, platelet; RBC, red blood cell; WBC, white blood cell. (f) H&E staining of PBS or 2‐OX treated liver and kidney at day 12. Scale bar, 150 µm.
Figure 5.
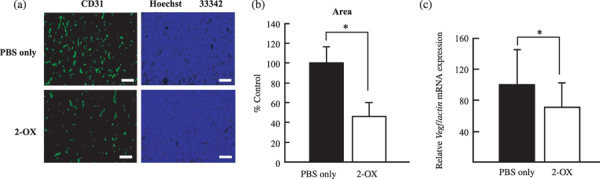
Effect of 2‐oxoglutarate (2‐OX) on microvessel density in Lewis lung carcinoma (LLC) tumors. Cells in PBS were implanted into the right flank region of 7‐week‐old C57BL/6J mice. Daily intraperitoneal injections of 2‐OX were started the day after implantation. LLC tumors were removed from mice 12 days after the implantation for immunohistochemical studies. (a) Immunohistochemical studies for CD31 and blood vessel formation was examined under a microscope and photographed. Scale bar, 150 µm. (b) Area of microvessel density was analyzed with angiogenesis‐measuring software. A representative result from three independent experiments with similar results is shown. Four separate experiments were performed. Error bars represent 1 SD. * indicates significance compared with control, P < 0.005. (c) Effect of 2‐OX on vascular endothelial growth factor (Vegf) mRNA expression in LLC tumor. Cells in PBS were implanted into the right flank region of 7‐week‐old C57BL/6J mice. Daily intraperitoneal injections of 2‐OX were started the day after implantation. LLC tumors were removed from mice 12 days after the implantation for quantitative RT‐PCR (PBS only, n = 23; 2‐OX, n = 18). Error bars represent 1 SD. * indicates significance compared with control, P < 0.05. Vegf mRNA levels in LLC tumors were quantified by quantitative RT‐PCR and normalized to the level of Actin mRNA.
2‐OX in combination with 5‐FU chemotherapy clearly inhibits tumor growth and tissue Vegf expression in vivo. The anti‐VEGF antibody bevacizumab has been used clinically to reduce tumor growth in combination with chemotherapeutic reagents such as 5‐FU.( 25 ) To assess the effect of 2‐OX in combination with 5‐FU on tumor growth, we injected 2‐OX and 5‐FU intraperitoneally in mice with solid tumors. Tumor volumes and weights 15 days after implantation were as follows: PBS alone, 531.2 ± 144.9 mm3 and 306.3 ± 186.6 mg; 2‐OX alone, 324.0 ± 156.5 mm3 and 308.7 ± 299.0 mg; 5‐FU alone, 287.1 ± 155.2 mm3 and 204.7 ± 108.9 mg; and 5‐FU + 2‐OX, 98.7 ± 64.9 mm3 and 130.3 ± 113.5 mg (Fig. 6a–c). 5‐FU combined with 2‐OX significantly inhibited tumor growth in this model, which was accompanied by a 53% reduction of Vegf gene expression in tumor tissues removed from mice 15 days after implantation as determined by quantitative RT‐PCR analysis (Fig. 6d).
Figure 6.
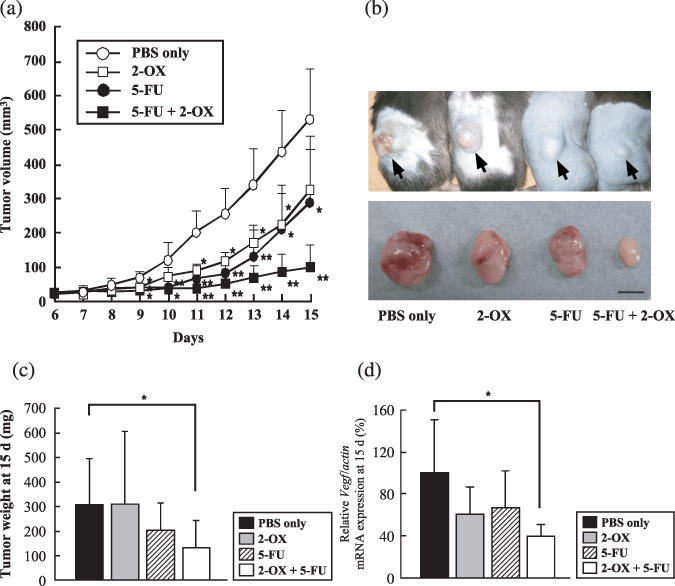
Effect of 2‐oxoglutarate (2‐OX) and/or 5‐fluorouracil (5‐FU) on growth of Lewis lung carcinoma (LLC) cells in vivo. Cells in PBS were implanted into the right flank region of 7‐week‐old C57BL/6J mice. Intraperitoneal injections of the indicated cocktails occurred daily beginning on day 7 after implantation. From 6 to 15 days after implantation, we measured tumors with calipers and calculated volumes as (length × width2) × 0.5. (a) Tumor volume. (b) Gross appearance of xenografts and excised tumors at day 15. Scale bar, 5 mm. (c) Tumor weight at day 15. A representative result from three independent experiments with similar results is shown. Five separate experiments were performed. Error bars represent 1 SD. * indicates significance compared with control, P < 0.05. ** indicates significance compared with control, P < 0.01. (d) Effect of 2‐OX in combination with 5‐FU on vascular endothelial growth factor (Vegf) mRNA expression in vivo. Cells in PBS were implanted into the right flank region of 7‐week‐old C57BL/6J mice. Intraperitoneal injections of the indicated cocktails occurred daily beginning at day 7 after implantation. LLC tumors were removed from mice 15 days after implantation for quantitative RT‐PCR. Eight separate experiments were performed. Error bars represent 1 SD. * indicates significance compared with control, P < 0.01. Vegf mRNA levels in LLC tumors were quantified by quantitative RT‐PCR and normalized to the level of Actin mRNA.
Effect of 2‐OX in combination with 5‐FU chemotherapy on tumor vessel density and pericyte coverage. Pericyte coverage of tumor vessels was further analyzed by dual immunostaining with anti‐CD31 antibody and anti‐smooth muscle actin–antibody, which detect endothelial cells and pericytes, respectively (Fig. 7a). The number of CD31‐positive objects and the number of those objects surrounded by regions positive for smooth muscle actin were quantified. We observed significant differences in tumor vessel density (PBS alone, 100 ± 19.8%; and 2‐OX alone, 39.8 ± 19.7%; 5‐FU alone, 58.8 ± 24.5%; 5‐FU + 2‐OX, 27.2 ± 11.1%) (Fig. 7b). The proportion of endothelial cells associated with pericytes 15 days after implantation were as follows: PBS alone, 100 ± 24.9%; 2‐OX alone, 771.0 ± 365.3%; 5‐FU alone, 189.0 ± 124.8%; and 5‐FU + 2‐OX, 1254.2 ± 290.1% (Fig. 7c). Thus 2‐OX and/or 5‐FU treatment changes the coverage rate of tumor endothelial cells. Significant reduction of tumor vessel density may result from inhibition of endothelial proliferation by 2‐OX (Fig. 7d), although this is not clear at the moment.
Figure 7.
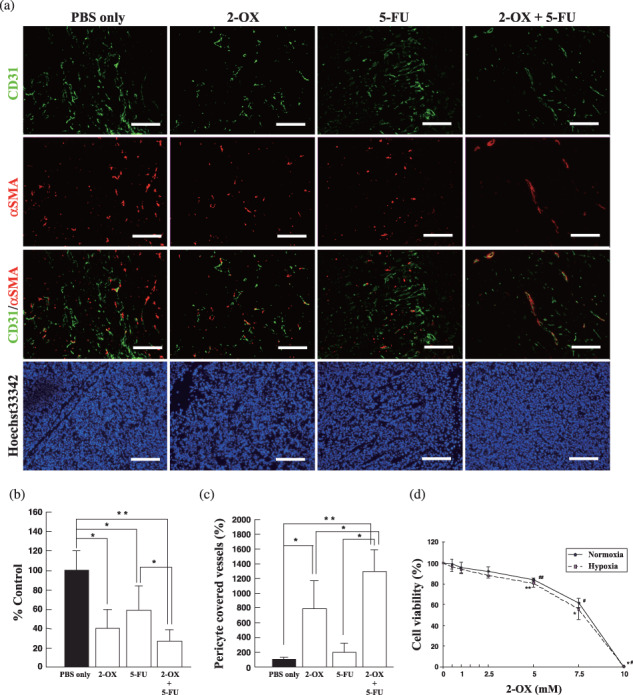
Effect of 2‐oxoglutarate (2‐OX) and/or 5‐fluorouracil (5‐FU) on pericyte coverage of tumor endothelial cells. (a) Immnohistochemistry of 2‐OX and/or 5‐FU tumors with anti‐CD31 and anti‐smooth muscle actin (SMA) antibodies. Immunohistochemical studies for CD31 and SMA and blood vessel formation were examined under a microscope and photographed. Scale bar, 150 µm. (b) Evaluation of tumor vessel density in 2‐OX and/or 5‐FU treated tumors. Area of tumor vessel density was analyzed with angiogenesis‐measuring software. Five separate experiments were performed. Error bars represent 1 SD. * indicates significance compared with control, P < 0.05. ** indicates significance compared with control, P < 0.01. (c) Effects of 2‐OX on tumor vessel density and pericyte coverage. The number of CD31‐positive objects and the number of those objects surrounded by regions positive for smooth muscle actin were quantified using Win ROOF software. Five separate experiments were performed. Error bars represent 1 SD. * indicates significance compared with control, P < 0.05. ** indicates significance compared with control, P < 0.01. (d) Effect of 2‐OX on HUVEC proliferation. HUVECs (1 × 10⁴) were incubated with the indicated concentration of 2‐OX under normoxic or hypoxic conditions. Cell viability was measured by a non‐radioactive cell proliferation assay. The number of living cells incubated without 2‐OX was expressed as 100%. Error bars represent 1 SD (n = 6). Normoxia, 21% O2; hypoxia, 1% O2. There was significant difference of cell viability in 2‐OX‐treated cells compared with PBS‐treated cells both under normoxia and hypoxia. #, *, P < 0.001; ##, **, P < 0.005.
Discussion
Since the concentration of 2‐OX and dioxygen is essential for hydroxylation and degradation of HIF‐1α protein, consistent with this report, Jaakkola et al. examined a series of 2‐OX analogs that act as competitive inhibitors of PHDs( 26 ) for their ability to inhibit HIF–PHD.( 21 ) We also reported that 2‐OX treatment of Hep3B cells induced HIF‐1α degradation in vitro and reduced the production of VEGF protein.( 22 ) Treatment with 2‐OX also restored PHD2 to control levels and abolished the nuclear accumulation of HIF‐1α.( 27 ) Based on cell culture studies, cell‐permeating 2‐OX derivatives have been proposed as a new therapy to restore normal PHD activity and HIF‐1α levels to those of succinate dehydrogenase–suppressed cells.( 28 ) These in vitro studies indicate that 2‐OX induces HIF‐1α degradation and suppresses gene expression downstream of HIF‐1. However, it was not clear whether 2‐OX could be useful for suppression of tumor angiogenesis and its growth in animals. Our current study clearly shows that 2‐OX reduced the HIF‐1α protein level in LLC cells and reduced LLC cell‐induced tumor angiogenesis in an animal model. 2‐OX also reduced tumor growth in a dose‐dependent manner.
It is widely recognized that targeting tumor endothelial cells is useful for tumor therapy. Bevacizmab, a neutralizing antibody against VEGF, has been used for various tumor therapies in combination with chemoreagents.( 24 , 25 ) In the present study, we evaluated the effect of 2‐OX on tumor angiogenesis in a DAS model. Addition of 2‐OX clearly reduced LLC tumor growth in a dose‐dependent manner. Furthermore, combining 2‐OX and 5‐FU revealed more drastic antitumor activity compared with single injections. It is of note that the Vegf mRNA level was reduced in the 2‐OX and 5‐FU‐treated tumor, suggesting that downregulation of Vegf mRNA may account, in part, for the reduced tumor growth. Tang et al. demonstrated that loss of HIF‐1 in endothelial cells disrupts a hypoxia‐driven VEGF autocrine loop necessary for tumor growth.( 29 ) Since we found that 2‐OX inhibits tube formation and proliferation of endothelial cells in a dose‐dependent manner in an in vitro study, the reduced growth of 2‐OX‐treated tumors may result from direct inhibition of endothelial proliferation and/or tube formation in addition to the reduced VEGF expression in tumor cells. In addition, treatment with 2‐OX reduced not only microvessel density, but also increased the ratio of blood vessels covered with pericytes. A similar observation has been reported following treatment with VEGFR inhibitors.( 30 , 31 ) Jain( 32 ) proposed an attractive hypothesis that some anti‐angiogenic agents could inhibit new tumor vessel formation (neoangiogenesis) and transiently normalize the abnormal structure and function of tumor vasculature to enhance oxygen permeation and drug delivery. The vascular normalization hypothesis predicts that a VEGF signaling blockade would result in an increase in pericyte coverage of tumor vessels.( 33 ) Taken together, 2‐OX could be an effective anti‐angiogenic agent in combination with chemotherapeutic reagent such as 5‐FU.
Among the three members of the HIF‐PHD genes, PHD2 may play a major role in HIF1α hydroxylation during hypoxia. However, it is not clear that HIF‐1α destabilization by 2‐OX is mediated by PHD2. Further studies will be required for clarification of the molecular mechanism of 2‐OX action during the inhibition of tumor angiogenesis and growth.
Small chemical molecules that activate or inhibit HIF‐PHD have been reported. Choi et al. found a potent activator of PHD2 called KRH102053.( 34 ) The effects of KRH102053 on controlling HIF were studied in cell lines. Under their experimental conditions, KRH102053 decreased the protein level of HIF‐1α and the mRNA levels of HIF‐regulated downstream target genes, such as VEGF, aldolase A, enolase 1, and monocarboxylate transporter 4, in cell models. Inhibition of HIF–PHD mimics hypoxia, stabilizes HIF, and stimulates Epo gene expression, even under normoxic conditions. FibroGen has recently developed a new HIF–PHD inhibitor called FG‐2216.( 35 ) It has completed a phase I study of FG‐2216 using 54 healthy subjects in the UK and is conducting a phase II study of FG‐2216 involving 42 patients with chronic kidney diseases or chemically induced anemia in Germany and Poland.( 35 ) Doses of 6 mg/kg of FG‐2216 and higher caused a dose‐dependent elevation of serum Epo, which increased hemoglobin concentrations by 1.1 g/dL above the baseline level on day 42 of the study.( 35 ) However, as expected, based on the effects of HIF–PHD, there is concern that FG‐2216 might increase expression of VEGF. The same is equally true of whole body 2‐OX administration.
2‐OX is a metabolite in the Tri Carboxylic Acid cycle and exists in cells at relatively high concentrations. Our study clearly showed that various concentrations had no effect on the viability of cultured cells but were sufficient to reduce tumor size. Further, 2‐OX had no effect on pre‐existing endothelial cells and had no effect on blood cell count in peripheral blood samples that were obtained from the retro‐orbital plexus of mice. Taken together, 2‐OX is a promising new therapeutic reagent with no apparent side effects for inhibiting tumor angiogenesis and tumor size.
Hypoxia has been shown to be a very important stimulus for new vessel formation as seen in coronary artery disease( 36 ) and diabetic neovascularization.( 37 ) HIF‐1 is a key transcription factor regulating oxygen homeostasis. Arjamaa et al. showed that all oxygen‐dependent diseases of the retina are regulated by HIF.( 38 ) Thus, it will be very interesting to investigate in future if 2‐OX inhibits other HIF‐dependent diseases in animal models.
Acknowledgments
K.M. is a recipient of a Japan Society for the Promotion of Science Research Fellowship for Young Scientists. We thank Ms H. Tanaka for her expert technical assistance. This work was supported in part by a Grant‐in‐Aid for Scientific Research on Priority Areas (no. 17013016) (S.T.) and Grants‐in‐Aid for Scientific Research from the Ministry of Education, Science and Culture of Japan.
References
- 1. Folkman J. Tumor angiogenesis: therapeutic implications. N Engl J Med 1971; 285: 1182–6. [DOI] [PubMed] [Google Scholar]
- 2. Gasparini G, Longo R, Toi M, Ferrara N. Angiogenic inhibitors: a new therapeutic strategy in oncology. Nat Clin Pract Oncol 2005; 2: 562–77. [DOI] [PubMed] [Google Scholar]
- 3. Leung DW, Cachianes G, Kuang WJ, Goeddel DV, Ferrara N. Vascular endothelial growth factor is a secreted angiogenic mitogen. Science 1989; 246: 1306–9. [DOI] [PubMed] [Google Scholar]
- 4. Levy AP, Tamargo R, Brem H, Nathans D. An endothelial cell growth factor from the mouse neuroblastoma cell line NB41. Growth Factors 1989; 2: 9–19. [DOI] [PubMed] [Google Scholar]
- 5. Senger D, Van de Water L, Brown LF et al . Vascular permeability factor (VPF, VEGF) in tumor biology. Cancer Metastasis Rev 1993; 12: 303–24. [DOI] [PubMed] [Google Scholar]
- 6. Goldberg MA, Schneider T. Similarities between the oxygen‐sensing mechanism regulating the expression of vascular endothelial growth factor and erythropoietin. J Biol Chem 1994; 269: 4355–9. [PubMed] [Google Scholar]
- 7. Plate KH, Breier G, Weich HA, Risau W. Vascular endothelial growth factor is a potential tumor angiogenesis factor in human gliomas in vivo . Nature 1992; 359: 845–8. [DOI] [PubMed] [Google Scholar]
- 8. Aiello LP, Avery RL, Arrigg PG et al . Vascular endothelial growth factor in ocular fluid of patients with diabetic retinopathy and other retinal disorders. N Engl J Med 1994; 331: 1480–7. [DOI] [PubMed] [Google Scholar]
- 9. Sharma HS, Wunsch M, Brand T, Verdouw PD, Schaper W. Molecular biology of the coronary vascular and myocardial responses to ischemia. J Cardiovasc Pharmacol 1992a; 20: S23–S31. [PubMed] [Google Scholar]
- 10. Sharma HS, Wunsch M, Schmidt M, Schott RJ, Kandolf R, Schaper W. Expression of angiogenic growth factors in the collateralize swine myocardium. EXS 1992b; 61 (Exper Suppl): 255–260. [DOI] [PubMed] [Google Scholar]
- 11. Shweiki D, Itin A, Soffer D, Keshet E. Vascular endothelial growth factor induced by hypoxia may mediate hypoxia‐initiated angiogenesis. Nature 1992; 359: 843–5. [DOI] [PubMed] [Google Scholar]
- 12. Schuster SJ, Badiavas EV, Costa‐Giomi P, Weinmann R, Erslev AJ, Caro J. Stimulation of erythropoietin gene transcription during hypoxia and cobalt exposure. Blood 1989; 73: 13–6. [PubMed] [Google Scholar]
- 13. Goldberg MA, Gaut CC, Bunn HF. Erythropoietin mRNA levels are governed by both the rate of gene transcription and posttranscriptional events. Blood 1991; 77: 271–7. [PubMed] [Google Scholar]
- 14. Rondon IJ, MacMillan LA, Beckman BS et al . Hypoxia up‐regulates the activity of a novel erythropoietin mRNA binding protein. J Biol Chem 1991; 266: 16594–8. [PubMed] [Google Scholar]
- 15. Semenza GL, Wang GL. A nuclear factor induced by hypoxia via de novo protein synthesis binds to the human erythropoietin gene enhancer at a site required for transcriptional activation. Mol Cell Biol 1992; 12: 5447–54. [DOI] [PMC free article] [PubMed] [Google Scholar]
- 16. Wang GL, Semenza GL. Characterization of hypoxia‐inducible factor 1 and regulation of DNA binding activity by hypoxia. J Biol Chem 1993; 268: 21513–8. [PubMed] [Google Scholar]
- 17. Semenza GL. HIF‐1 and human disease: one highly involved factor. Genes Dev 2000; 14: 1983–91. [PubMed] [Google Scholar]
- 18. Iyer NV, Kotch LE, Agani F et al . Cellular and developmental control of O2 homeostasis by hypoxia‐inducible factor 1α. Genes Dev 1998; 12: 149–62. [DOI] [PMC free article] [PubMed] [Google Scholar]
- 19. Wang GL, Jiang B‐H, Rue EA, Semenza GL. Hypoxia‐inducible factor 1 is a basic‐helix‐loop‐helix‐PAS heterodimer regulated by cellular O2 tension. Proc Natl Acad Sci USA 1995; 92: 5510–4. [DOI] [PMC free article] [PubMed] [Google Scholar]
- 20. Maxwell PH, Wiesener MS, Chang GW et al . The tumor suppressor protein VHL targets hypoxia‐inducible factors for oxygen‐dependent proteolysis. Nature 1999; 399: 271–5. [DOI] [PubMed] [Google Scholar]
- 21. Jaakkola P, Mole DR, Tian YM et al . Targeting of HIF‐α to the von Hippel–Lindau ubiquitylation complex by O2‐regulated prolyl hydroxylation. Science 2001; 292: 468–72. [DOI] [PubMed] [Google Scholar]
- 22. Matsumoto K, Imagawa S, Obara N et al . 2‐Oxoglutarate downregulates expression of vascular endothelial growth factor and erythropoietin through decreasing hypoxia‐inducible factor‐1α and inhibits angiogenesis. J Cell Physiol 2006; 209: 333–40. [DOI] [PubMed] [Google Scholar]
- 23. Shimamura M, Nagasawa H, Aahino H et al . A novel hypoxia‐dependent 2‐nitroimidazole KIN‐841 inhibits tumor‐specific angiogenesis by blocking production of angiogenic factors. Br J Cancer 2003; 88: 307–13. [DOI] [PMC free article] [PubMed] [Google Scholar]
- 24. Ferrara N, Hillan KJ, Novotny W. Bevacizumab (Avastin), a humanized anti‐VEGF monoclonal antibody for cancer therapy. Biochem Biophys Res Commun 2005; 333: 328–35. [DOI] [PubMed] [Google Scholar]
- 25. Huwitz H, Fehrenbacher L, Novotny W et al . Bevacizmab plus irinotecan, fluorouracil, and leucovorin for metastatic colorectal cancer. N Engl J Med 2004; 350: 2335–42. [DOI] [PubMed] [Google Scholar]
- 26. Cunliffe CJ, Franklin TJ, Hales NJ, Hill GB. Novel inhibitors of prolyl 4‐hydroxylase. 3. Inhibition by the substrate analogue N‐oxaloglycine and its derivatives. J Med Chem 1992; 35: 2652–8. [DOI] [PubMed] [Google Scholar]
- 27. Mailloux RJ, Puiseux‐Dao S, Appanna VD. α‐Ketoglutarate abrogates the nuclear localization of HIF‐1α in aluminum‐exposed hepatocytes. Biochimie 2009; 91: 408–15. [DOI] [PubMed] [Google Scholar]
- 28. MacKebzie ED, Selak MA, Tennant DA et al . Cell‐permeating α‐ketoglurate derivatives alleviate pseudohypoxia in succinate dehydrogenase‐deficient cells. Mol Cell Biol 2007; 27: 3282–9. [DOI] [PMC free article] [PubMed] [Google Scholar]
- 29. Tang N, Wang L, Esko J et al . Loss of HIF‐1 in endothelial cells disrupts a hypoxia‐driven VEGF autocrine loop necessary for tumorigenesis. Cancer Cell 2004; 6: 485–95. [DOI] [PubMed] [Google Scholar]
- 30. Drevs J, Muller‐Driver R, Wittig C et al . PTK787/ZK 222584, a specific vascular endothelial growth factor‐receptor tyrosine kinase inhibitor, affects the anatomy of the tumor vascular bed and the functional vascular properties as detected by dynamic enhanced magnetic resonance imaging. Cancer Res 2002; 62: 4015–22. [PubMed] [Google Scholar]
- 31. Nakamura K, Taguchi E, Miura T et al . KRN951, a highly potent inhibitor of vascular endothelial growth factor receptor tyrosine kinases, has antitumor activities and affects functional vascular properties. Cancer Res 2006; 66: 9134–42. [DOI] [PubMed] [Google Scholar]
- 32. Jain RK. Normalization of tumor vasculature: an emerging concept in antiangiogenic therapy. Science 2005; 307: 58–62. [DOI] [PubMed] [Google Scholar]
- 33. Winkler F, Kozin SV, Tong RT et al . Kinetics of vascular normalization by VEGFR2 blockade governs brain tumor response to radiation: role of oxygenation, angiopoietin‐1, and matrix metalloproteinases. Cancer Cell 2004; 6: 553–63. [DOI] [PubMed] [Google Scholar]
- 34. Choi HJ, Song BJ, Gong YD, Gwak WJ, Soh Y. Rapid degradation of hypoxia‐inducible factor‐1alpha by KRH102053, a new activator of prolyl hydroxylase 2. Br J Pharmacol 2008; 154: 114–25. [DOI] [PMC free article] [PubMed] [Google Scholar]
- 35. Urquilla P, Fong A, Oksanen S et al . Upregulation of endogenous erythropoietin (Epo) in healthy subjects by inhibition of hypoxia‐inducible factor (HIF) prolyl hydroxylase. Blood 2004; 103: Abstract #174. [Google Scholar]
- 36. Sabri MN, DiSciascio G, Gowley MJ, Alpert D, Vetrovec GW. Coronary collateral recruitment: functional significance and relation to rate of vessel closure. Am Heart J 1991; 121: 876–80. [DOI] [PubMed] [Google Scholar]
- 37. Aiello LP, Avery RL, Arrigg PG et al . Vascular endothelial growth factor in ocular fluid of patients with diabetic retinopathy and other retinal disorders. N Engl J Med 1994; 331: 1480–7. [DOI] [PubMed] [Google Scholar]
- 38. Arjamaa O, Nikinmaa M. Oxygen‐dependent diseases in the retina: Role of hypoxia‐inducible factors. Exp Eye Res 2006; 83: 473–83. [DOI] [PubMed] [Google Scholar]