

Abstract
The ectonucleoside triphosphate diphosphohydrolases (E‐NTPDases) are a family of ectoenzymes that hydrolyze extracellular nucleotides, thereby modulating purinergic signaling. Gliomas have low expression of all E‐NTPDases, particularly NTPDase2, when compared to astrocytes in culture. Nucleotides induce glioma proliferation and ATP, although potentially neurotoxic, does not evoke cytotoxic action on the majority of glioma cultures. We have previously shown that the co‐injection of apyrase with gliomas decreases glioma progression. Here, we tested whether selective re‐establishment of NTPDase2 expression would affect glioma growth. NTPDase2 overexpression in C6 glioma cells had no effect on in vitro proliferation but dramatically increased tumor growth and malignant characteristics in vivo. Additionally, a sizable platelet sequestration in the tumor area and an increase in CD31 or platelet/endothelial cell adhesion molecule‐1 (PECAM‐1), vascular endothelial growth factor and OX‐42 immunostaining were observed in C6‐Enhanced Yellow Fluorescent Protein (EYFP)/NTPDase2‐derived gliomas when compared to controls. Treatment with clopidogrel, a P2Y12 antagonist with anti‐platelet properties, decreased these parameters to control levels. These data suggest that the ADP derived from NTPDase2 activity stimulates platelet migration to the tumor area and that NTPDase2, by regulating angiogenesis and inflammation, seems to play an important role in tumor progression. In conclusion, our results point to the involvement of purinergic signaling in glioma progression. (Cancer Sci 2009)
Glioblastoma multiforme, the most common form of malignant brain tumor, is relatively resistant to therapeutic strategies and has a median survival after first diagnosis of only around 12 months. This median survival has remained unchanged for decades despite multiple clinical trials designed to optimize radiation and/or chemotherapy regimens.( 1 , 2 ) Although systemic metastases of malignant gliomas are relatively rare, the highly infiltrative nature exhibited by these tumors is the main cause of treatment failure and high recurrence rates. Recent works suggest that malignant gliomas have a stem cell population, which is fundamental for tumor maintenance and growth. Such cellular subpopulations seem to be more resistant to radiotherapy, exhibit enhanced proliferative and migratory potential, and can overcome diverse paths of differentiation.( 3 ) In addition to neoplastic cells, a number of non‐malignant cells such as lymphocytes, endothelial cells, microglial cells, and macrophages comprise the tumor microenvironment and appear to be associated with tumor progression by influencing cell proliferation and angiogenesis.( 4 )
Glioma invasion is a multifactorial process consisting of numerous genetic and physiological alterations, which affect glioma cell interactions with neurons, glia, and vascular cells in the central nervous system.( 3 ) Among the pathological alterations that give tumor cells invasive potential, purinergic signaling is emerging as an important component. By activating specific purinergic receptors (P2X and P2Y), extracellular ATP has been shown to mediate a variety of biological functions,( 5 ) including events related to cell proliferation, cell differentiation, and cell death.( 6 ) The effects of nucleotides and nucleosides on purinergic receptors are regulated by the action of ectonucleotidases, such as ectonucleoside triphosphate diphosphohydrolase (E‐NTPDase) and ecto‐5′‐nucleotidase or CD73 (ecto‐5′‐NT/CD73). These ectoenzymes can efficiently hydrolyze ATP, ADP, and AMP to adenosine in the extracellular space, with the latter being taken up by specialized transporters. The molecular properties, functional roles, and nomenclature of ectonucleotidases have been extensively reviewed in Zimmermann and Robson et al.( 7 , 8 )
Accumulating evidence published by our group and others suggests that purinergic signaling is involved in the growth and progression of gliomas. In previous studies, we demonstrated that glioma cell lines have altered extracellular ATP, ADP, and AMP catabolism, showing low rates of extracellular ATP hydrolysis and high rates of extracellular AMP hydrolysis when compared to astrocytes in culture.( 9 ) Adenine nucleotides induce cell proliferation in diverse human glioma cell lines( 10 ) and the majority of glioma cell lines are resistant to cell death induced by cytotoxic ATP concentrations.( 11 ) As ATP is poorly hydrolyzed by glioma cells, it could potentially accumulate in the tumor periphery resulting in glioma cell proliferation and neuronal toxicity. It has been suggested that the purinergic( 9 , 10 , 11 , 12 ) and glutamatergic systems( 13 ) are involved in this process. In this model, we hypothesize that neuronal death induced by glutamate released from gliomas results in the liberation of the intracellular milieu, which normally has high ATP and glutamate concentrations, leading to more neuronal cell death and glioma proliferation in a positive feedback cycle. Because gliomas, contrary to astrocytes in culture, exhibit low NTPDase expression and activity,( 12 ) this feedback is not blocked. In agreement with this hypothesis, we have previously shown that the co‐injection of apyrase, an ATP scavenger enzyme, with gliomas significantly decreases the growth and malignity of gliomas implanted in rats, indicating that ATP plays an important role in glioma proliferation in vivo. ( 12 )
Considering that NTPDase2 is the dominant E‐NTPDase member expressed by astrocytes in culture,( 14 ) the present study aimed to better characterize the participation of nucleotides and the role of E‐NTPDases in glioma progression by restoring NTPDase2 expression and activity in rat C6 glioma cells. The in vitro and in vivo impact of NTPDase2 expression on glioma growth was evaluated. The results shown here could give new insights into how nucleotides modulate glioma progression in vivo.
Materials and Methods
Cell culture. The C6 rat glioma and COS‐7 cell lines (American Type Culture Collection, Rockville, Maryland, USA) were grown in culture flasks and maintained in DMEM containing 1% DMEM, 8.39 mM HEPES (pH 7.4), 23.8 mM NaHCO3, 0.1% fungizone, and 0.032% gentamicin (Gibco BRL, Invitrogen Co., Carlsbad, CA, USA) and supplemented with 5 or 10% (v/v) FBS (Cultilab, Campinas, SP, Brazil) for rat C6 glioma or COS‐7 cells respectively. Cells were kept at a temperature of 37°C, humidity of 95% and 5% CO2 in air.
DNA construction. Enhanced Yellow Fluorescent Protein (EYFP)‐ NTPDase2 was constructed by inserting NTPDase2 from pGW1‐hCD39L1( 15 ) using EcoRI into the PBS‐SKII plasmid (Stratagene, La Jolla, CA, USA), sequencing it, and then inserting it into pEYFP‐C1 (Clontech Laboratories Inc., Palo Alto, CA, USA) using BamHI and SalI restriction sites.
Transient transfection. COS‐7 cells were seeded in 24‐multiwell plates and grown in DMEM with 10% FBS. Cells at 80% confluence were transfected with Lipofectamine 2000 (Life Technologies, Invitrogen Co., Carlsbad, CA, USA) according to the manufacturer's instructions with 1 µg/well of PBS‐SKII‐hNTPDase2 (COS‐7‐NTPDase2), pEYFP‐hNTPDase2 (COS‐7‐EYFP/NTPDase2), or pEYFP empty vector (COS‐7‐EYFP).
C6 glioma cells were grown in DMEM with 5% FBS. Cells were seeded in 25 cm2 culture flasks and transfected with Lipofectamine 2000, using 1 µg of pEYFP (C6‐EYFP) or pEYFP/NTPDase2 (C6‐EYFP/NTPDase2). Twenty‐four hours after transfection, the transfected cells were selected with 2.0 mg/mL G418 (Sigma Chemical Co., St. Louis, MO, USA).
The functionality of the plasmid encoding the EYFP or EYFP/NTPDase2 sequences was confirmed by evaluating the ATPase and ADPase activities in COS‐7 and C6 glioma‐transfected cells, as described below.
E‐NTPDase activity assay. Three days after transfection, the ATP/ADPase activities were determined in COS‐7 and C6 glioma cells, as described previously,( 9 ) in incubation medium (2 mM CaCl2, 120 mM NaCl, 5 mM KCl, 10 mM glucose, 20 mM HEPES [pH 7.4], and 3 mM of nucleotides ATP or ADP) incubated at 37°C. The release of inorganic phosphate (Pi) and the protein concentration were measured by the Malachite Green( 16 ) and Coomassie Blue methods( 17 ) respectively. Specific activity was expressed as nmol Pi released/min/mg protein.
In vitro assessment of glioma cell proliferation. C6, C6‐EYFP, or C6‐EYFP/NTPDase2 glioma cells were seeded at 2 × 10³ cells/well in DMEM with 5% FBS in 96‐multiwell plates and allowed to grow for increasing amounts of time (3, 4, 5, or 6 days). Then, the cell number was assessed by cell counting with a hemocytometer and cell viability was evaluated by 3‐(4,5‐dimethylthiazol‐2yl)‐2,5‐diphenyl tertrazolium bromide (MTT) assay (Sigma Chemical Co., St. Louis, MO, USA).
Glioma implantation. C6, C6‐EYFP, or C6‐EYFP/NTPDase2 glioma cells were cultured to approximately 70% confluence and a total of 1 × 10⁶ cells in 3 µL DMEM with 5% FBS was injected in the right striatum at a depth of 6.0 mm (coordinates with regard to bregma: 0.5 mm posterior and 3.0 mm lateral) of male Wistar rats (250–270 g, 8 weeks old) anesthetized by i.p. administration of ketamine and xilazine.( 13 ) The same procedure was carried out for the negative control group, except that 3 µL DMEM with 5% FBS (no cells) was injected. All procedures used in the present study followed the Principles of Laboratory Animal Care from NIH and were approved by the Ethical Committee of the Hospital de Clínicas de Porto Alegre.
In vivo clopidogrel treatment. One day after C6‐EYFP/NTPDase2 glioma implantation, clopidogrel (10 mg/kg/day; Sanofi Winthrop, Toulouse, France) was administered by gavage to rats over a period of 19 days. Clopidogrel was prepared in PBS (pH 7.4) at a final concentration of 8.4 mg/mL. Control animals were treated with the equivalent volume of PBS.
Pathological analysis and tumor volume quantification. Twenty days after glioma implantation, rats were decapitated and the entire brain was removed, sectioned and fixed in 10% paraformaldehyde (PFA) in PBS (pH 7.4). The fixed tissue sections were then stained with hematoxylin–eosin (HE) and pathological analysis of the slides was carried out by two pathologists in a blinded manner. Glioma cell proliferation was assessed by counting the number of mitotic glioma cell nuclei in ten randomly chosen fields (×200) per tumor (Olympus America Inc., Center Valley, PA, USA). Tumor size was quantified by analyzing images captured with a digital camera connected to a microscope with Image Tool Software (Department of Dental Diagnostic Science, The University of Texas Health Science Center, San Antonio, TX, USA). The total volume (mm3) of the tumor was computed by summing the segmented areas and by multiplication of the slice resolution.
Immunohistochemical staining. The anesthetized rats were perfused with 4% PFA in PBS (pH 7.4). Following post‐fixation incubation in 4% PFA for 24 h, the brains were cryoprotected in 30% sucrose solution, embedded in OCT freezing medium (Tissue‐Tek; Sakura Finetk, Torrance, CA, USA) and snap frozen in isopentane in dry ice and stored at –80°C until use. To carry out the immunohistochemical (IHC) analysis, cryostat sections (5 µm) were fixed in acetone, blocked in 1% albumin solution, and incubated overnight (4°C) with the following specific antibodies: mouse anti‐rat mAb CD31 or platelet/endothelial cell adhesion molecule‐1 (PECAM‐1) (1:30) and rabbit anti‐rat pAb P‐selectin (1:500; BD Pharmingen, BD Biosciences, Mountain View, CA, USA); rabbit anti‐rat pAb Ki67 (1:300) and mouse anti‐rat mAb OX‐42 (1:200; Abcam Inc., Cambridge, MA, USA); mouse anti‐human mAb vascular endothelial growth factor (VEGF) (1:30; Dako, CA, USA). Next, tissue sections were incubated with biotinylated secondary antibody and streptavidin–avidin–biotin (kit Lsab; Dako, USA). The peroxidase reaction was carried out using 3,3′diaminobenzidina tetrahydrochloride, according to the manufacturer's specifications. Finally, sections were counterstained with Harris haematoxylin. The IHC slides were analyzed by two pathologists in a blinded manner. The microvessel density measurements for CD31/PECAM‐1 staining were carried out using Weidner's method.( 18 ) In addition to the morphologically identifiable vessels with a lumen, each positive endothelial cell cluster of immunoreactivity in contact with the selected field was counted as an individual vessel. The VEGF analysis was carried out according to methods of Cascinu and colleagues.( 19 ) VEGF expression showed cytoplasmic localization and only clearly immunoreactive cells were considered positive. The VEGF quantitative analysis was scored as the percentage of immunoreactive cells. Additionally, the P‐selectin and OX‐42 immunostaining were also scored as the percentage of immunoreactive cells. All immunohistological evaluations were made in ten randomly chosen fields (×200) per tumor (Olympus BH‐2 microscope). In cases of disagreement, a final score was determined by consensus after independent re‐examination.
Statistical analysis. Data were expressed as mean ± SD and were subjected to one‐way analysis of variance (anova) followed by Tukey–Kramer post‐hoc test (for multiple comparisons). Differences between mean values were considered significant when P < 0.05.
Results
Effect of NTPDase2 expression on in vitro growth of C6 rat glioma cells. A plasmid encoding the EYFP/NTPDase2 sequence was constructed and its functionality tested by transfecting COS‐7 cells and evaluating ATP/ADPase activities. Three days after transfection, COS‐7 exhibited ATP/ADPase activities (170.0 ± 24.4 and 8.8 ± 0.68 nmol Pi/min/mg protein for ATP and ADP, respectively), indicating an active NTPDase2. The activity of this chimeric NTPDase was similar to the non‐chimeric form and cells transfected with EYFP empty vector did not exhibit ATP/ADPase activities (data not shown).
Next, NTPDase2 expression was restored in C6 glioma cells and the in vitro glioma growth was evaluated. Expression of NTPDase2 resulted in green fluorescence at the cell surface 72 h post‐transfection (Fig. 1a), and these cells exhibited a high ATPase activity with an ATP/ADPase ratio of around 12, as expected for this enzyme (Fig. 1b). The in vitro growth of C6, C6‐EYFP, and C6‐EYFP/NTPDase2 glioma cells was accessed by cell count (Fig. 1c) and MTT assay (Fig. 1d). No significant differences in the growth of these cells were observed.
Figure 1.
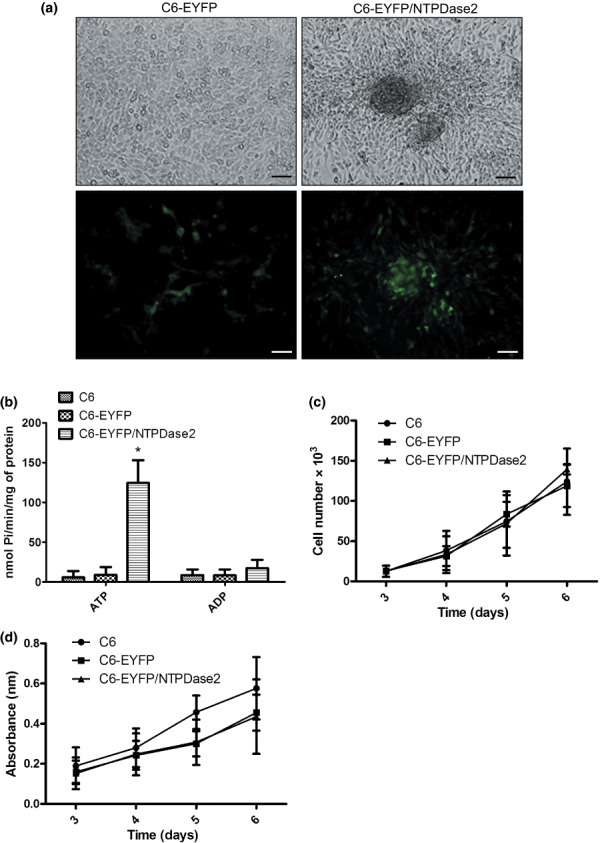
NTPDase2 overexpression in C6 glioma cells. (a) Representative pictures of C6‐EYFP and C6‐EYFP/NTPDase2 cells in culture 72 h after transfection. C6 glioma cells were transfected with a plasmid encoding EYFP (C6‐EYFP) or EYFP/NTPDase2 (C6‐EYFP/NTPDase2). Scale bars = 20 µm. (b) ATP/ADPase activities of C6 cells transfected as in (a). (c,d) The C6, C6‐EYFP, and C6‐EYFP/NTPDase2 cells (2 × 10³ cells/per well) were grown in DMEM with 5% FBS and the cell number or cell viability was assessed by (c) cell counting or (d) MTT assay. The values represent the mean ± SD of at least three independent experiments carried out in triplicate. Data were analyzed by anova followed by post‐hoc comparisons (Tukey–Kramer test). *Significantly different from the ATPase activity of non‐transfected cells or cells transfected with EYFP empty vector (P < 0.05).
Effect of NTPDase2 expression on in vivo glioma growth. To determine the involvement of NTPDase2 on in vivo glioma growth, C6, C6‐EYFP, or C6‐EYFP/NTPDase2 glioma cells were implanted by intracranial injection into adult Wistar rats. Twenty days after glioma implantation, rat brains were fixed and the tissue blocks were processed for HE staining. Despite a similar growth rate in vitro, a dramatic increase (approximately 200% compared to both C6 parental and C6‐EYFP) in the in vivo growth of C6‐EYFP/NTPDase2‐derived gliomas was observed (Fig. 2a–c). The average volume of C6‐EYFP/NTPDase2‐derived gliomas was 160 ± 22 mm3, compared to 100 ± 15 mm3 and 80 ± 18 mm3 for C6‐ or C6‐EYFP‐derived gliomas respectively.
Figure 2.
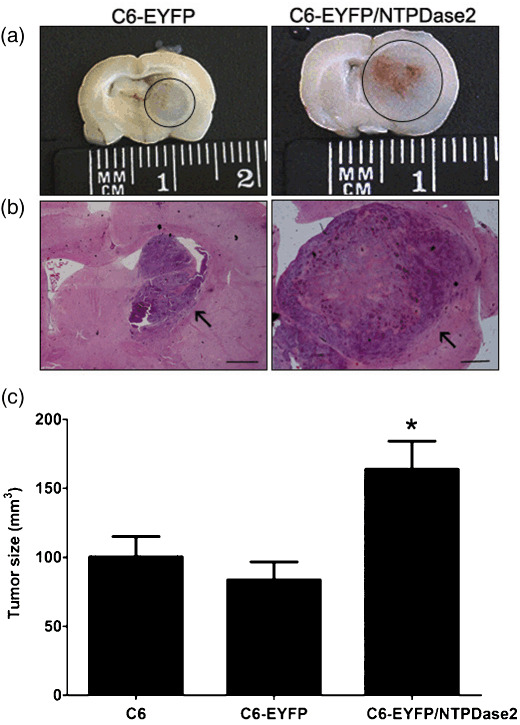
NTPDase2 expression stimulates C6 glioma growth in vivo. To determine the glioma growth in vivo, equal amounts of C6, C6‐EYFP, or C6‐EYFP/NTPDase2 cells (1 × 10⁶ cells) were implanted in the right striatum of Wistar rat brains by stereotaxical surgery. The animals were killed 20 days later and glioma sections were dissected and analyzed for tumor growth. (a) Photographs of rat brain slices of C6‐EYFP‐ and C6‐EYFP/NTPDase2‐implanted gliomas. The gliomas are marked with a circle. (b) Representative sections of C6‐EYFP‐ and C6‐EYFP/NTPDase2‐implanted gliomas stained with HE. Scale bars = 0.5 mm. (c) Tumor size quantification of implanted gliomas. Tumor size was evaluated 20 days following glioma implantation. Data represent the mean ± SD of at least six animals per group. Data were analyzed by anova, followed by Tukey–Kramer post‐hoc test. *Significantly different from C6 and C6‐EYFP gliomas (P < 0.05).
Pathological analysis revealed that C6‐EYFP/NTPDase2‐derived gliomas not only exhibited higher tumor volume when compared to control groups, but also show pathological characteristics related to increased glioma malignancy (Fig. 3; Table 1). All of the C6‐EYFP/NTPDase2‐derived gliomas exhibited extensive coagulative necrosis, intratumoral hemorrhage, lymphocytic infiltration, and peritumoral edema (Table 1). In addition, a significant increase in the mitotic index and Ki67 immunostaining in the C6‐EYFP/NTPDase2 group was observed (Fig. 4; Table 1), reflecting the high proliferation rate exhibited by these gliomas in vivo. These results suggest that something other than the proliferative rate of the C6‐EYFP versus C6‐EYFP/NTPDase2‐derived gliomas accounts for the difference in growth potential. It has previously been shown that NTPDase2, by preferentially removing ATP, can favor extracellular ADP accumulation and consequent P2Y1 and P2Y12 receptor modulation.( 20 , 21 ) In our experimental conditions, ADP could potentially promote platelet recruitment to the tumor area, favoring the malignant phenotype exhibited by C6‐EYFP/NTPDase2 gliomas in vivo. To test this hypothesis, we verified the presence of activated platelets, angiogenesis, and the inflammatory process in C6‐EYFP/NTPDase2‐derived gliomas.
Figure 3.
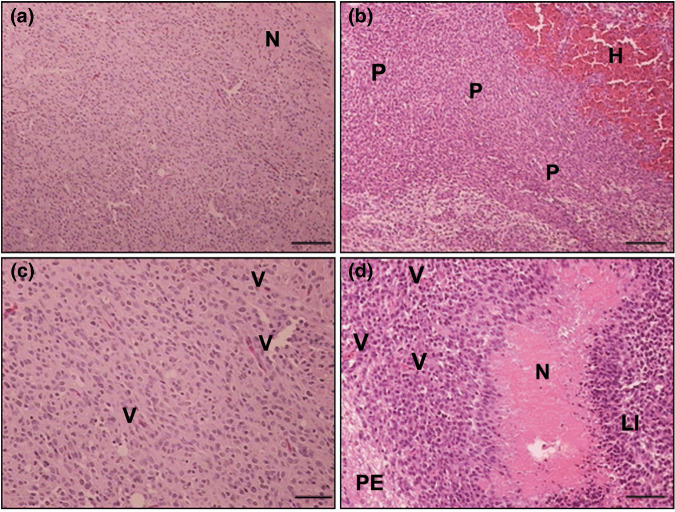
NTPDase2 expression increases the malignity of C6 gliomas in vivo. Representative HE sections of implanted (a,c) C6‐EYFP and (b,d) C6‐EYFP/NTPDase2 gliomas denote histological characteristics that define glioblastoma multiforme. Histological characteristics exhibited by C6‐EYFP/NTPDase2 gliomas indicate a dramatic increase in the malignant potential: extensive intratumoral hemorrhage (H), peripheric pseudopalisade (P), necrosis (N), peritumoral edema (PE), lymphocytic infiltration (LI), and vascular proliferation (V). The complete analysis is presented in Table 1. Scale bars = 100 µm (a,b); 50 µm (c,d).
Table 1.
Histological characteristics of implanted gliomas
| Histology | C6 (n = 12) | C6‐EYFP (n = 6) | C6‐EYFP/NTPDase2 (n = 8) | C6‐EYFP/NTPDase2 Clopidogrel (n = 5) |
|---|---|---|---|---|
| Coagulative necrosis | 6/12 | 4/6 | 8/8 | 2/5 |
| Intratumoral hemorrhage | 4/12 | 2/6 | 8/8 | 2/5 |
| Lymphocytic infiltration | 10/12 | 6/6 | 8/8 | 4/5 |
| Peritumoral edema | 5/12 | 2/6 | 8/8 | 2/5 |
| Peripheral pseudopalisading | 5/12 | 3/6 | 6/8 | 1/5 |
| Mitotic index: mitosis/ high power fields | 14.5 ± 5.0 | 16.6 ± 4.7 | 24.4 ± 3.0* | 8.0 ± 2.0*, † |
Significant difference between C6‐YN2 and control groups (C6 and C6‐Y),
significant difference between C6‐YN2 and C6‐YN2 clopidogrel‐treated group. P < 0.05 as determined by anova, followed by Tukey–Kramer test.
Figure 4.
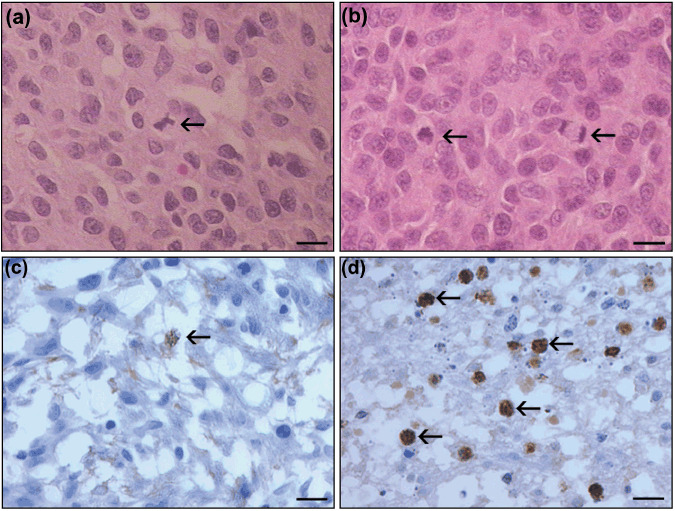
NTPDase2 expression increases C6 glioma proliferation in vivo. In vivo glioma proliferation was assessed by histological analysis of (a,b) HE staining and (c,d) immunohistochemical analysis of Ki67‐positive glioma cell nuclei. (a,c) C6‐EYPF glioma; (b,d) C6‐EYFP/NTPDase2 glioma. Arrows indicate mitotic cells. (d) C6‐EYFP‐NTPDase2 gliomas exhibit an increased number of Ki67‐positive cells when compared to (c) C6‐EYFP‐derived gliomas. The mitotic index analysis is presented in Table 1. Scale bars = 10 µm.
NTPDase2 expression in C6 glioma promotes platelet activation, angiogenesis, and induction of the inflammatory response. To examine the effect of NTPDase2 expression on platelet activation, cryostat sections from implanted gliomas were immunostained with a P‐selectin antibody (Fig. 5; Table 2). P‐selectin (CD62P) is present on the membrane of endothelial cells and platelets following cellular activation.( 22 , 23 ) C6‐EYFP/NTPDase2‐derived gliomas exhibited a higher platelet activation (70% ± 10) when compared to C6‐EYFP‐derived gliomas (10 ± 3%). Additionally, in C6‐EYFP/NTPDase2 gliomas, the activated platelets were associated with blood vessels and proliferating areas in the tumor periphery.
Figure 5.
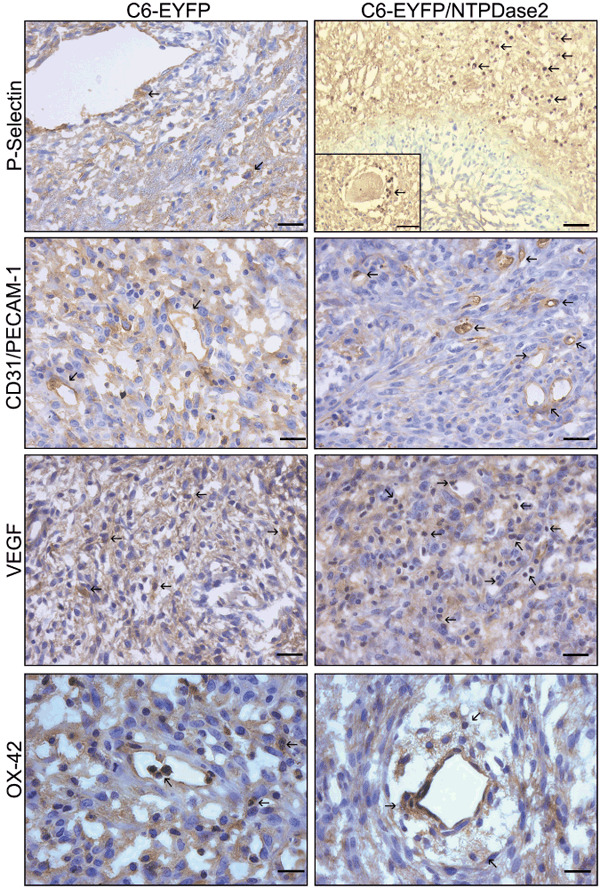
NTPDase2 expression promotes platelet activation, angiogenesis and inflammation on C6 gliomas in vivo. Immunohistochemistry analysis of C6‐EYFP‐ and C6‐EYFP/NTPDase2‐implanted gliomas. The immunopositivity is indicated by arrows for: P‐selectin (platelet activation; insert shows platelet aggregation around a blood vessel), CD31/PECAM‐1, vascular endothelial growth factor (VEGF) (vascular proliferation), and OX‐42 (microglial/macrophage cells). The C6‐EYFP/NTPDase2 gliomas exhibit an increased number of immunopositive cells for all markers when compared with C6‐EYFP gliomas. These differences were quantified and are presented in Table 2. Scale bars = 20 µm (P‐selectin; CD31/PECAM; VEGF), 10 µm (P‐selectin insert; OX‐42).
Table 2.
Immunohistochemical analysis of P‐selectin, CD31/PECAM‐1, VEGF and OX42 in implanted gliomas
| Markers | C6‐EYFP (n = 4) | C6‐EYFP/NTPDase2 (n = 4) | C6‐EYFP/NTPDase2 Clopidogrel (n = 5) |
|---|---|---|---|
| P‐selectin (%) | 10 ± 3 | 70 ± 10* | 20 ± 6 † |
| CD31 (blood vessels) | 4 ± 1 | 14 ± 2* | 3 ± 1 † |
| VEGF (%) | 70 ± 10 | 90 ± 5* | 70 ± 8 † |
| OX‐42 (%) | 40 ± 10 | 70 ± 10* | 50 ± 15 † |
Twenty days following glioma implantation, rats implanted with gliomas (C6, C6‐EYFP, C6‐EYFP/NTPDase2 or C6‐EYFP/NTPDase2 clopidogrel‐treated) were processed for immunohistochemical analysis. For CD31 quantification, each positive endothelial cell was counted as an individual vessel. The VEGF quantitative analysis was scored as percentage of immunoreactive cells. The P‐selectin and OX42 immunostaining were scored as the percentage of immunoreactive cells. All immunohistological evaluations were made in 10 independent high‐magnification (×200) fields, per glioma. Mean ± SD were performed on at least 4 animals per group. *Indicates significant difference between C6‐EYFP and C6‐EYFP/NTPDase2 implanted gliomas, †indicates significant difference between C6‐EYFP/NTPDase2 and C6‐EYFP/NTPDase2 clopidogrel‐treated group. P < 0.05 as determined by anova, followed by Tukey–Kramer test. VEGF, vascular endothelial growth factor.
Next, angiogenesis was evaluated by IHC for CD31/PECAM‐1 and VEGF (Fig. 5; Table 2). The re‐establishment of NTPDase2 in C6 glioma resulted in a 3.5‐fold increase in CD31‐positive microvessels in C6‐EYFP/NTPDase2‐derived gliomas when compared to C6‐EYFP gliomas (14.0 ± 2.0 and 4.0 ± 1.1 blood vessels respectively). Moreover, VEGF immunostaining was also increased in C6‐EYFP/NTPDase2 gliomas when compared to C6‐EYFP gliomas (90 ± 5 and 70 ± 10% respectively). The marked increase in these two markers corresponds to increased angiogenesis in C6‐EYFP/NTPDase2‐derived tumors in vivo.
To evaluate the involvement of the inflammatory response in the increased C6‐EYFP/NTPDase2 glioma malignance, immunostaining for OX‐42, a macrophages and microglial marker, was carried out (Fig. 5; Table 2). The results show that C6‐EYFP/NTPDase2‐derived gliomas exhibit increased macrophage/microglial activation when compared to C6‐EYFP gliomas (70 ± 10 and 40 ± 10% respectively). The activated macrophage/microglial cells were mainly associated with blood vessels.
Taken together, these data suggest that the ADP generated from NTPDase2‐mediated ATP hydrolysis, among other effects, may potentially be involved in platelet activation, angiogenic stimulation, and recruitment of inflammatory cells in an interrelated manner. Importantly, these events all play a crucial role in tumorigenesis.( 4 , 22 , 23 , 24 )
Involvement of ADP‐activated platelets in the malignity of gliomas expressing NTPDase2. Considering ADP is an important platelet activator, we tested whether platelet recruitment may contribute to the increased malignity of C6‐EYFP/NTPDase2‐derived gliomas. To test this hypothesis, Wistar rats implanted with C6‐EYFP/NTPDase2 glioma cells were treated with clopidogrel, which was administered daily over a period of 19 days. Clopidogrel is a P2Y12 receptor antagonist with anti‐platelet and anti‐aggregating properties.( 25 ) Treatment with clopidogrel markedly decreased the presence of malignant pathological characteristics and reduced the mitotic index and tumor size by 66% and 25%, respectively, when compared to C6‐EYFP/NTPDase2‐untreated animals (Fig. 6; Table 1). In addition, clopidogrel treatment decreased P‐selectin, CD31/PECAM‐1, VEGF, and OX‐42 expression to the levels observed in C6‐EYFP‐derived gliomas (Table 2). These data suggest that ADP‐mediated platelet activation plays an important role in the increased malignity of C6‐EYFP/NTPDase2‐derived gliomas.
Figure 6.
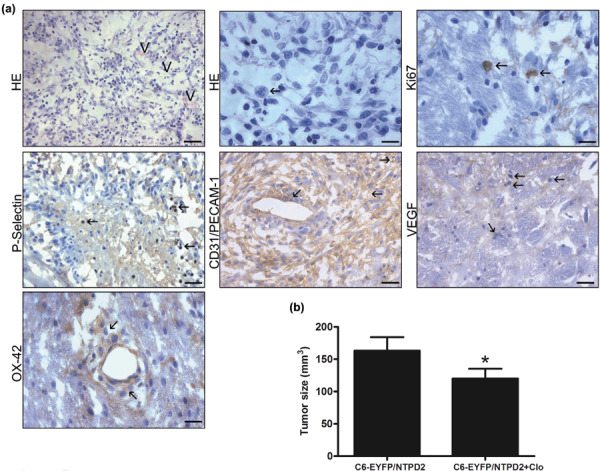
Clopidogrel treatment decreases the malignity of C6‐EYFP/NTPDase2 gliomas. One day after C6‐EYFP/NTPDase2 glioma implantation, clopidogrel was administered daily to rats for a period of 19 days. The animals were killed, glioma sections excised, and tumor malignancy was analyzed by (a) histology and immunohistochemistry and (b) tumor size. (a) Representative HE sections of C6‐EYFP/NTPDase2 of clopidogrel‐treated rats show a decrease in the glioma malignity when compared to C6‐EYFP/NTPDase2 tumors of untreated‐rats (Fig. 3b,d). Note that histological characteristics related to high malignity, such as intratumoral hemorrhage, necrosis, and peritumoral edema, were absent from clopidogrel‐treated rats. Vascular proliferation (V) and number of mitotic cells (arrows) were also decreased by clopidogrel treatment. The differences in histological characteristics were analyzed and are presented in Table 1. Arrows indicate the immunopositivity for: Ki67 (mitotic cells), P‐selectin (platelet activation), CD31/PECAM‐1, vascular endothelial growth factor (VEGF) (vascular proliferation) and OX‐42 (microglial/macrophage cells). These differences were quantified and are presented in Table 2. Scale bars = 20 µm (HE, CD31/PECAM‐1 and VEGF), 10 µm (mitotic cells, P‐selectin). (b) Tumor size quantification of rats with C6‐EYFP/NTPDase2‐derived gliomas untreated (C6‐EYFP/NTPD2) or treated with clopidogrel (C6‐EYFP/NTPD2+Clo). Data represent the mean ± SD of five animals per group. Data were analyzed by anova, followed by Tukey–Kramer post‐hoc test. *Significantly different from untreated C6‐EYFP/NTPDase2‐implanted rats (P < 0.05).
Discussion
The present work demonstrates a novel function of purinergic signaling in glioma growth and malignance in vivo. First, we evaluated the effect of NTPDase2 overexpression on in vitro cell proliferation. We observed that ectopic NTPDase2 expression did not affect cell proliferation or cell viability of C6 cells in culture. However, in an in vivo rat glioma model, NTPDase2 overexpression resulted in a dramatic increase of glioma cell growth and malignity when compared to controls. We further demonstrated that the presence of NTPDase2 at the surface of C6‐EYFP/NTPDase2 glioma cells increases the capacity of these tumors to recruit platelets and macrophages/microglia, most probably via activation of ADP‐dependent P2 receptors. Indeed, clopidogrel, a P2Y12 antagonist, strongly reduced the growth of tumors expressing NTPDase2.
Interestingly, we have previously shown that the co‐injection of apyrase (low ATP/ADPase ratio) in a C6 rat glioma experimental model markedly reduces glioma development,( 12 ) whereas the results of the present work indicate that NTPDase2 (high ATP/ADPase ratio) has the opposite effect. This inverse effect could be due to the fact that whereas NTPDase1 hydrolyses ATP and ADP approximately equally well, NTPDase2 has an increased preference for ATP over ADP as a substrate. Therefore, the enzymatic activity of NTPDase2 could favor extracellular ADP accumulation.( 7 , 8 ) Data from the literature show that extracellular ADP plays an important role in cell growth and inflammation in the central nervous system. For example, ADP has been implicated in eye development,( 26 ) endothelial cell migration,( 27 ) stem cell proliferation,( 28 ) and platelet activation.( 29 ) Additionally, there is strong evidence indicating that platelets play an important role in tumor progression and metastasis and regulate tumor cell invasion and angiogenesis.( 22 , 30 , 31 , 32 ) Considering that platelets express P2 receptors, which are activated by ADP (P2Y1 and P2Y12), we hypothesized that ADP produced by the NTPDase2 overexpressed in the implanted glioma cells could activate these receptors, leading to increased platelet recruitment and activation (Fig. 7). The latter processes promote angiogenesis as well as the recruitment of other inflammatory cells.( 22 ) In agreement with our hypothesis, C6‐EYFP/NTPDase2 gliomas exhibited a massive accumulation of platelets in the tumor area when compared to the control tumors. This effect was associated with increased expression of CD31/PECAM‐1 and VEGF, indicating an enhanced angiogenic response, as these proteins have been shown to stimulate endothelial cell proliferation and migration, and in vivo angiogenesis.( 33 , 34 ) It is important to note that angiogenesis can not only be stimulated by ADP generated by NTPDase2 present on C6‐EYFP/NTPDase2 gliomas but also by ADP secreted from activated platelets.( 29 )
Figure 7.
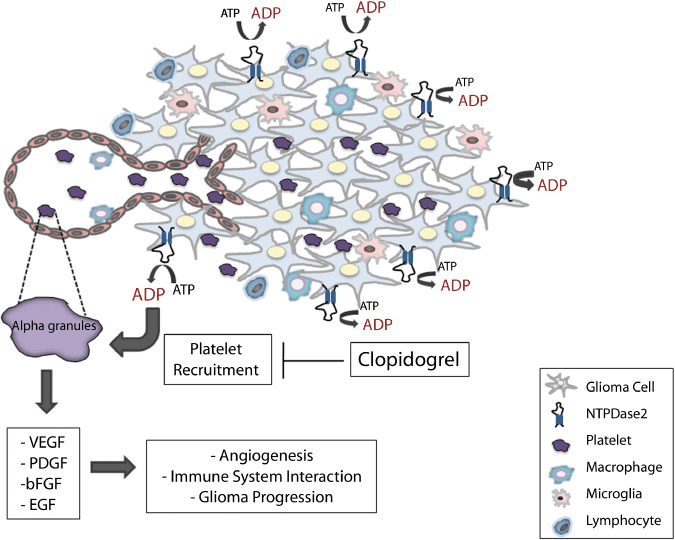
Possible pathways connecting NTPDase2 overexpression to ADP generation, platelet recruitment, and glioma progression. Overexpression of NTPDase2, due to its preference for ATP over ADP, would strongly favor ADP accumulation in the tumor periphery and vascular interface and consequently induce endothelial cell migration and platelet activation via ADP‐dependent P2Y receptors. Upon activation, platelets release a variety of substances from alpha‐granules, which stimulate angiogenesis, recruitment of immune cells, and tumor proliferation. In our experimental model, clopidogrel, a P2Y12 antagonist and inhibitor of ADP‐mediated platelet activation, markedly reduced glioma growth and angiogenesis. We hypothesize that the overexpression of NTPDase2 in glioma cells produces accumulating amounts of ADP around the tumor and this activates ADP‐dependent receptors on platelets, which may play an important role in the increased malignancy of C6‐EYFP/NTPDase2 gliomas. bFGF, basic fibroblast growth factor; EGF, epidermal growth factor; PDGF, platelet‐derived growth factor; VEGF, vascular endothelial growth factor.
In addition, we also demonstrated that the implanted C6‐EYFP/NTPDase2 gliomas contain more macrophage/microglial cells compared to the control tumors. We speculate that these cells are recruited to tumors by activated platelets. Indeed, recent reports have demonstrated that platelets are essential in the initiation of an inflammatory response( 35 ) and that the adhesive interactions between platelets, leukocytes, and cancer cells promote inflammation and metastasis.( 23 ) Additionally, macrophages/microglia present in large numbers in the implanted C6‐EYFP/NTPDase2 gliomas could further increase the capacity of these tumors to stimulate an inflammatory response, thus increasing the malignant characteristics of these gliomas. Similar to what was seen in this study, microglial cells have been repeatedly identified in brain tumors,( 4 ) and although the exact role of these cells in cancer progression remains unclear, studies suggest that they can promote or facilitate the inflammatory response by secreting cytokines and growth factors.( 4 ) Interestingly, some of these cytokines and growth factors can be secreted as a result of P2 receptor stimulation by extracellular nucleotides. For example, ATP stimulates microglia to release interleukin‐6 and interleukin‐10( 36 , 37 ) and ADP regulates the extension of microglial processes.( 38 )
In accordance with the role of ADP‐activated platelets in glioma progression, we observed that treatment with clopidogrel, a P2Y12 antagonist, markedly reduced tumor size, malignity characteristics, angiogenesis, and the inflammatory process in C6‐EYFP/NTPDase2‐derived gliomas to the levels observed for control gliomas. These results are in agreement with previous works defending the use of anticoagulants in cancer therapy to prevent platelet interaction with tumor vasculature( 39 , 40 ) and show that ADP‐activated platelets might be important players contributing to the increased malignity of C6‐EYFP/NTPDase2 gliomas (Fig. 7).
In conclusion, our results confirm the hypothesis that purinergic signaling is involved in the progression of gliomas in vivo. Additionally, our findings reveal a previously underestimated role for ADP in tumor promotion and reinforce the important roles carried out by the different E‐NTPDase members, which, by working in a highly coordinated enzymatic chain, maintain the extracellular nucleotide equilibrium and control the effects mediated by purinergic receptors. The data reported here point to the pharmacological modulation of P2 receptors as a novel therapeutic modality for the treatment of brain tumors in the future.
Acknowledgments
We thank N. Copetti, J.A. Lopes, and L.R. Blazina for their excellent technical assistance; Dr G. Guidotti for the pGW1‐hCD39L1 vector; and F. Kukulski and S.A. Lévesque for comments and corrections made on the manuscript. This work was supported by the Brazilian funding agencies: CNPq‐Brazil (Dr A.M.O. Battastini, E. Braganhol, A. Bernardi and D. Huppes); FIPE‐HCPA (Dr M.I.A. Edelweiss) and by NIH grants HL 57307 and HL 63972 (Dr S.C. Robson).
References
- 1. Stupp R, Hegi ME, Gilbert MR, Chakravarti A. Chemoradiotherapy in malignant glioma: standard of care and future directions. J Clin Oncol 2007; 25: 4127–36. [DOI] [PubMed] [Google Scholar]
- 2. Soffietti R, Leoncini B, Ruda R. New developments in the treatment of malignant gliomas. Expert Rev Neurother 2007; 7: 1313–26. [DOI] [PubMed] [Google Scholar]
- 3. Demuth Tand Berens ME. Molecular mechanisms of glioma cell migration and invasion. J Neurooncol 2004; 70: 217–28. [DOI] [PubMed] [Google Scholar]
- 4. Watters JJ, Schartner JM, Badie B. Microglia function in brain tumors. J Neurosci Res 2005; 81: 447–55. [DOI] [PubMed] [Google Scholar]
- 5. Burnstock G. Physiology and pathophysiology of purinergic neurotransmission. Physiol Rev 2007; 87: 659–797. [DOI] [PubMed] [Google Scholar]
- 6. White N, Burnstock G. P2 receptors and cancer. Trends Pharmacol Sci 2006; 27: 211–17. [DOI] [PubMed] [Google Scholar]
- 7. Zimmermann H. Ectonucleotidases: some recent developments and a note on nomenclature. Drug Dev Res 2001; 52: 44–56. [Google Scholar]
- 8. Robson SC, Sévigny J, Zimmermann H. The E‐NTPDase family of ectonucleotidases: Structure function relationship and pathophysiological significance. Purinergic Signal 2006; 2: 409–30. [DOI] [PMC free article] [PubMed] [Google Scholar]
- 9. Wink MR, Lenz G, Braganhol E et al . Altered extracellular ATP, ADP and AMP catabolism in glioma cell lines. Cancer Lett 2003; 198: 211–18. [DOI] [PubMed] [Google Scholar]
- 10. Morrone FB, Jacques‐Silva MC, Horn AP et al . Extracellular nucleotides and nucleosides induce proliferation and increase nucleoside transport in human glioma cell line. J Neurooncol 2003; 64: 211–18. [DOI] [PubMed] [Google Scholar]
- 11. Morrone FB, Horn AP, Stella J et al . Increased resistance of glioma cell lines to extracellular ATP cytotoxicity. J Neurooncol 2005; 71: 135–40. [DOI] [PubMed] [Google Scholar]
- 12. Morrone FB, Oliveira DL, Gamermann P et al . In vivo glioblastoma growth is reduced by apyrase activity in a rat glioma model. BMC Cancer 2006; 23: 226. [DOI] [PMC free article] [PubMed] [Google Scholar]
- 13. Takano T, Lin JH, Arcuino G, Gao K, Yang J, Nedergaard M. Glutamato release promotes growth of malignant gliomas. Nature Med 2001; 7: 1010–15. [DOI] [PubMed] [Google Scholar]
- 14. Wink MR, Braganhol E, Tamajusuku ASK et al . Nucleoside triphosphate diphosphohydrolase‐(NTPDase2/CD39L1) is the dominant ectonucleotidase expressed by rat astrocytes. Neuroscience 2006; 138: 421–32. [DOI] [PubMed] [Google Scholar]
- 15. Grinthal A, Guidotti G. Transmembrane domains confer different substrate specificities and adenosine diphosphate hydrolysis mechanisms on CD39, CD39L1 and chimeras. Biochemistry 2002; 41: 1947–56. [DOI] [PubMed] [Google Scholar]
- 16. Chan K, Delfert D, Junger KD. A direct colorimetric assay for Ca2+‐ATPase activity. Anal Biochem 1986; 157: 375–80. [DOI] [PubMed] [Google Scholar]
- 17. Bradford MM. A rapid and sensitive method for the quantification of microgram quantities of protein utilizing the principle of protein‐dye binding. Anal Biochem 1976; 72: 218–541. [DOI] [PubMed] [Google Scholar]
- 18. Weidner N. Current pathologic methods for measuring intratumoral microvessel density within breast carcinoma and other solid tumors. Breast Cancer Res Treat 1995; 36: 169–80. [DOI] [PubMed] [Google Scholar]
- 19. Cascinu S, Graziano F, Catalano V et al . Differences of vascular endothelial growth factor (VEGF) expression between liver and abdominal metastases from colon cancer. Implications for the treatment with VEGF inhibitors. Clin Exp Metastasis 2001; 18: 651–5. [DOI] [PubMed] [Google Scholar]
- 20. Kukulski F, Lévesque SA, Lavoie EG et al . Comparative hydrolysis of P2 receptor agonists by NTPDase 1, 2, 3 and 8. Purinergic Signal 2005; 1: 193–204. [DOI] [PMC free article] [PubMed] [Google Scholar]
- 21. Abbracchio MP, Burnstock G, Boeynaems JM et al . International Union of Pharmacology LVIII: update on the P2Y G protein‐coupled nucleotide receptors: from molecular mechanisms and pathophysiology to therapy. Pharmacol Rev 2006; 58: 281–341. [DOI] [PMC free article] [PubMed] [Google Scholar]
- 22. Sierko E, Wojtukiewicz MZ. Inhibition of platelet function: does it offer a chance of better cancer progression control? Semin Thromb Hemost 2007; 33: 712–21. [DOI] [PubMed] [Google Scholar]
- 23. Chen M, Geng JG. P‐selectin mediates adhesion of leukocytes, platelets, and cancer cells in inflammation, thrombosis, and cancer growth and metastasis. Arch Immunol Ther Exp (Warsz) 2006; 54: 75–84. [DOI] [PubMed] [Google Scholar]
- 24. Verheul HM, Jorna AS, Hoekman K, Broxterman HJ, Gebbink MF, Pinedo HM. Vascular endothelial growth factor‐stimulated endothelial cells promote adhesion and activation of platelets. Blood 2000; 96: 4216–21. [PubMed] [Google Scholar]
- 25. Savi P, Labouret C, Delesque N, Guette F, Lupker J, Herbert JM. P2y(12), a new platelet ADP receptor, target of clopidogrel. Biochem Biophys Res Commun 2001; 283: 379–83. [DOI] [PubMed] [Google Scholar]
- 26. Masse K, Bhamra S, Eason R, Dale N, Jones EA. Purine‐mediated signaling triggers eye development. Nature 2007; 449: 1058–2. [DOI] [PubMed] [Google Scholar]
- 27. Shen J, DiCorleto PE. ADP Stimulates human endothelial cell migration via P2Y1 nucleotide receptor‐mediated mitogen‐activated protein kinase pathways. Circ Res 2008; 102: 448–56. [DOI] [PubMed] [Google Scholar]
- 28. Mishra SK, Braun N, Shukla V et al . Extracellular nucleotide signaling in adult neural stem cells: synergism with growth factor‐mediated cellular proliferation. Development 2006; 133: 675–84. [DOI] [PubMed] [Google Scholar]
- 29. Gachet C. P2 receptors, platelet function and pharmacological implications. Thromb Haemost 2008; 99: 466–72. [DOI] [PubMed] [Google Scholar]
- 30. Möhle R, Green D, Moore MA, Nachman RL, Rafii S. Constitutive production and thrombin‐induced release of vascular endothelial growth factor by human megakaryocytes and platelets. Proc Natl Acad Sci USA 1997; 21: 663–8. [DOI] [PMC free article] [PubMed] [Google Scholar]
- 31. Pinedo HM, Verheul HM, D’Amato RJ, Folkman J. Involvement of platelets in tumour angiogenesis? Lancet 1998; 352: 1775–7. [DOI] [PubMed] [Google Scholar]
- 32. Folkman J. Angiogenesis in cancer, vascular, rheumatoid and other diseases. Nat Med 1995; 1: 27–31. [DOI] [PubMed] [Google Scholar]
- 33. Pipili‐Synetos E, Papadimitriou E, Maragoudakis ME. Evidence that platelets promote tube formation by endothelial cells on matrigel. Br J Pharmacol 1998; 125: 1252–7. [DOI] [PMC free article] [PubMed] [Google Scholar]
- 34. Kisucka J, Butterfield CE, Duda DG et al . Platelets and platelet adhesion support angiogenesis while preventing excessive hemorrhage. Proc Natl Acad Sci USA 2006; 103: 855–60. [DOI] [PMC free article] [PubMed] [Google Scholar]
- 35. Sprague DL, Sowa JM, Elzey BD, Ratliff TL. The role of platelet CD154 in the modulation in adaptive immunity. Immunol Res 2007; 39: 185–93. [DOI] [PubMed] [Google Scholar]
- 36. Shigemoto‐Mogami Y, Koizumi S, Tsuda M, Ohsawa K, Kohsaka S, Inoue K. Mechanisms underlying extracellular ATP‐evoked interleukin‐6 release in mouse microglial cell line, MG‐5. J Neurochem 2001; 78: 1339–49. [DOI] [PubMed] [Google Scholar]
- 37. Seo DR, Kim SY, Kim KY et al . Cross talk between P2 purinergic receptors modulates extracellular ATP‐mediated interleukin‐10 production in rat microglial cells. Exp Mol Med 2008; 40: 19–26. [DOI] [PMC free article] [PubMed] [Google Scholar]
- 38. Haynes SE, Hollopeter G, Yang G et al . The P2Y12 receptor regulates microglial activation by extracellular nucleotides. Nat Neurosci 2006; 9: 1512–19. [DOI] [PubMed] [Google Scholar]
- 39. Chiodoni C, Lezzi M, Guiducci C et al . Triggering CD40 on endothelial cells contributes to tumor growth. J Exp Med 2006; 203: 2441–50. [DOI] [PMC free article] [PubMed] [Google Scholar]
- 40. Gerotziafas GT, Papageorgiou C, Hatmi M, Samama MM, Elalamy I. Clinical studies with anticoagulants to improve survival in cancer patients. Pathophysiol Haemost Thromb 2008; 36: 204–11. [DOI] [PubMed] [Google Scholar]