

Abstract
(Cancer Sci 2010; 101: 639–645)
Gastric cancers show high frequency of DNA aneuploidy, a phenotype of chromosomal instability. It is suggested that the abnormal spindle assembly checkpoint is involved in DNA aneuploidy, but the underlying mechanism is still unclear. We studied the mechanism by assessing the expression of BUBR1 in gastric cancer. The DNA ploidy patterns of 116 gastric cancer samples obtained from the Department of Surgery and Science at Kyushu University Hospital were analyzed. Of those, DNA aneuploidy was seen in 70 (60.3%) cases of gastric cancer. The expression of BUBR1 was studied by immunohistochemistry in 181 gastric cancer samples and by real‐time RT‐PCR in several gastric cancer cell lines. Ninety‐one (50.3%) cases had high expression of BUBR1 and those cases correlated significantly with DNA aneuploidy (P < 0.05). Also high expression of BUBR1 cases had significant correlation with deep invasion, lymph node metastasis, liver metastasis, and poor prognosis. In gastric cancer cell lines, high expression of BUBR1 had a significant relationship with DNA aneuploidy (P < 0.05). Then, gastric cancer cell lines MKN‐28 and SNU‐1 were transfected with full‐length BUBR1 to observe the significance of the change in BUBR1 expression. Enforced expression of BUBR1 resulted in changes to the ploidy pattern and high Ki‐67 expression. Collectively, our clinical and in vitro data indicate that high expression of BUBR1 may be one of causative factors for the induction of DNA aneuploidy and progression of gastric cancer.
DNA aneuploidy is a state of cells with an abnormal number of chromosomes. More than a century ago, David Paul Hansemann observed that cancer cells have abnormal chromosome numbers.( 1 ) In 1997, Lengauer et al. reported that DNA aneuploidy was seen in 85% of colorectal cancers.( 2 ) This form of chromosomal instability reflected a continuing cellular defect that persisted throughout the lifetime of the cancer cell and was independent from microsatellite instability which was a recessive trait. DNA aneuploidy is an important phenomenon for cancer cells; however, whether or not DNA aneuploidy may be a cause for carcinogenesis is still controversial. To date many analyses have focused on DNA aneuploidy and it is now known that mutation or inactivation in p53, ‘the guardian of genome’, results in DNA aneuploidy.( 3 , 4 )
Recently, it has been defined that DNA aneuploidy occurs due to disorders in the spindle assembly checkpoint.( 5 ) This checkpoint is the mechanism which delays the separation of sister chromatids until all the kinetochores of chromosomes are correctly attached to the spindle.( 6 ) It has been reported that knockdown or overexpression of spindle assembly checkpoint molecules resulted in DNA aneuploidy and carcinogenesis in mice.( 7 ) The disorders in spindle assembly checkpoint molecules may be involved in DNA aneuploidy and carcinogenesis in humans.
BUBR1 kinase, a member of the BUB (budding uninhibited by benzimidazole) gene family, is one of the key molecules in the spindle assembly checkpoint. It accumulates on the unattached kinetochore.( 8 ) BUBR1 targets Cdc20, an APC/C (anaphase promoting complex/cyclosome; E3 ubiquitin ligase) activator, and prevents the premature onset of anaphase.( 9 , 10 ) The degradation of Cdc20 represents a critical control mechanism ensuring the inactivation of APC/C in response to the spindle assembly checkpoint.( 11 ) In addition, BUBR1 independently interacts with securin.( 12 ) Matsuura et al. reported that a mutation in the BUBR1 gene is detected in premature chromatid separation (PCS) syndrome, which has been often associated with chromosomal instability and malignancies. Furthermore, an abnormal spindle assembly checkpoint was observed in this syndrome.( 13 , 14 )
Although mutations of BUBR1 have been rarely observed in clinical samples,( 15 , 16 ) high expression of BUBR1 has often been reported in several malignancies and correlated with chromosomal instability,( 17 , 18 , 19 ) but not thus far in gastric cancer.
Herein, we report the significance of DNA aneuploidy and BUBR1 high expression in gastric cancer by analyzing gastric cancer clinical samples and cell lines.
Material and Methods
Patients studied. This study included 181 unselected Japanese patients with primary gastric cancer, all of whom underwent a gastrectomy between 1994 and 2006 at the Department of Surgery and Science, Graduate School of Medical Sciences, Kyushu University Hospital, Fukuoka. They included 121 men and 60 women, ranging in age from 29 to 90 years (mean, 64.2 years). In each case, a careful informed consent was obtained. Those who refused were not included. A thorough histological examination was made by using H&E‐stained tissue preparations, and the histological classification was made according to the general rules set up by the Japanese Gastric Cancer Association.( 20 ) No patient treated preoperatively with cytotoxic drugs was included in this study.
Immunohistochemical staining of BUBR1. Formalin‐fixed, paraffin‐embedded tissue specimens were used for immunohistochemical staining. A paraffin block which contained both cancerous tissue, invading the deepest area of the stomach wall, and adjacent noncancerous tissue, was used in each case. Immunohistochemical staining was done as described in previous reports.( 19 , 21 , 22 ) Briefly, the sections were pretreated with autoclaving (121°C) for 15 min in 0.01 mol/L citrate‐buffered saline (pH 6.0) for antigen retrieval. Endogenous peroxidase activity was blocked by incubation with 0.3% H2O2 for 10 min. The sections were incubated with mouse monoclonal antibodies against BUBR1 (Clone 9, 1:100; BD Transduction Laboratories, San Jose, CA, USA) at 4°C overnight. Streptavidin–biotin complex and horseradish peroxidase were applied, and the reaction products were visualized using the Histofine SAB‐PO (M) immunohistochemical staining kit (Nichirei, Tokyo, Japan), according to the manufacturer’s instructions. Two blinded observers (K.A. and Y.Z.) independently examined immunostained sections. The intensity of cytoplasmic staining of BUBR1 was scored on a three‐point scale in comparison to the staining of lymph follicles which were equally stained in all 181 specimens. Weaker staining was scored 0, and similar and stronger than the follicle were scored 1 and 2, respectively.
Analysis for DNA ploidy. Nuclear DNA content was measured by using laser scanning cytometry (LSC; CompuCyte, Westwood, MA, USA) as described previously.( 23 , 24 ) The same paraffin‐embedded blocks that were used for immunohistochemical staining were used for this analysis. A DNA content histogram was generated and DNA ploidy was determined. DNA index (DI) was calculated according to previously published principles.( 25 , 26 ) For every case, the nuclei were observed after each scan to exclude debris and attached nuclei from the analysis. The DI of G0/G1‐phase lymphocyte or fibroblasts were used as a reference of DI = 1.0. Tumors with a DI < 1.2 were defined as diploid; DI ≧ 1.2 or multi‐indexed samples were defined as aneuploid.
High‐resolution fluorescent microsatellite analysis (HRFMA) for MSI. HRFMA has been described in detail elsewhere.( 27 ) Briefly, genomic DNA isolated from cancerous and corresponding noncancerous tissue specimens was used to amplify microsatellite loci by polymerase chain reaction (PCR) using primer sets labeled with a fluorescent compound, ROX (6‐carboxy‐x‐rhodamine) or HEX (6‐carboxy‐20,40,70,4,7,‐hexachrolo‐fluorescein). The fluorescently labeled PCR products were mixed, denatured, and loaded onto an ABI 310 sequencer (Applied Biosystems, Foster City, CA, USA) for fragment analysis. The data were processed using the GeneScan software package (Applied Biosystems). An alternation in the length of a microsatellite PCR fragment from cancerous tissues was defined as MSI positive. According to the guidelines established by the National Cancer Institute (NCI), MSI was defined by the frequency of positive findings of five reference markers: D2S123, D5S107, D10S197, D11S904, D13S175.( 28 ) MSI status was classified as follows: microsatellite instability high (MSI‐H), >30% of loci demonstrate MSI; microsatellite instability low, ≤30% of loci demonstrate MSI; and microsatellite stability, no positive MSI detected in any of the loci. MSI‐H was labeled ‘MSI (+)’ and the rest ‘MSI (–)’.
TP53 gene mutation analysis. The TP53 gene exon 5 to exon 9 including exon–intron junctions were amplified by PCR using p53 primers (Nippon Gene, Tokyo, Japan) and Ex Taq DNA polymerase with 3′ exonuclease activity (Takara Bio, Tokyo, Japan). The PCR products were purified and used as templates for cycle‐sequencing reactions with the Big Dye Terminator Cycle Sequencing Kit version 1 (Applied Biosystems). Mutations found in a PCR product were verified by reverse sequencing and reconfirmed in two independently amplified PCR products.
Gastric cancer cell lines and cell culture. Human gastric cancer cell lines MKN‐28 (JCRB0253), MKN‐74 (JCRB0255), SNU‐1 (CRL‐5971), SNU‐16 (CRL‐5974), NUGC‐4 (JCRB0834), KATO III (JCRB0611), NCI‐N87 (CRL‐5822), and human fibroblast MRC‐5 (CCL‐171) were grown in monolayer cultures in RPMI‐1640 supplemented with fetal bovine serum (10% v/v) and glutamine (2 mm) at 37°C in a 5% CO2 environment. MKN‐28, MKN‐74, NUGC‐4, and KATO III were obtained from the Japanese Cancer Research Resource Bank (JCRB). SNU‐1, SNU‐16, NCI‐N87, and MRC‐5 were obtained from ATCC (Manassas, VA, USA). In this experiment, cell lines were used between passage 3 and passage 6.
Analysis for DNA ploidy in gastric cancer cell lines. Each of the cell lines were incubated in four‐well chamber slide glasses. MRC‐5 was grown in one of the chambers as a normal control. When they reached 80% confluence, generally after 3 days, the media were changed to serum‐free medium for serum starvation.( 29 ) After 48 h of serum starvation, the slides were fixed in 70% ethanol and stained with propidium iodide (PI) (25μg/mL) including RNaseA (10 mg/mL). DNA ploidy was analyzed in LSC. The DNA index of the G0/G1 phase of MRC‐5 (normal human fibroblast cell line) was used as reference of DI = 1.0. Cell lines with a DI < 1.2 were defined as diploid; DI ≧ 1.2 or multi‐indexed cell lines were defined as aneuploid.
Quantification of the mRNA of gastric cancer cell lines using real‐time quantitative RT‐PCR. The pellets of each of the gastric cancer cell lines were homogenized. Total RNA was isolated using an RNeasy mini kit (Qiagen, Chatsworth, CA, USA) according to the manufacturer’s instructions. cDNA was synthesized with random hexamer primers and Superscript III reverse transcriptase according to manufacturer’s instructions and the product was used for further analysis. BUBR1 transcription was quantified using the LightCycler (Roche Molecular Biochemicals, Mannheim, Germany) PCR protocol, in which fluorescence emission is attributable to binding of SYBR Green I dye to amplified products and can be detected and measured essentially. The relative quantitation value is expressed as 2–Ct, where Ct is the difference between the mean Ct value of triplicates of the sample and of the endogenous β‐actin control. The primer sequences for Real‐time RT‐PCR were as follows: BUBR1, 5′‐CTCGTG‐GCAATACAGCTTCA‐3′ (forward) and 5′‐CTGGTCAATAG‐CTCGGCTTC‐3′ (reverse);( 30 ) Ki‐67, 5′‐ACTTGCCTCCTAAT‐ACGCC‐3′ (forward) and 5′‐TTACTACATCTGCCCATGA‐3′ (reverse);( 31 ) and β‐actin, 5′‐CCACGAAACTACCTTCAAC‐3′ (forward) and 5′‐GATCTTCATTGTGCTGGG‐3′ (reverse).
BUBR1 transfection to MKN‐28 and SNU‐1. Gastric cancer cell lines MKN‐28 and SNU‐1 were transfected with pcDNA3.1 + BUBR1 or pcDNA3.1 + vector alone using FuGene HD (Roche Diagnostics, Indianapolis, IN, USA) as a transfection vehicle. The transfectants (MKN‐28 Mock, MKN‐28 BUBR1, SNU‐1 Mock, and SNU‐1 BUBR1) were selected by addition of G418 (200 μg/mL) to the culture medium.
Western blotting. Cells were lysed in a sodium dodecyl sulfate (SDS)‐sample buffer containing 10% glycerol, 5%β‐mercaptoethanol, 2.3% SDS, and 62.5 mm Tris‐HCl (pH6.8). Ten μg of protein was analysed by SDS‐PAGE followed by Western blotting. The protein blots were first probed with a mouse anti‐BUBR1 (Clone 9, 1:1000; BD Transduction Laboratories) antibody or a mouse anti‐β‐actin (Clone AC‐15, 1:2000; Sigma‐Aldrich, St. Louis, MO, USA) antibody, and then with a goat‐antimouse IgG conjugated with horseradish peroxidase. The specific signals on the blot were detected by the enhanced chemiluminescent method.
Growth curve assay. MKN‐28 Mock and MKN‐28 BUBR1 were plated in triplicate at a density of 1 × 10⁵ cells per dish in 6‐cm culture dishes. At the indicated time points after plating, cells were trypsinized, stained with Trypan blue, and the number of viable cells was directly scored by using the hemocytometer.
Statistical analysis. The statistical analysis was performed by using the JMP 6.0 statistical software package (SAS Institute, Cary, NC, USA). The Student’s t‐test, the χ2‐test, Fisher’s exact test, and anova one‐way test were used where appropriate. The Kaplan–Meier analysis was used for overall survival.
Results
DNA ploidy in gastric cancer. The DNA ploidy patterns of 116 gastric cancer patients were analyzed by LSC. Of those, 70 (60.3%) showed DNA aneuploidy, which was consistent with a previous report.( 32 )
As is shown in Table 1, DNA aneuploid tumors were significantly correlated with differentiated tumors (P < 0.01). This result was consistent with a previous report on DNA ploidy in gastric cancer.( 33 ) In this study, we defined papillary and tubular adenocarcinoma as differentiated tumors and poorly differentiated adenocarcinoma and signet‐ring cell carcinoma as undifferentiated tumors.( 20 ) Mucinous carcinoma was included in undifferentiated tumors. Also, DNA aneuploid tumors had more positive vascular involvement than diploid tumors (P < 0.05). TP53 gene mutation and MSI statuses were also analyzed in the same gastric cancer samples. TP53 gene mutation was analyzed in 84 patients and 20 (23.8%) had mutations. MSI status was analyzed in 116 patients and 12 (10.3%) were MSI (+). DNA aneuploidy significantly correlated with TP53 gene mutation (P < 0.05), whereas MSI (+), a maker for microsatellite stability, was reversely correlated (P < 0.05; Table 2).
Table 1.
DNA ploidy and clinicopathological factors in gastric cancer
| Factors | DNA ploidy | P‐values | |
|---|---|---|---|
| Diploidy (n = 46) | DNA aneuploidy (n = 70) | ||
| Age (mean ± SD) | 61.9 ± 13.9 | 65.8 ± 11.3 | 0.116 |
| Gender | |||
| Male | 30 (65.2) | 49 (70.0) | 0.589 |
| Female | 16 (34.8) | 21 (30.0) | |
| Differentiation | |||
| Differentiated | 14 (30.4) | 41 (59.4) | 0.002* |
| Undifferentiated | 32 (69.6) | 28 (40.6) | |
| Depth of invasion | |||
| M, SM | 7 (15.2) | 8 (11.4) | 0.554 |
| MP, SS, SE, SI | 39 (84.8) | 62 (88.6) | |
| Vascular involvement | |||
| Negative | 34 (73.9) | 37 (53.6) | 0.026** |
| Positive | 12 (26.1) | 32 (46.4) | |
| Lymph node metastasis | |||
| Negative | 15 (32.6) | 14 (20.0) | 0.127 |
| Positive | 31 (67.4) | 56 (80.0) | |
| Liver metastasis | |||
| Negative | 45 (97.8) | 67 (95.7) | 0.53 |
| Positive | 1 (2.2) | 3 (4.3) | |
| Stage | |||
| I | 13 (28.3) | 12 (17.1) | 0.351 |
| II | 7 (15.2) | 13 (18.6) | |
| III | 7 (15.2) | 18 (25.7) | |
| IV | 19 (41.3) | 27 (38.6) | |
The values in parentheses are expressed in %. *P < 0.01, **P < 0.05. M, mucosa; MP, muscularis propria; SE, penetration of serosa; SI, invasion of adjacent structures; SM, submucosa; SS, subserosa.
Table 2.
DNA ploidy and genetic factors in gastric cancer
| Factors | DNA ploidy | P‐values | |
|---|---|---|---|
| Diploidy | Aneuploidy | ||
| TP53 status | |||
| Wild | 27 (90.0) | 37 (68.5) | 0.019* |
| Mutation | 3 (10.0) | 17 (31.5) | |
| MSI status | |||
| MSI (−) | 38 (82.6) | 66 (94.3) | 0.045* |
| MSI (+) | 8 (17.4) | 4 (5.7) | |
The values in parentheses are expressed in %. *P < 0.05. MSI, microsatellite instability.
High expression of BUBR1 in gastric cancer correlated with malignant features in gastric cancer. Abnormal spindle assembly checkpoint is suggested to be one of the major causes for DNA aneuploidy.( 34 ) BUBR1 is one of the factors in this checkpoint and its high expression is predicted to correlate with DNA aneuploidy.( 18 , 19 ) Therefore, BUBR1 expression was investigated by immunohistochemistry in 181 gastric cancer samples. The BUBR1 was mainly expressed in the cytoplasm in the tumor cells (Fig. 1). In the normal gastric epithelium, BUBR1 was expressed only in the mitosis (Fig. 1a, arrow pointed cells). This was seen in all 181 cases. These cells whose intensity of staining was similar to the lymph follicle were scored 1 (Fig. 1b); this was used as the inner control. Based on BUBR1 expression in the normal gastric epithelium which was scored 1, BUBR1 was considered to be highly expressed in gastric cancer when score 2 expression was seen (Fig. 1d), and the others as low expression (Fig. 1c).
Figure 1.
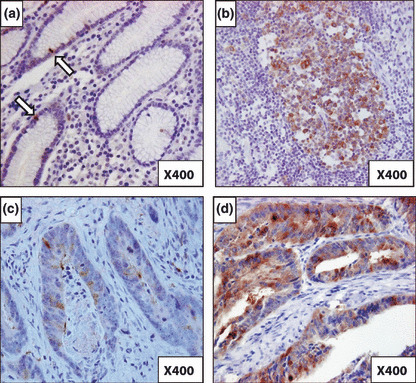
Immunohistochemical staining of BUBR1 in gastric cancer. (a) BUBR1 staining in normal epithelium. Arrows show the mitotic cells whose BUBR1 staining is scored 1 (magnification, ×400). (b) BUBR1 staining in lymph follicle. BUBR1 score 1 expression was based on this intensity of BUBR1 staining (magnification, ×400). (c) BUBR1 staining in gastric cancer cells. This shows the BUBR1 score 1 expression (magnification, ×400). (d) BUBR1 staining in gastric cancer cells. This shows the BUBR1 score 2 expression, which indicates high expression of BUBR1 (magnification, ×400).
BUBR1 score 2 expression was observed in 91 (50.3%) of the 181 patients.
Table 3 shows the relationship between the clinicopathological features and expression level of BUBR1 in patients with gastric cancer. The tumors with BUBR1 score 2 expression showed deeper invasion than those with a lower BUBR1 expression level (P < 0.01). Furthermore, the BUBR1 highly expressing tumors had more lymph node and liver metastases (P < 0.01 and P < 0.05, respectively). No difference was seen between BUBR1 score 0 expression and score 1 expression in gastric cancer.
Table 3.
BUBR1 expression and clinicopathological factors in gastric cancer
| Factors | BUBR1 expression level | P‐values | |
|---|---|---|---|
| Score 0,1 (n = 90) | Score 2 (n = 91) | ||
| Age (mean ± SD) | 62.5 ± 13.1 | 65.8 ± 10.5 | 0.053 |
| Gender | |||
| Male | 60 (66.7) | 61 (67.0) | 0.958 |
| Female | 30 (33.3) | 30 (33.0) | |
| Differentiation | |||
| Differentiated | 35 (38.9) | 44 (48.9) | 0.176 |
| Undifferentiated | 55 (61.1) | 46 (51.1) | |
| Depth of invasion | |||
| M, SM | 17 (18.9) | 5 (5.5) | 0.004* |
| MP, SS, SE, SI | 73 (81.1) | 86 (94.5) | |
| Vascular involvement | |||
| Negative | 53 (58.9) | 49 (54.4) | 0.547 |
| Positive | 37 (41.1) | 41 (45.6) | |
| Lymph node metastasis | |||
| Negative | 38 (42.2) | 20 (22.0) | 0.002* |
| Positive | 52 (57.8) | 71 (78.0) | |
| Liver metastasis | |||
| Negative | 89 (98.9) | 85 (93.4) | 0.044** |
| Positive | 1 (1.1) | 6 (6.6) | |
| Stage | |||
| I | 27 (30.0) | 16 (17.6) | 0.246 |
| II | 18 (20.0) | 20 (22.0) | |
| III | 20 (22.2) | 22 (24.2) | |
| IV | 25 (27.8) | 33 (36.3) | |
| DNA ploidy | |||
| Diploidy | 28 (60.9) | 18 (39.1) | 0.012** |
| Aneuploidy | 26 (39.1) | 44 (62.9) | |
The values in parentheses are expressed in %. *P < 0.01, **P < 0.05. M, mucosa; MP, muscularis propria; SE, penetration of serosa; SI, invasion of adjacent structures; SM, submucosa; SS, subserosa.
DNA aneuploidy and BUBR1 expression had a significant relationship in gastric cancer. The relationship between the DNA ploidy pattern and BUBR1 expression level in gastric cancers was analyzed. The result is shown in the lower part of Table 3. Tumors with BUBR1 score 2 expression showed a significant correlation with DNA aneuploidy (P < 0.05). Not only TP53 gene mutation but also high BUBR1 expression seemed to be an important factor for DNA aneuploidy in gastric cancer.
High expression of BUBR1 correlated with poor survival. Figure 2 shows the survival curve for patients according to expression levels of BUBR1. Patients with BUBR1 score 2 expression tumors had a significantly lower survival rate compared to patients with score 0 or 1 tumors (P < 0.05). A multivariate Cox regression analysis showed that the BUBR1 expression level was not an independent prognostic factor. This may be because in tumors with BUBR1 score 2 expression, there was a significant relationship between tumor depth and lymph node metastasis, which were strong independent prognostic factors (data not shown).
Figure 2.
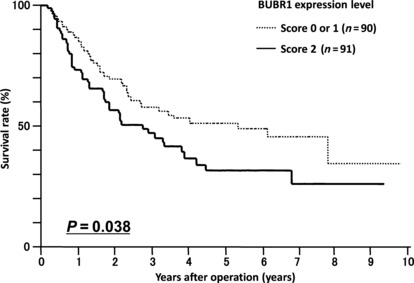
Survival curve for patients with gastric cancer in relation to BUBR1 expression. Patients with BUBR1 score 2 tumors (n = 91) had a poorer survival rate compared to those with BUBR1 score 0 or 1 tumors (n = 90, P = 0.038).
High expression of BUBR1 correlated with DNA aneuploidy in gastric cancer cell lines. Next we examined the relationship between DNA ploidy and BUBR1 expression in gastric cancer cell lines. First, the DNA ploidy patterns of gastric cancer cell lines were analyzed. Growing cells on four‐well chamber slide glass made it easier to compare the DNA index of gastric cancer cell lines with that of MRC‐5 which was used as a normal control. LSC demonstrated that the gastric cancer cell lines MKN‐28, MKN‐74, NUGC‐4, KATO III, and SNU‐16 were aneuploid cell lines. SNU‐1 and NCI‐N87 (and also MRC‐5) were diploid cell lines. The DNA ploidy patterns of KATO III, SNU‐16, SNU‐1, and NCI‐N87 were the same as those shown in the ATCC cell bank information (http://www.atcc.org/).
The expression levels of BUBR1 in these cell lines were examined by real‐time quantitative RT‐PCR (Fig. 3a). High expression of BUBR1 was seen in MKN‐28, MKN‐74, and SNU‐16 which were all aneuploid cell lines. A statistical analysis showed that aneuploid gastric cancer cell lines had significantly higher expression of BUBR1 compared to diploid cell lines (Fig. 3b).
Figure 3.
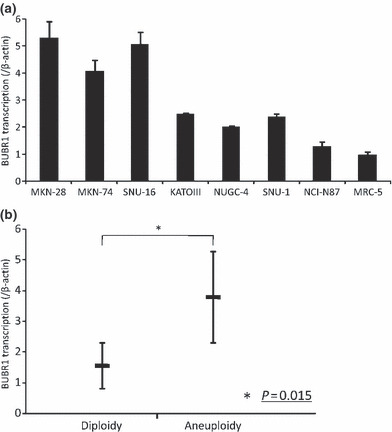
DNA ploidy and BUBR1 expression in cell lines. (a) BUBR1 expression in cell lines. BUBR1 expression was determined by real‐time RT‐PCR. The bar indicates the SD. (b) Statistical analysis in BUBR1 expression and DNA ploidy in cell lines. DNA aneuploidy cell lines had significantly higher BUBR1 expression levels (P = 0.015).
Enforced expression of BUBR1 in gastric cancer cell lines led to a change in DNA ploidy pattern and high proliferation activity. Then we investigated whether or not high expression of BUBR1 would be a cause for changes to the DNA ploidy pattern.
We transfected gastric cancer cell line MKN‐28 and diploid gastric cancer cell line SNU‐1 with pcDNA3.1(+)‐BUBR1 and an empty vector as a mock. As is shown in Figure 4a, the transfection was successful.
Figure 4.
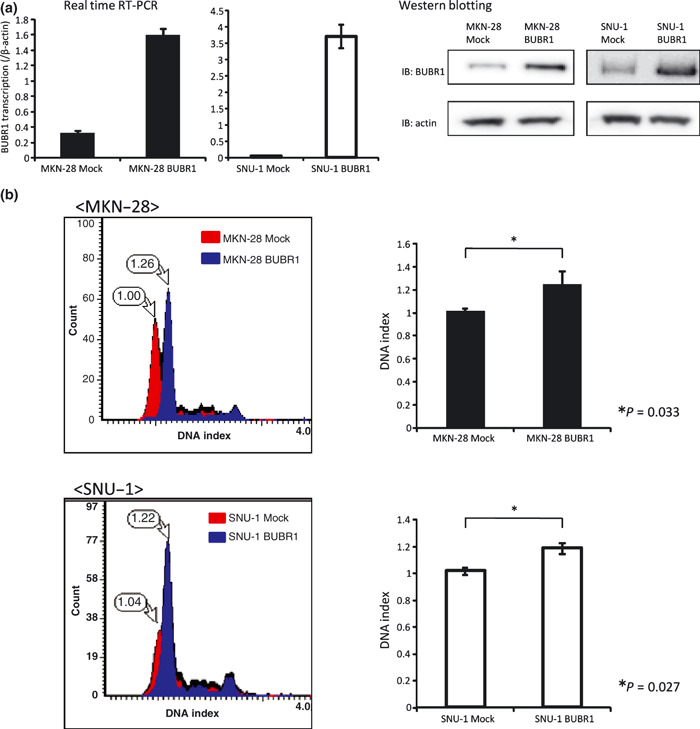
Enforced expression of BUBR1 in gastric cancer cell lines led to a change in DNA ploidy pattern. (a) Establishing BUBR1 highly expressed gastric cancer cell line MKN‐28 and SNU‐1. The expression levels of BUBR1 in the mock cells and BUBR1‐enforced cells were investigated by real‐time RT‐PCR and Western blotting. High expression of BUBR1 can be seen in BUBR1‐enforced cells at both the mRNA and protein level. (b) DNA ploidy pattern change in BUBR1 highly expressed cells. The DNA ploidy patterns were investigated by laser scanning cytometry. The DNA indexes of the mock cells were determined as 1.0. The change in DNA ploidy pattern can be seen in MKN‐28 BUBR1 and SNU‐1 BUBR1. Also the DNA index was significantly changed in MKN‐28 BUBR1 and SNU‐1 BUBR1 compared to the mock cells (right panel, P = 0.033 and P = 0.027, respectively).
The DNA ploidy patterns of these cells were analyzed with LSC. The DNA indexes of the mock cells were referred as 1.0. As seen in Figure 4b , the DNA indexes of MKN‐28 BUBR1 and SNU‐1 BUBR1 were increased significantly compared to the mock cells. This result meant that the DNA ploidy pattern had changed in MKN‐28 BUBR1 and SNU‐1 BUBR1.
We also counted the cell numbers of MKN‐28 BUBR1 and MKN‐28 Mock to investigate the growth activity. As is shown in Figure 5a , MKN‐28 BUBR1 had higher growth activity compared to MKN‐28 Mock. Also, in MKN‐28 BUBR1 and SNU‐1 BUBR1 the expression of Ki‐67 was higher than in the mock cells (Fig. 5b).
Figure 5.
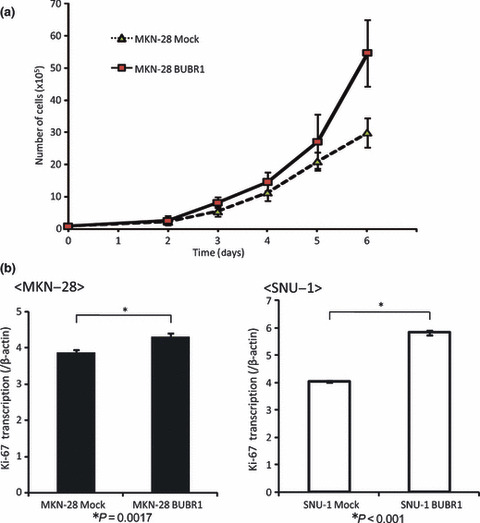
High expression of BUBR1 had high proliferation activity in gastric cancer cell lines. (a) The growth curve of MKN‐28 Mock and MKN‐28 BUBR1. MKN‐28 BUBR1 had higher growth activity. (b) Ki‐67 expression in mock cells and BUBR1 highly expressed cells. Ki‐67 expression was determined by real‐time RT‐PCR. Higher expression of Ki‐67 was seen in BUBR1 highly expressed cells.
Discussion
In the current study, genomic instability was associated with DNA aneuploidy; and the chromosomal instability pathway seemed to be important in gastric carcinogenesis. Chromosomal instability and microsatellite instability pathways are reported to be exclusive in colorectal cancers.( 2 ) However, in gastric cancer, both DNA aneuploidy and MSI (+) were observed in four (3.4%) tumors and both DNA diploidy and MSI (–) were observed in 38 (32.8%) tumors in this study. It seems that chromosomal instability and microsatellite instability pathways are not always mutually exclusive in gastric cancer, and additional mechanisms, such as the CpG island methylator phenotype (CIMP), may contribute to gastric carcinogenesis.( 35 )
It is well known that mutation in the TP53 gene contributes to DNA aneuploidy. In our study, DNA aneuploidy and TP53 gene mutation were significantly correlated. However, the frequency of the TP53 gene mutation (23.8%) was less than DNA aneuploidy (60.3%). Thus it seemed that the mutation in the TP53 gene did not explain all the DNA aneuploidy in gastric cancers.( 3 )
This study revealed that, by immunohistochemical staining, high expression of BUBR1, a key molecule in the spindle assembly checkpoint, had a significant correlation with DNA aneuploidy in gastric cancer. This result was consistent with the study on bladder cancer by Yamamoto et al. ( 19 ) Also the gastric cancer cell lines which showed DNA aneuploidy had higher BUBR1 expression in comparison to DNA diploid cell lines. High expression of BUBR1 may be an important factor for DNA aneuploidy and may contribute to chromosomal instability.
In this study, we also found that the enforced expression of BUBR1 in the gastric cancer cell line MKN‐28 and the diploid gastric cancer cell line SNU‐1 contributed to the change to the DNA ploidy pattern compared with mock cells. The mechanism for changes to the DNA ploidy pattern in the BUBR1 highly expressed cell line is unclear. It is known that BUBR1 forms a complex with Bub3, Mad2, and Cdc20 at the spindle assembly checkpoint and thus inhibits Cdc20 activity.( 36 ) In gastric cancer cells with high BUBR1 expression, the formation of this complex might be compromised and the spindle assembly checkpoint may be overridden, which may result in DNA aneuploidy.
When BUBR1 is depleted in human cells, it results in chromosome misalignment,( 37 ) and its suppression is invariably lethal due to massive chromosomal loss.( 38 ) It is reported that reduction in BUBR1 levels in Apc Min/+ mice, which carry one mutant Apc allele encoding a truncated protein that causes intestinal neoplasias, resulted in a 10‐fold increase in the number of tumors that developed by the same age, and these tumors were also of a higher grade.( 39 ) Moreover, the overexpression of Mad2, another molecule at the spindle assembly checkpoint, caused DNA aneuploidy and carcinogenesis in mice.( 40 ) An abnormal expression level in spindle assembly checkpoint molecules, including BUBR1, seems to be important for carcinogenesis.
On the other hand, we also found that high expression of BUBR1 correlated with malignant features and liver metastasis in gastric cancer. And those tumors demonstrating high BUBR1 expression were associated with a poorer survival rate compared to the tumors with low expression of BUBR1. These results might reflect the fact that BUBR1 high‐expressed tumors have a high proliferation activity. In fact, the current study showed that with enforced expression of BUBR1 in MKN‐28 gastric cancer cell line, the growth of the cells increased. And in both MKN‐28 BUBR1 and SNU‐1 BUBR1, the expression of Ki‐67 increased significantly. It has been reported that enforced expression of BUBR1 in HeLa cells increased the mitotic index.( 10 ) Also, Grabsh et al. ( 41 ) reported that BUBR1 high expression had a significant relationship with Ki‐67 expression in gastric cancer clinical samples, which was a similar result to our study in gastric cancer cell lines.
Taken together, the high expression of BUBR1 may result in the proliferation of tumor cells and DNA aneuploidy.
A high expression of BUBR1 may correlate with DNA aneuploidy in gastric cancer. However, a question remains. As malignancies which show DNA aneuploidy have aberrant chromosome numbers, high expression of BUBR1 may be an effect of the DNA aneuploidy. In our study, we only observed the DNA ploidy pattern change in MKN‐28 and SNU‐1 gastric cancer cells. Further studies on BUBR1 and other factors in the spindle assembly checkpoint as a cause or effect of chromosomal instability are necessary.
Association between BUBR1 expression and taxane sensitivity was reported in breast and esophageal cancer.( 42 , 43 ) Our succinic dehydrogenase inhibition (SDI) test data of gastric cancer specimens, however, did not indicate significant association between BUBR1 expression and taxane sensitivity (data not shown). Therefore, we may not be able to predict the therapeutic effect of taxane from the expression level of BUBR1 in gastric cancer. Recently, tumor necrosis factor‐related apoptosis‐inducing ligand (TRAIL) has attracted interest as an anticancer treatment when used in conjunction with standard chemotherapy, such as the taxanes. Kim et al. reported that adding TRAIL to the taxanes accentuates the degradation of BUBR1 and induces cancer cell death.( 44 ) Using TRAIL with the taxanes in BUBR1 high‐expressed gastric cancers might therefore be a successful treatment.
In conclusion, the high expression of BUBR1 was associated with DNA aneuploidy and was also correlated with tumor invasion and metastasis in gastric cancer. The elucidation of the spindle assembly checkpoint may therefore help to clarify the mechanism for DNA aneuploidy and progression in gastric cancer.
Acknowledgments
We thank Ms Y. Kubota for her wonderful work in preparing the immunohistochemistry samples. Also we thank Ms T. Shishino, Ms K. Yamashita, and Ms K. Tagata for their technical assistance.
References
- 1. Bignold LP, Coghlan B, Jersmann H. David Paul Hansemann: chromosomes and the origin of the cancerous features of tumor cells. Cell Oncol 2009; 31: 61. [DOI] [PMC free article] [PubMed] [Google Scholar]
- 2. Lengauer C, Kinzler KW, Vogelstein B. Genetic instability in colorectal cancers. Nature 1997; 386: 623–7. [DOI] [PubMed] [Google Scholar]
- 3. Duensing A, Duensing S. Guilt by association? p53 and the development of aneuploidy in cancer. Biochem Biophys Res Commun 2005; 331: 694–700. [DOI] [PubMed] [Google Scholar]
- 4. Smith ML, Fornace AJ Jr. Genomic instability and the role of p53 mutations in cancer cells. Curr Opin Oncol 1995; 7: 69–75. [PubMed] [Google Scholar]
- 5. Hartwell LH, Weinert TA. Checkpoints: controls that ensure the order of cell cycle events. Science (New York, NY) 1989; 246: 629–34. [DOI] [PubMed] [Google Scholar]
- 6. Amon A. The spindle checkpoint. Curr Opin Genet Dev 1999; 9: 69–75. [DOI] [PubMed] [Google Scholar]
- 7. Van Deursen JM. Rb loss causes cancer by driving mitosis mad. Cancer Cell 2007; 11: 1–3. [DOI] [PubMed] [Google Scholar]
- 8. Jablonski SA, Chan GK, Cooke CA, Earnshaw WC, Yen TJ. The hBUB1 and hBUBR1 kinases sequentially assemble onto kinetochores during prophase with hBUBR1 concentrating at the kinetochore plates in mitosis. Chromosoma 1998; 107: 386–96. [DOI] [PubMed] [Google Scholar]
- 9. Fang G. Checkpoint protein BubR1 acts synergistically with Mad2 to inhibit anaphase‐promoting complex. Mol Biol Cell 2002; 13: 755–66. [DOI] [PMC free article] [PubMed] [Google Scholar]
- 10. Wu H, Lan Z, Li W et al. p55CDC/hCDC20 is associated with BUBR1 and may be a downstream target of the spindle checkpoint kinase. Oncogene 2000; 19: 4557–62. [DOI] [PubMed] [Google Scholar]
- 11. Ge S, Skaar JR, Pagano M. APC/C‐ and Mad2‐mediated degradation of Cdc20 during spindle checkpoint activation. Cell Cycle 2009; 8: 167–71. [DOI] [PMC free article] [PubMed] [Google Scholar]
- 12. Kim HS, Jeon YK, Ha GH et al. Functional interaction between BubR1 and securin in an anaphase‐promoting complex/cyclosomeCdc20‐independent manner. Cancer Res 2009; 69: 27–36. [DOI] [PubMed] [Google Scholar]
- 13. Matsuura S, Ito E, Tauchi H, Komatsu K, Ikeuchi T, Kajii T. Chromosomal instability syndrome of total premature chromatid separation with mosaic variegated aneuploidy is defective in mitotic‐spindle checkpoint. Am J Hum Genet 2000; 67: 483–6. [DOI] [PMC free article] [PubMed] [Google Scholar]
- 14. Matsuura S, Matsumoto Y, Morishima K et al. Monoallelic BUB1B mutations and defective mitotic‐spindle checkpoint in seven families with premature chromatid separation (PCS) syndrome. Am J Med Genet 2006; 140: 358–67. [DOI] [PubMed] [Google Scholar]
- 15. Myrie KA, Percy MJ, Azim JN, Neeley CK, Petty EM. Mutation and expression analysis of human BUB1 and BUB1B in aneuploid breast cancer cell lines. Cancer Lett 2000; 152: 193–9. [DOI] [PubMed] [Google Scholar]
- 16. Sato M, Sekido Y, Horio Y et al. Infrequent mutation of the hBUB1 and hBUBR1 genes in human lung cancer. Jpn J Cancer Res 2000; 91: 504–9. [DOI] [PMC free article] [PubMed] [Google Scholar]
- 17. Pinto M, Vieira J, Ribeiro FR et al. Overexpression of the mitotic checkpoint genes BUB1 and BUBR1 is associated with genomic complexity in clear cell kidney carcinomas. Cell Oncol 2008; 30: 389–95. [DOI] [PMC free article] [PubMed] [Google Scholar]
- 18. Scintu M, Vitale R, Prencipe M et al. Genomic instability and increased expression of BUB1B and MAD2L1 genes in ductal breast carcinoma. Cancer Lett 2007; 254: 298–307. [DOI] [PubMed] [Google Scholar]
- 19. Yamamoto Y, Matsuyama H, Chochi Y et al. Overexpression of BUBR1 is associated with chromosomal instability in bladder cancer. Cancer Genet Cytogenet 2007; 174: 42–7. [DOI] [PubMed] [Google Scholar]
- 20. Japanese Gastric Cancer A . Japanese classification of gastric carcinoma – 2nd english edition. Gastric Cancer 1998; 1: 10–24. [DOI] [PubMed] [Google Scholar]
- 21. Burum‐Auensen E, De Angelis PM, Schjolberg AR, Kravik KL, Aure M, Clausen OPF. Subcellular localization of the spindle proteins Aurora A, Mad2, and BUBR1 assessed by immunohistochemistry. J Histochem Cytochem 2007; 55: 477–86. [DOI] [PubMed] [Google Scholar]
- 22. Burum‐Auensen E, DeAngelis PM, Schjolberg AR, Roislien J, Andersen SN, Clausen OPF. Spindle proteins Aurora A and BUB1B, but not Mad2, are aberrantly expressed in dysplastic mucosa of patients with longstanding ulcerative colitis. J Clin Pathol 2007; 60: 1403–8. [DOI] [PMC free article] [PubMed] [Google Scholar]
- 23. Kamada T, Sasaki K, Tsuji T, Todoroki T, Takahashi M, Kurose A. Sample preparation from paraffin‐embedded tissue specimens for laser scanning cytometric DNA analysis. Cytometry 1997; 27: 290–4. [DOI] [PubMed] [Google Scholar]
- 24. Sasaki K, Kurose A, Miura Y, Sato T, Ikeda E. DNA ploidy analysis by laser scanning cytometry (LSC) in colorectal cancers and comparison with flow cytometry. Cytometry 1996; 23: 106–9. [DOI] [PubMed] [Google Scholar]
- 25. Furuya T, Uchiyama T, Murakami T et al. Relationship between chromosomal instability and intratumoral regional DNA ploidy heterogeneity in primary gastric cancers. Clin Cancer Res 2000; 6: 2815–20. [PubMed] [Google Scholar]
- 26. Hiddemann W, Schumann J, Andreef M et al. Convention on nomenclature for DNA cytometry. Committee on Nomenclature, Society for Analytical Cytology. Cancer Genet Cytogenet 1984; 13: 181–3. [DOI] [PubMed] [Google Scholar]
- 27. Oda S, Oki E, Maehara Y, Sugimachi K. Precise assessment of microsatellite instability using high resolution fluorescent microsatellite analysis. Nucleic Acids Res 1997; 25: 3415–20. [DOI] [PMC free article] [PubMed] [Google Scholar]
- 28. Boland CR, Thibodeau SN, Hamilton SR et al. A National Cancer Institute Workshop on Microsatellite Instability for cancer detection and familial predisposition: development of international criteria for the determination of microsatellite instability in colorectal cancer. Cancer Res 1998; 58: 5248–57. [PubMed] [Google Scholar]
- 29. Kues WA, Anger M, Carnwath JW, Paul D, Motlik J, Niemann H. Cell cycle synchronization of porcine fetal fibroblasts: effects of serum deprivation and reversible cell cycle inhibitors. Biol Reprod 2000; 62: 412–9. [DOI] [PubMed] [Google Scholar]
- 30. Shichiri M, Yoshinaga K, Hisatomi H, Sugihara K, Hirata Y. Genetic and epigenetic inactivation of mitotic checkpoint genes hBUB1 and hBUBR1 and their relationship to survival. Cancer Res 2002; 62: 13–7. [PubMed] [Google Scholar]
- 31. Joyce NC, Navon SE, Roy S, Zieske JD. Expression of cell cycle‐associated proteins in human and rabbit corneal endothelium in situ. Invest Ophthalmol Vis Sci 1996; 37: 1566–75. [PubMed] [Google Scholar]
- 32. Baba H, Korenaga D, Kakeji Y, Haraguchi M, Okamura T, Maehara Y. DNA ploidy and its clinical implications in gastric cancer. Surgery 2002; 131: S63–70. [DOI] [PubMed] [Google Scholar]
- 33. Setala LP, Nordling S, Kosma VM et al. Comparison of DNA ploidy and S‐phase fraction with prognostic factors in gastric cancer. Anal Quant Cytol Histol 1997; 19: 524–32. [PubMed] [Google Scholar]
- 34. Chi YH, Jeang KT. Aneuploidy and cancer. J Cell Biochem 2007; 102: 531–8. [DOI] [PubMed] [Google Scholar]
- 35. Ottini L, Falchetti M, Lupi R et al. Patterns of genomic instability in gastric cancer: clinical implications and perspectives. Ann Oncol 2006; 17 (Suppl 7): vii97–102. [DOI] [PubMed] [Google Scholar]
- 36. Davenport J, Harris LD, Goorha R. Spindle checkpoint function requires Mad2‐dependent Cdc20 binding to the Mad3 homology domain of BubR1. Exp Cell Res 2006; 312: 1831–42. [DOI] [PubMed] [Google Scholar]
- 37. Lampson MA, Kapoor TM. The human mitotic checkpoint protein BubR1 regulates chromosome‐spindle attachments. Nat Cell Biol 2005; 7: 93–8. [DOI] [PubMed] [Google Scholar]
- 38. Kops GJ, Foltz DR, Cleveland DW. Lethality to human cancer cells through massive chromosome loss by inhibition of the mitotic checkpoint. Proc Natl Acad Sci U S A 2004; 101: 8699–704. [DOI] [PMC free article] [PubMed] [Google Scholar]
- 39. Rao CV, Yang YM, Swamy MV et al. Colonic tumorigenesis in BubR1 +/‐ApcMin/+ compound mutant mice is linked to premature separation of sister chromatids and enhanced genomic instability. Proc Natl Acad Sci U S A 2005; 102: 4365–70. [DOI] [PMC free article] [PubMed] [Google Scholar]
- 40. Sotillo R, Hernando E, Diaz‐Rodriguez E et al. Mad2 over‐expression promotes aneuploidy and tumorigenesis in mice. Cancer Cell 2007; 11: 9–23. [DOI] [PMC free article] [PubMed] [Google Scholar]
- 41. Grabsch H, Takeno S, Parsons WJ et al. Overexpression of the mitotic checkpoint genes BUB1, BUBR1, and BUB3 in gastric cancer – association with tumour cell proliferation. J Pathol 2003; 200: 16–22. [DOI] [PubMed] [Google Scholar]
- 42. McGrogan BT, Gilmartin B, Carney DN, McCann A. Taxanes, microtubules and chemoresistant breast cancer. Biochim Biophys Acta 2008; 1785: 96–132. [DOI] [PubMed] [Google Scholar]
- 43. Tanaka K, Mohri Y, Ohi M et al. Mitotic checkpoint genes, hsMAD2 and BubR1, in oesophageal squamous cancer cells and their association with 5‐fluorouracil and cisplatin‐based radiochemotherapy. Clin Oncol (R Coll Radiol) 2008; 20: 639–46. [DOI] [PubMed] [Google Scholar]
- 44. Kim M, Liao J, Dowling ML et al. TRAIL inactivates the mitotic checkpoint and potentiates death induced by microtubule‐targeting agents in human cancer cells. Cancer Res 2008; 68: 3440–9. [DOI] [PubMed] [Google Scholar]