

Abstract
K19‐C2mE transgenic (Tg) mice, simultaneously expressing cyclooxygenase‐2 (COX‐2) and microsomal prostaglandin E synthase‐1 (mPGES‐1) in the gastric mucosa under the cytokeratin 19 gene promoter, were here treated with N‐methyl‐N‐nitrosourea (MNU) and inoculated with Helicobacter pylori (H. pylori) to investigate gastric carcinogenesis. Wild‐type (WT) and Tg mice undergoing MNU treatment frequently developed tumors in the pyloric region (100% and 94.7%, respectively); multiplicity in Tg was higher than that in WT (P < 0.05) with H. pylori infection. Larger pyloric tumors were more frequently observed in Tg than in WT (P < 0.05). In addition, Tg developed fundic tumors, where WT did not. No gastric tumors were observed without MNU treatment. Transcripts of TNF‐α, iNOS, IL‐1β, and CXCL14 were up‐regulated with H. pylori infection in both genotypes and were also increased more in Tg than in WT within H. pylori‐inoculated animals. Immunohistochemical analysis demonstrated significantly greater β‐catenin accumulation in pyloric tumors, compared with those in the fundus (P < 0.01) with mutations of exon 3; 18.2% and 31.6% in MNU‐alone and MNU + H. pylori‐treated WT, whereas 21.4% and 62.5% was observed in the Tg, respectively; the latter significantly higher (P < 0.05), suggesting the role of H. pylori in Wnt activation. In conclusion, K19‐C2mE mice promoted gastric cancer in both fundic and pyloric regions. Furthermore β‐catenin activation may play the important role of pyloric carcinogenesis especially in H. pylori‐infected Tg. Induction of various inflammatory cytokines in addition to overexpression of COX‐2/mPGES‐1 could be risk factors of gastric carcinogenesis and may serve as a better gastric carcinogenesis model. (Cancer Sci 2008; 99: 2356–2364)
There is a large body of evidence that Helicobacter pylori (H. pylori) infection is involved in development of chronic gastritis, peptic ulceration, and gastric cancer.( 1 , 2 ) Recent reports have revealed that H. pylori infection induces cyclooxygenase‐2 (COX‐2) expression and microsomal prostaglandin E synthase‐1 (mPGES‐1), enzymes responsible for synthesizing prostaglandin E2 (PGE2) in gastric mucosa.( 3 , 4 , 5 ) In the stomach, prostaglandins are major molecules for maintaining the gastric mucosa.( 6 ) PGE2 plays distinct roles in tumor growth and metastasis in several cancers.( 7 )
Oshima et al. recently constructed transgenic mice (K19‐C2mE) that simultaneously overexpress COX‐2 and mPGES‐1 in the gastric mucosa under the influence of the cytokeratin 19 gene promoter.( 4 ) The transgenic (Tg) mice develop inflammation‐associated hyperplastic lesions in the proximal glandular stomach, similar to those found in the Helicobacter‐infected stomach.( 4 ) Furthermore, K19‐Wnt1/C2mE Tg mice, simultaneously expressing Wnt1 as well as COX‐2/mPGES‐1, develop dysplastic gastric tumors,( 8 ) indicating that COX‐2/mPGES‐1 and Wnt pathway activation might be involved in mouse gastric neoplasia.
The Wnt/β‐catenin signaling pathway plays important roles in cell–cell adhesion and cell cycle regulation and its alternation is implicated in genesis of many cancers. Abnormal nuclear accumulation of β‐catenin due to mutation of the β‐catenin gene stimulates the expression of β‐catenin/Tcf target genes, such as c‐myc, c‐jun, and cyclin D1.( 9 , 10 ) Mutations of β‐catenin gene exon 3, where serine and threonine residues are physiologically phosphorylated by glycogen synthase kinase (GSK)‐3β, prevent degeneration by APC/GSK‐3β/Axin complex. With human gastric cancers, nuclear accumulation of β‐catenin has been estimated to occur in 12–37% of cases,( 11 , 12 , 13 , 14 , 15 ) with mutations in exon 3 reported in a few to over 20%.( 12 , 16 , 17 ) However, the degree of involvement of Wnt pathway alteration in the development of mouse gastric cancers remains unclear.
In the present study, Tg mice were treated with a stomach carcinogen, N‐methyl‐N‐nitrosourea (MNU), and inoculated with H. pylori to investigate the influence of COX‐2/mPGES‐1 expression and H. pylori infection on mouse gastric carcinogenesis. Furthermore, we analyzed the frequency of β‐catenin activation and gene mutations to assess involvement of the Wnt pathway.
Materials and Methods
Experimental design. The experimental design is shown in Fig. 1. K19‐C2mE Tg mice and littermate wild‐type (WT) mice were randomly divided into four groups (groups A–D). The mice of groups B and D were inoculated intragastrically with 0.8 mL of broth culture containing H. pylori. After 1 week, the mice of groups C and D were given MNU (Sigma Chemical Co., St Louis, MO, USA) in drinking water at the concentration of 120 p.p.m. on alternate weeks (total exposure was 5 weeks) and then normal tap water until the end of experiment. MNU was dissolved in distilled water and freshly prepared three times per week. At the end of the experiment, all surviving mice were sacrificed under deep anesthesia 60 min after an intraperitoneal injection of 5′‐bromo‐2′‐deoxyuridine (BrdU) at a dose of 100 mg/kg. The excised stomachs were fixed in 10% neutral‐buffered formalin or 95% ethanol plus 1% acetic acid for histology and immunohistochemistry.
Figure 1.
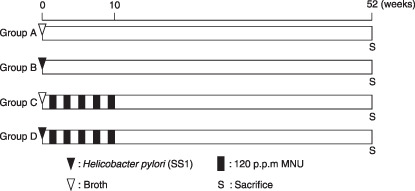
Experimental design. Five‐ to 6‐week‐old K19‐C2mE transgenic mice and littermate wild‐type mice were inoculated with Helicobacter pylori SS1 (groups B and D) or broth (groups A and C). After 1 week, animals of groups C and D were administered 120 p.p.m. N‐methyl‐N‐nitrosourea on alternate weeks (total exposure, 5 weeks).
Animals. K19‐C2mE transgenic (Tg) mice produced by Oshima et al.( 4 ) were maintained by breeding male K19‐C2mE Tg with female C57BL/6 N at the Animal Facility of Aichi Cancer Center Research Institute. WT mice were used as controls. All were housed in plastic cages with hardwood chips in an air‐conditioned room with 12 h light–12 h dark cycle and given a basal diet (CA‐1; CLEA Japan Inc., Tokyo, Japan) and water ad libitum. For genotyping of each mouse, DNA samples were extracted from the tails using a DNeasy tissue kit (Qiagen, Tokyo, Japan) and subjected to polymerase chain reaction (PCR) as reported elsewhere.( 4 )
Bacterial culture. H. pylori strain SS1 was inoculated on Brucella agar plates (Merck, Darmstadt, Germany) containing 7% v/v heat‐inactivated fetal calf serum and incubated at 37°C under microaerobic conditions using an Anaero Pack Campylo (Mitsubishi Gas Chemical Co., Tokyo, Japan) at high humidity for 2 days. Then, bacteria grown on the plates were introduced into Brucella broth (Becton Dickson, Cockeysville, MD, USA) supplemented with 7% v/v fetal calf serum, and cultures of H. pylori were checked under a phase contrast microscope for bacterial shape and mobility.
Histopathological analysis. Tissue sections were stained with hematoxylin–eosin and Alcian blue (pH 2.5)–periodic acid‐Schiff (AB‐PAS) for histological analysis. Tumor location was categorized into ‘fundic’ and ‘pyloric’, the former included tumors developing in the gastric fundic mucosa and border areas of fundic and pyloric glands. The glandular mucosa was examined histologically for any inflammatory and epithelial changes. Active chronic gastritis was estimated according to criteria modified from the updated Sydney System, characterized by infiltration of neutrophils and lymphocytes. The degree of change was graded in a scale from 0 to 3, (0 [normal], 1 [mild], 2 [moderate], and 3 [marked]). Mucosa thickness was measured using AxioVision 4.6 (Carl Zeiss, Jena, Germany). Tumor size was evaluated by the largest tumor area using NIH image version 1.62 (National Institutes of Health, USA) on hematoxylin–eosin sections. Serial sections were also stained immunohistochemically with antibodies against COX‐2 (Cayman Chemical, Ann Arbor, MI, USA), β‐catenin (clone 14; BD Transduction Laboratories, KY, USA), and BrdU (Dako, Glostrup, Denmark). BrdU labeling index was calculated as the percentages of BrdU‐positive epithelial cells within glands at five different arbitrarily selected points in gastric mucosa.
Analysis of inflammatory cytokine mRNA by quantitative real‐time reverse transcription (RT)–PCR. Total RNA was extracted from the border areas of fundic and pyloric regions in the glandular stomach mucosa using an RNeasy Plus Mini kit (Qiagen, Hilden, Germany). First strand cDNAs were synthesized using a Super Script III First‐Strand Synthesis System for RT‐PCR (Invitrogen, Carlsbad, CA, USA) according to the manufacturer's instructions. Relative quantitative PCR for COX‐2, tumor necrosis factor‐α (TNF‐α), inducible nitric oxide synthase (iNOS), interleukin‐1β (IL‐1β), IL‐6, and CXCL14 was performed using the mouse glyceraldhyde‐3‐phosphate dehydrogenase (GAPDH) gene as an internal control with the StepOne Real‐Time PCR system (Applied Biosystems, Foster City, CA, USA) using a QuantiTect SYBR Green PCR kit (Qiagen). The primer sequences are listed in Table 1. Quantification was performed as earlier established.( 18 ) The expression levels were expressed relative to 1.00 in WT mice in the control group A.
Table 1.
Primer sequences used for quantitative reverse transcription–polymerase chain reaction
| Target | Primer sequence | Product size (bp) |
|---|---|---|
| COX‐2 | 5′‐AAGCCCTCTACAGTGACATC‐3′ | 115 |
| 5′‐GAGAATGGTGCTCCAAGCTCTA‐3′ | ||
| TNF‐α | 5′‐GCCGATGGGTTGTACCTTGTCTACT‐3′ | 134 |
| 5′‐ACGGCAGAGAGGAGGTTGACTT‐3′ | ||
| iNOS | 5′‐CCGGCAAACCCAAGGTCTACGTT‐3′ | 128 |
| 5′‐CACATCCCGAGCCATGCGCACATCT‐3′ | ||
| IL‐1β | 5′‐TTGACTTCACCATGGAATCCGTGTC‐3′ | 126 |
| 5′‐GAGTCCCCTGGAGATTGAGC‐3′ | ||
| IL‐6 | 5′‐CCTACCCCAATTTCCAATGCTCT‐3′ | 143 |
| 5′‐CACTAGGTTTGCCGAGTAGATCTCA‐3′ | ||
| CXCL14 | 5′‐TGGTTGAGACCGTTCACAGCACTAC‐3′ | 122 |
| 5′‐GAAACTCTGACCAGTCATAAGCC‐3′ | ||
| GAPDH | 5′‐CAACTCCCACTCTTCCACCTTCGAT‐3′ | 106 |
| 5′‐CCTGTTGCTGTAGCCGTATTC‐3′ |
COX‐2, cyclooxygenase‐2; GAPDH, glyceraldhyde‐3‐phosphate dehydrogenase; IL‐1β, interleukin‐1β; IL‐6, interleukin‐6; iNOS, inducible nitric oxide synthase; TNF‐α, tumor necrosis factor‐α.
DNA extraction and direct sequencing. Immunoreactivity of β‐catenin was classified into ‘nuclear/cytoplasmic’ or ‘membranous’ according to the intracellular localization of β‐catenin protein. Tumors with 5% or more section area of nuclear/cytoplasmic β‐catenin were judged as β‐catenin accumulating. Tumor areas with nuclear/cytoplasmic or membranous β‐catenin localization and surrounding gastric mucosa in serial paraffin sections (5‐µm thick) were microdissected using a laser microdissection system (AS LMD; Leica Microsystems, Wetzlar, Germany). Microdissection, PCR, and sequencing were performed as previously reported.( 19 , 20 ) The PCR primer sequences to amplify exon 3 of mouse β‐catenin gene were 5′‐AGCCACTGGCAGCAGCAGTCTTAC‐3′ and 5′‐ATAAAGGACTTGGGAGGTGTCAACA‐3′. Sequencing was performed using a BigDye Terminator Cycle Sequencing Kit (v 3.1; Applied Biosystems) with an ABI PRISM 3100 Genetic Analyzer (Applied Biosystems).
Statistical analysis. The incidences of gastric tumors and frequencies of β‐catenin accumulation and gene mutation were analyzed using Fisher's exact probability test. Differences of inflammation scores were assessed with the Mann–Whitney U‐test.
Results
Incidence, multiplicity, and size of gastric tumors. The observed incidences and multiplicities of gastric tumors are summarized in Table 2. In the fundic region, Tg mice of groups C and D developed dysplastic gastric tumors (Fig. 2Aa,b), whereas WT mice did not. In contrast, WT (Fig. 2Ba,b) and Tg (Fig. 2Ca,b) mice of groups C and D developed dysplastic gastric tumors in the pyloric region; incidences were 100% and 94.7%, respectively, the difference not being significant among the groups and genotypes. Tumor multiplicity in Tg mice in group D (2.28 ± 0.96 tumors/mouse) was higher than those in WT mice in group C (1.40 ± 0.70) and in group D (1.75 ± 0.74) (P < 0.01 and P < 0.05, respectively). The maximum tumor size in each animal is plotted in Fig. 3. Averages ± SD were 6.3 ± 5.0 and 8.1 ± 5.0 in WT and Tg mice in group C. The corresponding figures were 6.2 ± 5.2 and 7.9 ± 5.1 in group D. The ratio of larger tumors (> 10.0 mm2) in Tg mice (8/15 = 53.3%) was significantly more frequent than that in the WT (1/12 = 8.3%) mice within group C (P < 0.05), but not within group D (4/24 = 16.7% and 4/17 = 23.5% in WT and Tg, respectively, P = 0.70). No gastric tumors were observed in groups A and B.
Table 2.
Incidence and multiplicity of MNU‐treated K19‐C2mE mice with gastric tumors
| Groups | Treatments | Genotypes | Effective nos. | Incidence (%) | Tumor multiplicity in pyloric mucosa (no. of tumors/mouse) † | |
|---|---|---|---|---|---|---|
| Fundic mucosa | Pyloric mucosa | |||||
| A | Broth | WT | 10 | 0 (0%) | 0 (0%) | 0 |
| Tg | 10 | 0 (0%) | 0 (0%) | 0 | ||
| B | H. pylori | WT | 10 | 0 (0%) | 0 (0%) | 0 |
| Tg | 10 | 0 (0%) | 0 (0%) | 0 | ||
| C | Broth + MNU | WT | 12 | 0 (0%) | 12 (100%) | 1.40 ± 0.70 |
| Tg | 15 | 4 (26.7%) | 15 (100%) | 2.00 ± 0.88 | ||
| D | H. pylori + MNU | WT | 24 | 0 (0%) | 24 (100%) | 1.75 ± 0.74 |
| Tg | 19 | 4 (21.1%)* | 18 (94.7%) | 2.28 ± 0.96* | ||
H. pylori, Helicobacter pylori; MNU, N‐methyl‐N‐nitrosourea; Tg, Transgenic; WT, wild type.
P < 0.05 versus WT within group D.
Values are expressed as average ± SD.
Figure 2.
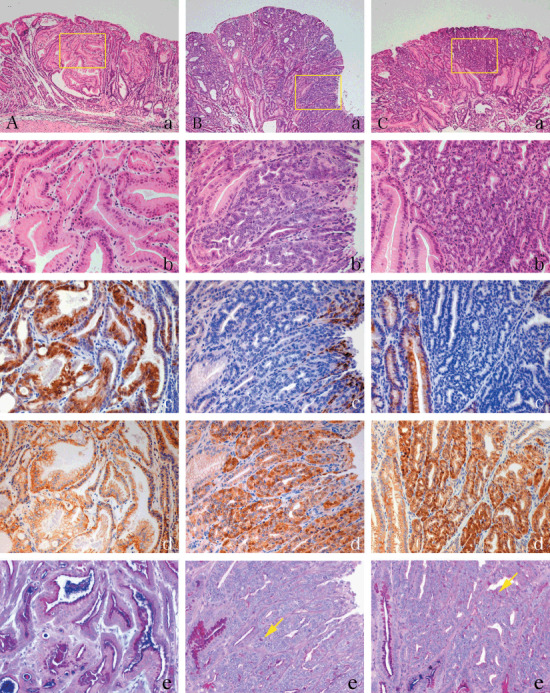
Histopathological and immunohistochemical analysis of COX‐2 and β‐catenin in N‐methyl‐N‐nitrosourea (MNU)–induced tumors in K19‐C2mE Tg mice. (A) Gastric tumors in the fundic region of MNU‐treated Tg mice. (B,C) Gastric tumors with nuclear β‐catenin accumulation in the pyloric region of MNU‐induced WT (B) and Tg mice (C). (a,b) Hematoxylin–eosin staining. (c,d) Immunohistochemistry for COX‐2 (c) and β‐catenin (d). (e) Alcian blue (pH 2.5)–periodic acid‐Schiff (AB‐PAS). Yellow arrow shows PAS‐positive mucin. Yellow boxes in (a) are magnified in (b–e), respectively. Original magnification, 50× (a), 200× (b–e).
Figure 3.
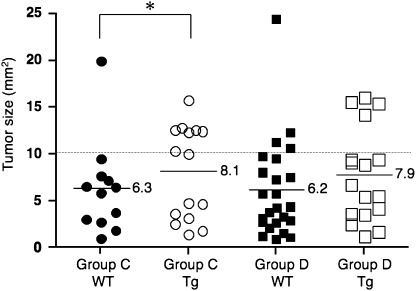
Maximum tumor size in individual N‐methyl‐N‐nitrosourea (MNU)–induced K19‐C2mE mice in the pyloric region. Ratio of larger tumors (> 10.0 mm2): Tg versus WT in group C, 8/15 = 53.3%versus 1/12 = 8.3% (*P < 0.05); 4/24 = 16.7%versus 4/17 = 23.5% (not significant) in group D. Dotted line, cut‐off value (10 mm2). Horizontal lines and values, mean.
Status of gastritis. Data for the gastritis status in each group are summarized in Table 3. The gastric mucosa of H. pylori infected groups (B and D) showed significantly higher scores for infiltration of neutrophils and lymphocytes than the non‐H. pylori‐infected groups (A and C). There were no significant differences in scores for infiltration of neutrophils and lymphocytes between genotypes. Gastric mucosa of Tg mice was significantly thickened compared with that of WT. Correspondingly, gastric mucosa of mice with H. pylori infection was also significantly thickened compared with mice without H. pylori infection. BrdU labeling indices were increased with H. pylori infection irrespective of genotypes (groups B and D), associated with hyperplastic change in fundic mucosa. In pyloric mucosa, the BrdU labeling index was higher in Tg mice in group D.
Table 3.
Histopathological response in gastric musoca of K19‐C2mE Tg mice
| Groups | Treatments | Genotypes | Effective nos. | Neutrophilis | Lymphocytes | Fundic mucosa thickness (µm) | BrdU labeling index (%) | |
|---|---|---|---|---|---|---|---|---|
| Fundic mucosa | Pyloric mucosa | |||||||
| A | Broth | WT | 10 | 0.33 ± 0.82 | 0.17 ± 0.41 | 342.8 ± 38.7 | 7.46 ± 1.94 | 12.16 ± 2.22 |
| Tg | 10 | 0.18 ± 0.40 | 0.27 ± 0.47 | 520.8 ± 283.0**** | 7.56 ± 2.00 | 12.62 ± 3.01 | ||
| B | H. pylori | WT | 10 | 2.70 ± 0.48* | 2.80 ± 0.42* | 593.2 ± 111.2* | 12.38 ± 1.64* | 14.97 ± 3.18 |
| Tg | 10 | 2.60 ± 0.52* | 2.70 ± 0.48* | 772.1 ± 214.1***** | 13.96 ± 1.76* | 14.33 ± 2.69 | ||
| C | Broth + MNU | WT | 12 | 0 ± 0 | 0.18 ± 0.40 | 293.3 ± 88.2 | 7.32 ± 2.37 | 12.88 ± 3.65 |
| Tg | 15 | 0.43 ± 0.76 | 0.07 ± 0.27 | 438.2 ± 162.1****** | 7.70 ± 1.45 | 12.86 ± 3.11 | ||
| D | H. pylori + MNU | WT | 24 | 1.58 ± 1.02** | 2.00 ± 0.83** | 441.9 ± 151.8** | 13.43 ± 7.18** | 15.66 ± 3.78 |
| Tg | 19 | 2.11 ± 0.68** | 2.67 ± 0.69** , *** | 517.5 ± 129.2 | 16.95 ± 4.23** , *** | 16.04 ± 5.46******* | ||
BrdU, 5′‐bromo‐2′‐deoxyuridine; H. pylori, Helicobacter pylori; MNU, N‐methyl‐N‐nitrosourea; Tg, Transgenic; WT, wild type.
P < 0.01 versus corresponding genotypes in group A;
P < 0.01 versus corresponding genotypes in group C;
P < 0.01 versus WT within group D;
P < 0.05 versus WT within group A;
P < 0.01 versus WT within group B;
P < 0.01 versus WT within group C;
P < 0.05 versus Tg in group D. Values for results are expressed as averages ± SD.
Alteration of expression of inflammatory cytokines. Data for the expression levels of inflammatory factors in each group are summarized in Table 4. The mRNA expressions of TNF‐α, iNOS, IL‐1β, and CXCL14 in H. pylori‐infected groups were significantly increased compared with non‐H. pylori‐infected groups in both genotypes. COX‐2 was not up‐regulated with H. pylori infection in WT animals. Furthermore, the mRNA expression levels of COX‐2, TNF‐α, iNOS, IL‐1β, and CXCL14 in Tg mice were significantly higher than those in WT mice in group D. In the groups A–C, there were no significant differences in expression of inflammatory factors between both genotypes except for COX‐2.
Table 4.
Relative mRNA expression levels of inflammatory cytokines in gastric mucosa of K19‐C2mE mice
| Groups | Treatments | Genotypes | Relative mRNA expression levels (range) | |||||
|---|---|---|---|---|---|---|---|---|
| COX‐2 | TNF‐α | iNOS | IL‐1β | IL‐6 | CXCL14 | |||
| A | Broth | WT | 1.00 (0.55–1.81) | 1.00 (0.49–2.02) | 1.00 (0.58–1.73) | 1.00 (0.31–3.20) | 1.00 (0.38–2.63) | 1.00 (0.52–1.93) |
| Tg | 1824.28 (1448.04–2298.28)****** | 0.68 (0.37–1.24) | 0.68 (0.18–2.52) | 0.97 (0.37–2.49) | 1.22 (0.64–2.29) | 0.76 (0.41–1.43) | ||
| B | H. pylori | WT | 2.07 (0.76–5.64) | 27.74 (16.21–47.46)* | 18.85 (8.56–41.49)* | 31.45 (20.52–48.20)* | 2.74 (1.83–4.10)** | 3.96 (2.94–5.34)* |
| Tg | 1272.96 (694.86–2332.02)****** | 42.98 (15.66–117.96)* | 38.59 (9.57–155.70)* | 32.41 (14.04–74.81)* | 2.55 (2.08–3.14)* | 5.12 (3.25–8.06)* | ||
| C | Broth + MNU | WT | 2.00 (1.18–3.39) | 5.61 (2.55–12.32)* | 4.23 (2.92–6.12)* | 8.42 (4.35–16.30)* | 1.23 (0.35–4.27) | 4.94 (2.21–11.07)* |
| Tg | 2333.23 (1588.37–3427.38)****** | 4.81 (2.75–8.43)* | 5.98 (3.11–11.51)* | 9.61 (4.73–19.55)* | 1.59 (0.13–19.12) | 6.35 (3.35–12.03)* | ||
| D | H. pylori + MNU | WT | 2.18 (1.21–3.91) | 26.63 (8.78–80.76)**** | 19.08 (5.13–71.02)**** | 25.18 (10.67–59.45)**** | 3.22 (1.61–6.44) | 4.53 (2.42–8.47)*** |
| Tg | 901.64 (492.31–1651.30)****** | 61.19 (20.55–182.24)**** , ****** | 42.31 (12.94–138.40)**** , ****** | 54.03 (19.62–148.80)**** , ****** | 3.74 (1.29–10.85) | 8.04 (5.09–12.71)*** , ****** | ||
COX‐2, cyclooxygenase‐2; H. pylori, Helicobacter pylori; IL‐1β, interleukin‐1β; IL‐6, interleukin‐6; iNOS, inducible nitric oxide synthase; MNU, N‐methl‐N‐nitrosourea; Tg, Transgenic; TNF‐α, tumor necrosis factor‐α; WT, wild type.
P < 0.01 or
P < 0.05 versus corresponding genotypes in group A;
P < 0.01 versus corresponding genotypes in group B;
P < 0.01 or
P < 0.05 versus corresponding genotypes in group C;
P < 0.01 versus WT in same groups. Values are expressed as mean. Ranges in parenthesis are expressed as mean – SD to mean + SD.
Immunolocalization of COX‐2 and β‐catenin, and mucin staining. COX‐2 expression was retained in the fundic tumor cells (Fig. 2Ac) as well as surrounding normal foveolar epithelium (Fig. 2Cc, left image). But it was attenuated in pyloric tumor cells in WT (Fig. 2Bc) and Tg (Fig. 2Cc, right image) mice. Besides the epithelial tumor cells, infiltrating and/or stromal cells also expressed COX‐2 in tumor stroma (right surface area in Fig. 2Bb). β‐Catenin was localized on the membrane in fundic tumors (Fig. 2Ad) as well as in normal glands. In contrast, most pyloric tumors harbored β‐catenin in cytoplasms or nuclei both in WT and Tg mice (Fig. 2Bd and Cd, respectively) (Table 5). Gastric cancer cells in the pyloric region contained little PAS‐positive mucin (Fig. 2Be and Ce), whereas those in fundic area retained AB‐ and PAS‐positive mucin (Fig. 2Ae).
Table 5.
Number and frequency of β‐catenin accumulation in fundic and pyloric tumors
| Groups | Treatments | Genotypes | Number (frequency) of β‐catenin accumulation | |
|---|---|---|---|---|
| Fundic mucosa | Pyloric mucosa | |||
| C | Broth + MNU | WT | NA | 12/12 (100%) |
| Tg | 0/4 (0%) | 15/15 (100%)* | ||
| D | H. pylori + MNU | WT | NA | 22/24 (91.6%) |
| Tg | 1/4 (25%) | 18/18 (100%)** | ||
H. pylori, Helicobacter pylori; MNU, N‐methyl‐N‐nitrosourea; NA, not applicable due to no tumors; Tg, Transgenic; WT, wild type.
P < 0.01 versus that of fundic mucosa in Tg within group C;
P < 0.01 versus that of fundic mucosa in Tg within group D.
β‐Catenin accumulation and gene mutations in gastric tumors. Data for number and frequency of fundic and pyloric tumors demonstrating β‐catenin accumulation are summarized in Table 5. β‐Catenin accumulation was significantly more common in tumors in pyloric mucosa compared with those in the fundic region in both WT and Tg genotypes (P < 0.01).
To analyze β‐catenin gene mutation in gastric tumors with β‐catenin accumulation, microdissection was performed for corresponding regions from serial paraffin sections. All mutations of β‐catenin gene exon 3 were identified in β‐catenin accumulating (nuclear/cytoplasmic) regions except for one membranous staining case in group D (Table 6). Mutations of β‐catenin gene exon 3 were more frequently observed in the Tg mice of group D than in the Tg mice of group C (P < 0.05). Mutation frequency of β‐catenin accumulating regions in WT and Tg mice in group C were 18.2% and 21.4%. The corresponding figures in group D were 31.6% and 62.5%, respectively. All mutations observed in pyloric tumors were transitions: C→T (9/22 = 41%), G→A (9/22 = 41%), T→C (4/22 = 18%) (Table 7). No mutations were detected in surrounding normal mucosa.
Table 6.
Localization of β‐catenin in gastric tumors and mutation frequency
| Groups | Treatments | Genotypes | Animal nos. | Frequency of mice with mutations | β‐Catenin mutation frequency in fundic tumors | β‐Catenin mutation frequency in pyloric tumors | Surrounding normal mucosa | ||
|---|---|---|---|---|---|---|---|---|---|
| Nuclear + Cytoplasmic | Membranous | Nuclear + Cytoplasmic | Membranous | ||||||
| C | Broth + MNU | WT | 10 | 2/10 (20%) | NA | NA | 2/11 (18.2%) | 0/7 (0%) | 0/7 (0%) |
| Tg | 10 | 2/10 (20%) | NA | 0/4 (0%) | 3/14 (21.4%) | 0/10 (0%) | 0/6 (0%) | ||
| D | H. pylori + MNU | WT | 10 | 4/10 (40%) | NA | NA | 6/19 (31.6%) | 0/10 (0%) | 0/7 (0%) |
| Tg | 10 | 8/10 (80%)* | 0/1 (0%) | 0/4 (0%) | 10/16 (62.5%)** , *** | 1/14 (7.1%) | 0/7 (0%) | ||
H. pylori, Helicobacter pylori; MNU, N‐methyl‐N‐nitrosourea; NA, not applicable due to no tumors; Tg, Transgenic; WT, wild type.
P < 0.05 versus Tg in group C;
P < 0.05 versus Tg in group C;
P < 0.05 versus Tg in ‘membranous’ in within group D.
Table 7.
Mutation of β‐catenin exon 3 in gastric tumors
| Groups | Treatments | Genotypes | Mice nos. | Sample nos. | Tumor location | β‐Catenin localization | Mutations | Amino acid changes | Events |
|---|---|---|---|---|---|---|---|---|---|
| C | Broth + MNU | WT | W‐6 | T4 | Pylorus | Nuclear/Cytoplasmic | codon 41: ACC→ATC | Thr→Ile | Transition |
| W‐11 | T9 | Pylorus | Nuclear/Cytoplasmic | codon 34: GGA→GAA | Gly→Glu | Transition | |||
| Tg | T‐1 | T12 | Pylorus | Nuclear/Cytoplasmic | codon 32: GAT→AAT | Asp→Asn | Transition | ||
| T13 | Pylorus | Nuclear/Cytoplasmic | codon 32: GAT→AAT | Asp→Asn | Transition | ||||
| T‐12 | T22 | Pylorus | Nuclear/Cytoplasmic | codon 34: GGA→GAA | Gly→Glu | Transition | |||
| D | H. pylori + MNU | WT | W‐8 | T27 | Pylorus | Nuclear/Cytoplasmic | codon 32: GAT→AAT | Asp→Asn | Transition |
| W‐11 | T75 | Pylorus | Nuclear/Cytoplasmic | codon 35: ATC→ATT | Silent | Transition | |||
| T75 | Pylorus | Nuclear/Cytoplasmic | codon 45: TCC→TTC | Ser→Phe | Transition | ||||
| W‐23 | T85 | Pylorus | Nuclear/Cytoplasmic | codon 41: ACC→ATC | Thr→Ile | Transition | |||
| W‐24 | T34 | Pylorus | Nuclear/Cytoplasmic | codon 33: TCT→CCT | Ser→Pro | Transition | |||
| T35 | Pylorus | Nuclear/Cytoplasmic | codon 33: TCT→CCT | Ser→Pro | Transition | ||||
| Tg | T‐2 | T37 | Pylorus | Nuclear/Cytoplasmic | codon 41: ACC→ATC | Thr→Ile | Transition | ||
| T38 | Pylorus | Nuclear/Cytoplasmic | codon 41: ACC→ATC | Thr→Ile | Transition | ||||
| T39 | Pylorus | Membranous | codon 41: ACC→ATC | Thr→Ile | Transition | ||||
| T‐4 | T40 | Pylorus | Nuclear/Cytoplasmic | codon 32: GAT→AAT | Asp→Asn | Transition | |||
| T41 | Pylorus | Nuclear/Cytoplasmic | codon 41: ACC→ATC | Thr→Ile | Transition | ||||
| T‐5 | T88 | Pylorus | Nuclear/Cytoplasmic | codon 32: GAT→AAT | Asp→Asn | Transition | |||
| T‐6 | T90 | Pylorus | Nuclear/Cytoplasmic | codon 33: TCT→CCT | Ser→Pro | Transition | |||
| T‐16 | T158 | Pylorus | Nuclear/Cytoplasmic | codon 32: GAT→AAT | Asp→Asn | Transition | |||
| T‐17 | T147 | Pylorus | Nuclear/Cytoplasmic | codon 32: GAT→AAT | Asp→Asn | Transition | |||
| T‐18 | T92 | Pylorus | Nuclear/Cytoplasmic | codon 41: ACC→ATC | Thr→Ile | Transition | |||
| T‐19 | T149 | Pylorus | Nuclear/Cytoplasmic | codon 41: ACC→ATC | Thr→Ile | Transition |
H. pylori, Helicobacter pylori; MNU, N‐methyl‐N‐nitrosourea; Tg, Transgenic; WT, wild type.
Discussion
In the present study, K19‐C2mE Tg mice developed gastric tumors not only in the pyloric mucosa but also the fundic region, whereas WT mice developed tumors only in pyloric areas with the carcinogen treatment but irrelevant to H. pylori infection. Furthermore, Tg mice possessed larger tumors even without H. pylori infection. On the other hand, Tg mice showed increased tumor multiplicity compared with the corresponding WT mice only with H. pylori infection. These findings indicated that transgenes in combination with H. pylori infection and subsequent inflammatory response should play important roles in promotion of gastric carcinogenesis in various ways in this mouse model.
Immunohistochemical analysis here demonstrated that tumor cells in the fundic region more markedly express COX‐2 than those in the pyloric region. COX‐2 expression was predominantly observed in foveolar epithelial cells in K19‐C2mE Tg mice. Thus fundic tumors might be derived from foveolar epithelial cells and be more significantly affected by COX‐2 expression compared with pyloric tumors. In human gastric neoplasia, proximal gastric tumors are suggested to be specific subtypes of gastric carcinoma based on histological and genetic research.( 21 , 22 ) K19‐C2mE Tg mice may serve as a new animal model for proximal gastric carcinogenesis.
In the present study, H. pylori infection did not promote gastric carcinogenesis in the fundic region, and influence could not be evaluated in the pyloric region in terms of cancer incidence. However, there is abundant evidence from rodent gastric cancer models that H. pylori infection promotes gastric cancers induced by stomach carcinogens, MNU and N‐methyl‐N′‐nitroso‐N‐nitrosoguanidine (MNNG),( 23 , 24 , 25 , 26 , 27 ) although not without exceptions.( 28 ) H. pylori infection induced gastritis and caused hyperplasia of the gastric mucosa in the current mouse system, but heterotopic proliferating glands arising with long‐term infection of H. pylori and considered as high‐grade inflammation in the Mongolian gerbil,( 29 , 30 ) were not observed here. Such lesions are reversible and are considered as regenerative lesions due to excessive cell proliferation. The observations indicate that the influence of H. pylori infection may depend on the animal species with clear differences between the mouse and Mongolian gerbil. In addition, host immune responses or H. pylori virulence factors may affect gastritis and gastric carcinogenesis.( 31 , 32 ) By the fact of increased multiplicity of pyloric tumors in H. pylori‐infected Tg mice, overexpression of COX‐2 and mPGES‐1 may serve as a better mouse model for mimicking human cases.
For further analysis of factors promoting gastric carcinogenesis, we investigated the expression of inflammatory cytokines in gastric mucosa. In the present study, expression of those such as TNF‐α, iNOS, IL‐1β, and CXCL14 were significantly increased in Tg mice with H. pylori infection and MNU treatment. Among them, CXCL14 has been known to selectively attract monocytes, where PGE2 up‐regulates their responsiveness.( 33 ) The combination of these factors may contribute to the participation of macrophages in increased tumorigenesis in Tg mice with H. pylori infection plus MNU treatment. We previously demonstrated that the severity of chronic gastritis, characterized by high‐level expression of IL‐1β, TNF‐α, COX‐2, and iNOS was concerned with glandular gastric carcinogenesis in H. pylori‐infected Mongolian gerbils.( 34 ) Thus, in Tg mice with H. pylori infection a higher level of inflammatory cytokines may be induced that eventually promotes gastric carcinogenesis.
The Tg mice feature increased PGE2 synthesis due to over‐expressed COX‐2/mPGES‐1 in gastric mucosa.( 4 ) PGE2 exerts its biological effects by binding to four isoform receptors, EP1, EP2, EP3, and EP4,( 35 , 36 ) categorized in the family of seven transmembrane G protein coupled rhodopsin‐type receptors. Accumulating evidence indicates that PGE2 promotes tumor growth by stimulating EP receptor signaling with subsequent enhancement of cell proliferation, promotion of angiogenesis, and inhibition of apoptosis.( 37 ) Previous reports based on mouse studies demonstrated that EP1, EP2, and EP4 receptors play important roles in colon carcinogenesis.( 38 , 39 , 40 , 41 ) Furthermore, expression of EP1, EP2, and EP4 receptors has been found to be elevated in mouse mammary tumors as well as colon cancers.( 42 ) EP3 receptor activation was furthermore suggested to contribute to breast cancer progression.( 43 ) These observations indicate that the expression pattern of EP receptors in cancer cells might determine the potential of PGE2 to drive tumor progression. Although the expression level of EP receptors in gastric cancers was unclear in the present study, EP receptor signaling stimulated by PGE2 might have influenced gastric carcinogenesis. It should be stressed that PGE2 transactivates epidermal growth factor receptor (EGFR) and triggers PI3K/Akt signaling,( 44 , 45 , 46 ) and Ras/MEK/ERKs,( 47 ) pathways in gastric epithelial and colon cancer cells in vitro as well as rat gastric mucosa in vivo.( 46 )
To analyze the differences between present mouse gastric tumors developed in fundic and pyloric mucosas, we investigated β‐catenin activation, which was suggested to play an important role in gastric carcinogenesis. Immunohistochemical analysis here showed that β‐catenin activation characterized by its intracellular accumulation was frequently observed in tumors in the pyloric region, in contrast to those in the fundic region, indicating the unnecessariness of the Wnt pathway. Conversely, pyloric tumorigenesis might be promoted by Wnt activation. In a rat model, a type of adenocarcinoma resembling foveolar epithelium showed nuclear accumulation of cyclin D1 without β‐catenin activation,( 48 ) whereas β‐catenin was accumulated in cytoplasms or nuclei in the majority of less‐differentiated adenocarcinomas.( 20 ) Since fundic tumors were histologically classified as being of the foveolar type and pyloric ones were classified as the less differentiated in this experiment, oncogene activation could depend on cell/tissue differentiation or vice versa.( 49 ) Similarly, mucin expression characterized by AB‐PAS staining was observed in fundic tumors as in the hyperplastic fundic tumors in the previous report;( 4 ) pyloric tumors, however, lost most of those mucin production.
Several previous studies of gastric carcinogenesis models in rodents such as the mouse, rat, and Mongolian gerbil have indicated that β‐catenin activation plays an important role in gastric carcinogenesis.( 20 , 50 , 51 , 52 ) In the present study, this was more frequently observed than in previous reports (rat, 18.2%; mouse, 12.5%; and Mongolian gerbil, 2.2%).( 20 , 50 , 51 ) Such variation in the frequency of β‐catenin activation might be caused by differences in experimental design such as the experimental period, chemical carcinogen applied, or type of experimental animal.
In rat and Mongolian gerbil models, mutations of β‐catenin gene in exon 3 have been identified in codons 34, 41, and 45 at GSK‐3β phosphorylation sites, and are significantly associated with nuclear β‐catenin accumulation.( 20 , 51 ) In human gastric cancers, gene alternations have been found in the same sites including codons 29, 37, 41, and 47 as well as in adjacent sites at codons 28, 32, 34, 36, 38, 39, and 48.( 12 , 13 , 19 , 53 ) In the present experiment, the mutation spectrum was codons 32, 33, 34, 35, 41, and 45, consistent with the previous reports. Furthermore, β‐catenin mutations were particularly frequent in Tg mice with H. pylori infection. Tumor multiplicity was also increased in Tg mice with H. pylori infection, indicating the possibility that H. pylori infection in addition to COX‐2/mPGES‐1 expression might contribute to progression of gastric adenocarcinomas though β‐catenin gene alternations at least in part. In humans, stomach cancers with intestinal differentiation markers feature more β‐catenin mutations compared to those with gastric markers.( 19 ) Furthermore, intestinal markers may be induced only in stomach tumors in H. pylori‐infected gerbils.( 54 ) Thus, alteration of β‐catenin could be related to H. pylori infection, although further work is needed to reveal interactions between these two factors.
β‐Catenin accumulation without β‐catenin gene mutations was detected in some tumors in the present study, indicating involvement of other alterations of Wnt pathway regulatory genes. Indeed, there have been a large number of previous reports suggesting that APC gene mutation,( 17 , 55 , 56 , 57 , 58 , 59 , 60 , 61 ) APC loss of heterozygosity,( 59 ) over‐expression of various Wnt ligands, and altered frizzled receptors( 62 , 63 , 64 ) may be involved in β‐catenin activation. Furthermore, degradation of E‐cadherin and microsatellite instability might also be responsible for β‐catenin accumulation. In one rodent model, the APC Min/+ mouse which harbors a nonsense mutation at codon 850 of the APC gene, gastric tumors frequently develop with APC loss of heterozygosity.( 50 )
In conclusion, the present study indicated that over‐expression of COX‐2/mPGES‐1 promotes gastric carcinogenesis, especially in the fundic region, further showing the K19‐C2mE Tg mouse to be a new animal model for proximal gastric carcinogenesis. Furthermore Tg mice developed multiple tumors in the pyloric region with H. pylori infection partly with β‐catenin gene mutation and activation. This indicates the risk of multiple or metachronous gastric cancers also in human cases with H. pylori infection and supports the idea to eradicate the bacterium or to suppress inflammatory response for the prevention of secondary malignancies.( 65 )
Acknowledgments
This work was supported in part by a Grant‐in‐Aid for Cancer Research and a Grant‐in‐Aid for the Third‐term Comprehensive 10‐year Strategy for Cancer Control from the Ministry of Health, Labour and Welfare, Japan, and a Grant‐in‐Aid from the Ministry of Education, Culture, Sports, Science and Technology of Japan.
References
- 1. Parsonnet J, Friedman GD, Vandersteen DP et al . Helicobacter pylori infection and the risk of gastric carcinoma. N Engl J Med 1991; 325: 1127–31. [DOI] [PubMed] [Google Scholar]
- 2. Kuipers EJ, Uyterlinde AM, Pena AS et al . Long‐term sequelae of Helicobacter pylori gastritis. Lancet 1995; 345: 1525–8. [DOI] [PubMed] [Google Scholar]
- 3. Sung JJ, Leung WK, Go MY et al . Cyclooxygenase‐2 expression in Helicobacter pylori‐associated premalignant and malignant gastric lesions. Am J Pathol 2000; 157: 729–35. [DOI] [PMC free article] [PubMed] [Google Scholar]
- 4. Oshima H, Oshima M, Inaba K, Taketo MM. Hyperplastic gastric tumors induced by activated macrophages in COX‐2/mPGES‐1 transgenic mice. Embo J 2004; 23: 1669–78. [DOI] [PMC free article] [PubMed] [Google Scholar]
- 5. Hisatsune J, Yamasaki E, Nakayama M et al . Helicobacter pylori VacA enhances prostaglandin E2 production through induction of cyclooxygenase 2 expression via a p38 mitogen‐activated protein kinase/activating transcription factor 2 cascade in AZ‐521 cells. Infect Immun 2007; 75: 4472–81. [DOI] [PMC free article] [PubMed] [Google Scholar]
- 6. Tanigawa T, Watanabe T, Hamaguchi M et al . Anti‐inflammatory effect of two isoforms of COX in H. pylori‐induced gastritis in mice: possible involvement of PGE2. Am J Physiol Gastrointest Liver Physiol 2004; 286: G148–56. [DOI] [PubMed] [Google Scholar]
- 7. Wang MT, Honn KV, Nie D. Cyclooxygenases, prostanoids, and tumor progression. Cancer Metastasis Rev 2007; 26: 525–34. [DOI] [PubMed] [Google Scholar]
- 8. Oshima H, Matsunaga A, Fujimura T, Tsukamoto T, Taketo MM, Oshima M. Carcinogenesis in mouse stomach by simultaneous activation of the Wnt signaling and prostaglandin E2 pathway. Gastroenterology 2006; 131: 1086–95. [DOI] [PubMed] [Google Scholar]
- 9. Kikuchi A. Modulation of Wnt signaling by Axin and Axil. Cytokine Growth Factor Rev 1999; 10: 255–65. [DOI] [PubMed] [Google Scholar]
- 10. Akiyama T. Wnt/beta‐catenin signaling. Cytokine Growth Factor Rev 2000; 11: 273–82. [DOI] [PubMed] [Google Scholar]
- 11. Sasaki Y, Morimoto I, Kusano M et al . Mutational analysis of the beta‐catenin gene in gastric carcinomas. Tumour Biol 2001; 22: 123–30. [DOI] [PubMed] [Google Scholar]
- 12. Woo DK, Kim HS, Lee HS, Kang YH, Yang HK, Kim WH. Altered expression and mutation of beta‐catenin gene in gastric carcinomas and cell lines. Int J Cancer 2001; 95: 108–13. [DOI] [PubMed] [Google Scholar]
- 13. Clements WM, Wang J, Sarnaik A et al . Beta‐Catenin mutation is a frequent cause of Wnt pathway activation in gastric cancer. Cancer Res 2002; 62: 3503–6. [PubMed] [Google Scholar]
- 14. Ohene‐Abuakwa Y, Noda M, Perenyi M et al . Expression of the E‐cadherin/catenin (alpha‐, beta‐, and gamma‐) complex correlates with the macroscopic appearance of early gastric cancer. J Pathol 2000; 192: 433–9. [DOI] [PubMed] [Google Scholar]
- 15. Miyazawa K, Iwaya K, Kuroda M et al . Nuclear accumulation of beta‐catenin in intestinal‐type gastric carcinoma: correlation with early tumor invasion. Virchows Arch 2000; 437: 508–13. [DOI] [PubMed] [Google Scholar]
- 16. Tong JH, To KF, Ng EK et al . Somatic beta‐catenin mutation in gastric carcinoma – an infrequent event that is not specific for microsatellite instability. Cancer Lett 2001; 163: 125–30. [DOI] [PubMed] [Google Scholar]
- 17. Ebert MP, Fei G, Kahmann S et al . Increased beta‐catenin mRNA levels and mutational alterations of the APC and beta‐catenin gene are present in intestinal‐type gastric cancer. Carcinogenesis 2002; 23: 87–91. [DOI] [PubMed] [Google Scholar]
- 18. Tsukamoto T, Fukami H, Yamanaka S et al . Hexosaminidase‐altered aberrant crypts, carrying decreased hexosaminidase alpha and beta subunit mRNAs, in colon of 1,2‐dimethylhydrazine‐treated rats. Jpn J Cancer Res 2001; 92: 109–18. [DOI] [PMC free article] [PubMed] [Google Scholar]
- 19. Ogasawara N, Tsukamoto T, Mizoshita T et al . Mutations and nuclear accumulation of beta‐catenin correlate with intestinal phenotypic expression in human gastric cancer. Histopathology 2006; 49: 612–21. [DOI] [PubMed] [Google Scholar]
- 20. Tsukamoto T, Yamamoto M, Ogasawara N et al . Beta‐Catenin mutations and nuclear accumulation during progression of rat stomach adenocarcinomas. Cancer Sci 2003; 94: 1046–51. [DOI] [PMC free article] [PubMed] [Google Scholar]
- 21. Abraham SC, Nobukawa B, Giardiello FM, Hamilton SR, Wu TT. Fundic gland polyps in familial adenomatous polyposis: neoplasms with frequent somatic adenomatous polyposis coli gene alterations. Am J Pathol 2000; 157: 747–54. [DOI] [PMC free article] [PubMed] [Google Scholar]
- 22. Tajima Y, Yamazaki K, Makino R et al . Differences in the histological findings, phenotypic marker expressions and genetic alterations between adenocarcinoma of the gastric cardia and distal stomach. Br J Cancer 2007; 96: 631–8. [DOI] [PMC free article] [PubMed] [Google Scholar]
- 23. Shimizu N, Inada K, Nakanishi H et al . Helicobacter pylori infection enhances glandular stomach carcinogenesis in Mongolian gerbils treated with chemical carcinogens. Carcinogenesis 1999; 20: 669–76. [DOI] [PubMed] [Google Scholar]
- 24. Sugiyama A, Maruta F, Ikeno T et al . Helicobacter pylori infection enhances N‐methyl‐N‐nitrosourea‐induced stomach carcinogenesis in the Mongolian gerbil. Cancer Res 1998; 58: 2067–9. [PubMed] [Google Scholar]
- 25. Shimizu N, Inada KI, Tsukamoto T et al . New animal model of glandular stomach carcinogenesis in Mongolian gerbils infected with Helicobacter pylori and treated with a chemical carcinogen. J Gastroenterol 1999; 34 (Suppl 11): 61–6. [PubMed] [Google Scholar]
- 26. Shimizu N, Kaminishi M, Tatematsu M et al . Helicobacter pylori promotes development of pepsinogen‐altered pyloric glands, a preneoplastic lesion of glandular stomach of BALB/c mice pretreated with N‐methyl‐N‐nitrosourea. Cancer Lett 1998; 123: 63–9. [DOI] [PubMed] [Google Scholar]
- 27. Nam KT, Hahm KB, Oh SY et al . The selective cyclooxygenase‐2 inhibitor nimesulide prevents Helicobacter pylori‐associated gastric cancer development in a mouse model. Clin Cancer Res 2004; 10: 8105–13. [DOI] [PubMed] [Google Scholar]
- 28. Nakamura Y, Sakagami T, Yamamoto N et al . Helicobacter pylori does not promote N‐methyl‐N‐nitrosourea‐induced gastric carcinogenesis in SPF C57BL/6 mice. Jpn J Cancer Res 2002; 93: 111–16. [DOI] [PMC free article] [PubMed] [Google Scholar]
- 29. Nozaki K, Shimizu N, Tsukamoto T et al . Reversibility of heterotopic proliferative glands in glandular stomach of Helicobacter pylori‐infected Mongolian gerbils on eradication. Jpn J Cancer Res 2002; 93: 374–81. [DOI] [PMC free article] [PubMed] [Google Scholar]
- 30. Tatematsu M, Tsukamoto T, Mizoshita T. Role of Helicobacter pylori in gastric carcinogenesis: the origin of gastric cancers and heterotopic proliferative glands in Mongolian gerbils. Helicobacter 2005; 10: 97–106. [DOI] [PubMed] [Google Scholar]
- 31. Hatakeyama M. SagA of CagA in Helicobacter pylori pathogenesis. Curr Opin Microbiol 2008; 11: 30–7. [DOI] [PubMed] [Google Scholar]
- 32. Correa P, Houghton J. Carcinogenesis of Helicobacter pylori . Gastroenterology 2007; 133: 659–72. [DOI] [PubMed] [Google Scholar]
- 33. Kurth I, Willimann K, Schaerli P, Hunziker T, Clark‐Lewis I, Moser B. Monocyte selectivity and tissue localization suggests a role for breast and kidney‐expressed chemokine (BRAK) in macrophage development. J Exp Med 2001; 194: 855–61. [DOI] [PMC free article] [PubMed] [Google Scholar]
- 34. Cao X, Tsukamoto T, Nozaki K et al . Severity of gastritis determines glandular stomach carcinogenesis in Helicobacter pylori‐infected Mongolian gerbils. Cancer Sci 2007; 98: 478–83. [DOI] [PMC free article] [PubMed] [Google Scholar]
- 35. Ushikubi F, Hirata M, Narumiya S. Molecular biology of prostanoid receptors; an overview. J Lipid Med Cell Signal 1995; 12: 343–59. [DOI] [PubMed] [Google Scholar]
- 36. Coleman RA, Smith WL, Narumiya S. International Union of Pharmacology classification of prostanoid receptors: properties, distribution, and structure of the receptors and their subtypes. Pharmacol Rev 1994; 46: 205–29. [PubMed] [Google Scholar]
- 37. Wang D, Dubois RN. Prostaglandins and cancer. Gut 2006; 55: 115–22. [DOI] [PMC free article] [PubMed] [Google Scholar]
- 38. Kitamura T, Itoh M, Noda T et al . Combined effects of prostaglandin E receptor subtype EP1 and subtype EP4 antagonists on intestinal tumorigenesis in adenomatous polyposis coli gene knockout mice. Cancer Sci 2003; 94: 618–21. [DOI] [PMC free article] [PubMed] [Google Scholar]
- 39. Sonoshita M, Takaku K, Sasaki N et al . Acceleration of intestinal polyposis through prostaglandin receptor EP2 in Apc (Delta 716) knockout mice. Nat Med 2001; 7: 1048–51. [DOI] [PubMed] [Google Scholar]
- 40. Mutoh M, Watanabe K, Kitamura T et al . Involvement of prostaglandin E receptor subtype EP(4) in colon carcinogenesis. Cancer Res 2002; 62: 28–32. [PubMed] [Google Scholar]
- 41. Watanabe K, Kawamori T, Nakatsugi S et al . Role of the prostaglandin E receptor subtype EP1 in colon carcinogenesis. Cancer Res 1999; 59: 5093–6. [PubMed] [Google Scholar]
- 42. Chang SH, Liu CH, Conway R et al . Role of prostaglandin E2‐dependent angiogenic switch in cyclooxygenase 2‐induced breast cancer progression. Proc Natl Acad Sci USA 2004; 101: 591–6. [DOI] [PMC free article] [PubMed] [Google Scholar]
- 43. Amano H, Hayashi I, Endo H et al . Host prostaglandin E(2)‐EP3 signaling regulates tumor‐associated angiogenesis and tumor growth. J Exp Med 2003; 197: 221–32. [DOI] [PMC free article] [PubMed] [Google Scholar]
- 44. Sheng H, Shao J, Washington MK, DuBois RN. Prostaglandin E2 increases growth and motility of colorectal carcinoma cells. J Biol Chem 2001; 276: 18075–81. [DOI] [PubMed] [Google Scholar]
- 45. Buchanan FG, Wang D, Bargiacchi F, DuBois RN. Prostaglandin E2 regulates cell migration via the intracellular activation of the epidermal growth factor receptor. J Biol Chem 2003; 278: 35451–7. [DOI] [PubMed] [Google Scholar]
- 46. Pai R, Soreghan B, Szabo IL, Pavelka M, Baatar D, Tarnawski AS. Prostaglandin E2 transactivates EGF receptor: a novel mechanism for promoting colon cancer growth and gastrointestinal hypertrophy. Nat Med 2002; 8: 289–93. [DOI] [PubMed] [Google Scholar]
- 47. Wang D, Buchanan FG, Wang H, Dey SK, DuBois RN. Prostaglandin E2 enhances intestinal adenoma growth via activation of the Ras‐mitogen‐activated protein kinase cascade. Cancer Res 2005; 65: 1822–9. [DOI] [PubMed] [Google Scholar]
- 48. Takasu S, Tsukamoto T, Ushijima T et al . Cyclin D1 overexpression in N‐methyl‐N′‐nitro‐N‐nitrosoguanidine‐induced rat gastric adenocarcinomas. Exp Toxicol Pathol 2007; 59: 171–5. [DOI] [PubMed] [Google Scholar]
- 49. Boettiger D. Interaction of oncogenes with differentiation programs. Curr Top Microbiol Immunol 1989; 147: 31–78. [DOI] [PubMed] [Google Scholar]
- 50. Tomita H, Yamada Y, Oyama T et al . Development of gastric tumors in Apc (Min/+) mice by the activation of the beta‐catenin/Tcf signaling pathway. Cancer Res 2007; 67: 4079–87. [DOI] [PubMed] [Google Scholar]
- 51. Cao X, Tsukamoto T, Nozaki K et al . Beta‐catenin gene alteration in glandular stomach adenocarcinomas in N‐methyl‐N‐nitrosourea‐treated and Helicobacter pylori‐infected Mongolian gerbils. Cancer Sci 2004; 95: 487–90. [DOI] [PMC free article] [PubMed] [Google Scholar]
- 52. Shimizu M, Suzui M, Moriwaki H, Mori H, Yoshimi N. No involvement of beta‐catenin gene mutation in gastric carcinomas induced by N‐methyl‐N‐nitrosourea in male F344 rats. Cancer Lett 2003; 195: 147–52. [DOI] [PubMed] [Google Scholar]
- 53. Park WS, Oh RR, Park JY et al . Frequent somatic mutations of the beta‐catenin gene in intestinal‐type gastric cancer. Cancer Res 1999; 59: 4257–60. [PubMed] [Google Scholar]
- 54. Mizoshita T, Tsukamoto T, Takenaka Y et al . Gastric and intestinal phenotypes and histogenesis of advanced glandular stomach cancers in carcinogen‐treated, Helicobacter pylori‐infected Mongolian gerbils. Cancer Sci 2006; 97: 38–44. [DOI] [PMC free article] [PubMed] [Google Scholar]
- 55. Endoh Y, Sakata K, Tamura G et al . Cellular phenotypes of differentiated‐type adenocarcinomas and precancerous lesions of the stomach are dependent on the genetic pathways. J Pathol 2000; 191: 257–63. [DOI] [PubMed] [Google Scholar]
- 56. Maesawa C, Tamura G, Suzuki Y et al . The sequential accumulation of genetic alterations characteristic of the colorectal adenoma‐carcinoma sequence does not occur between gastric adenoma and adenocarcinoma. J Pathol 1995; 176: 249–58. [DOI] [PubMed] [Google Scholar]
- 57. Horii A, Nakatsuru S, Miyoshi Y et al . The APC gene, responsible for familial adenomatous polyposis, is mutated in human gastric cancer. Cancer Res 1992; 52: 3231–3. [PubMed] [Google Scholar]
- 58. Lee JH, Abraham SC, Kim HS et al . Inverse relationship between APC gene mutation in gastric adenomas and development of adenocarcinoma. Am J Pathol 2002; 161: 611–18. [DOI] [PMC free article] [PubMed] [Google Scholar]
- 59. Lea IA, Jackson MA, Li X, Bailey S, Peddada SD, Dunnick JK. Genetic pathways and mutation profiles of human cancers: site‐ and exposure‐specific patterns. Carcinogenesis 2007; 28: 1851–8. [DOI] [PMC free article] [PubMed] [Google Scholar]
- 60. Tamura G, Sato K, Akiyama S et al . Molecular characterization of undifferentiated‐type gastric carcinoma. Lab Invest 2001; 81: 593–8. [DOI] [PubMed] [Google Scholar]
- 61. Nakatsuru S, Yanagisawa A, Ichii S et al . Somatic mutation of the APC gene in gastric cancer: frequent mutations in very well differentiated adenocarcinoma and signet‐ring cell carcinoma. Hum Mol Genet 1992; 1: 559–63. [DOI] [PubMed] [Google Scholar]
- 62. To KF, Chan MW, Leung WK et al . Alterations of frizzled (FzE3) and secreted frizzled related protein (hsFRP) expression in gastric cancer. Life Sci 2001; 70: 483–9. [DOI] [PubMed] [Google Scholar]
- 63. Kirikoshi H, Sekihara H, Katoh M. Up‐regulation of WNT10A by tumor necrosis factor alpha and Helicobacter pylori in gastric cancer. Int J Oncol 2001; 19: 533–6. [PubMed] [Google Scholar]
- 64. Katoh M, Kirikoshi H, Terasaki H, Shiokawa K. WNT2B2 mRNA, up‐regulated in primary gastric cancer, is a positive regulator of the WNT‐beta‐catenin‐TCF signaling pathway. Biochem Biophys Res Commun 2001; 289: 1093–8. [DOI] [PubMed] [Google Scholar]
- 65. Fukase K, Kato M, Kikuchi S et al . Effect of eradication of Helicobacter pylori on incidence of metachronous gastric carcinoma after endoscopic resection of early gastric cancer: an open‐label, randomised controlled trial. Lancet 2008; 372: 392–7. [DOI] [PubMed] [Google Scholar]