

Abstract
The UGT1A7 gene encodes UDP‐glucuronosyltransferase, a key enzyme catalyzing the glucuronidation of various carcinogens. In this study, we investigated the association between haplotypes of the whole UGT1A7 gene and the risk of hepatocellular carcinoma (HCC) in patients with chronic hepatitis B. Sequence analysis of exon1 and the promoter region of the UGT1A7 gene was carried out to determine haplotype profiles for 244 patients with hepatocellular carcinoma, 223 hepatitis B carriers, and 314 healthy control subjects. Hepatitis B carriers with haplotypes other than haplotype 1 (Ht1; CTCTCGTG at –341, –57, 33, 387, 391, 392, 622, and 756) had a significantly greater risk of developing HCC with odds ratios (OR) of 1.67 (95% confidence interval [CI]; 1.11–2.52) for Ht1/others and 1.85 (95% CI; 1.09–3.14) for others/others. In multivariate logistic regression analysis including age and haplotypes from Ht1 to Ht4, the presence of Ht2 (CGAGAACG) or Ht4 (CTCGAATG) was associated with HCC risk (OR = 1.45 [95% CI; 1.03–2.03] and 4.95 [95% CI; 1.75–13.98], respectively). The results of this study show that the UGT1A7 haplotype is a suitable susceptibility marker for the development of HCC in hepatitis B carriers. (Cancer Sci 2008; 99: 340–344)
Hepatitis B virus (HBV) infection is a global public health problem with more than 350 million carriers worldwide.( 1 ) The clinical course of HBV infection has a broad spectrum from spontaneous recovery after acute hepatitis, to chronic persistent infection, liver cirrhosis, and hepatocellular carcinoma (HCC).( 2 ) As HCC is the fifth most common malignancy worldwide and has a poor prognosis( 3 ) the identification of patients with HBV carrier status at risk of developing HCC is clinically important. Multiple risk factors, including hepatitis C (HCV) infection, carcinogen exposure (such as aflatoxin B1), excessive alcohol intake, and genetic factors, contribute to the development of HCC.( 4 ) Among genetic factors, polymorphisms within the regulatory and coding region of xenobiotic metabolism enzymes are candidates for identifying the risk of developing HCC as a result of chronic HBV infection.( 4 )
The human UDP‐glucuronosyltransferase (UGT) superfamily of enzymes catalyze the glucuronidation of a diverse range of compounds, including endogenous metabolites (e.g. bilirubin and steroid hormones), therapeutic drugs, and various classes of chemical carcinogens (e.g. heterocyclic and polycyclic hydrocarbons, and heterocyclic amines).( 5 , 6 , 7 ) As a result of this function, UGTs play a major role in cellular defense and detoxification. The UGT1A locus is clustered on chromosome 2q37 and is estimated to span 200 kb. By an exon sharing mechanism, the specific first exon transcript of each UGT1A gene is spliced to common exons 2–5.( 8 , 9 )
Investigations into the genetic link between cancer and UGT1A gene polymorphisms are based on findings that UGT activity is modulated by specific mutations.( 10 , 11 , 12 ) Polymorphisms within UGT1A7 are of interest as this gene is expressed in the esophagus, stomach, and colon, the entry sites for xenobiotic compounds into the human body.( 13 , 14 , 15 , 16 , 17 ) Although the association between HCC and polymorphisms in UGT1A7 has been reported( 18 , 19 , 20 ) these studies consider only the genotype rather than the whole UGT1A7 gene haplotype. In the present study we identified the haplotype at risk of developing HCC as a result of chronic HBV infection by carrying out direct sequence analysis of the promoter region and exon 1 of UGT1A7.
Materials and Methods
Healthy controls, HBV carriers, and patients with HCC. The present study included 781 unrelated adult Koreans who attended the Samsung Medical Center (Seoul, Korea). Healthy controls and HBV carriers were gathered consecutively from the Health Promotion Center between January and May 2000, and between January 2000 and December 2002, respectively. HCC patients who gave informed consent and attended the Samsung Medical Center's outpatient clinics of gastroenterology from April 2001 to October 2004 were included in the present study. The study was restricted to male subjects to exclude the effect of sex. Subjects positive for anti‐HCV and anti‐HIV were excluded from the study.
Healthy controls (median age 49 years, range 35–72 years) included 314 subjects with no previous history of hepatic disorders or apparent disease on medical examination. Subjects showing elevated levels of aspartate aminotransferase (AST) and alanine aminotransferase (ALT), alkaline phosphatase, and gamma glutamyl‐transferase were excluded from the study. All healthy controls were negative for hepatitis B surface antigen (HBsAg).
The HBV carrier group (median age 49 years, range 32–72 years) included 223 subjects positive for HBsAg and the antihepatitis B core antibody for more than 6 months. Of these, 170 subjects were asymptomatic carriers with normal serum levels of AST and ALT, and 47 subjects were classified with chronic HBV infection with a chronic parenchymal disease pattern identified by ultrasonography (US) or fluctuations of AST and ALT over 2‐fold the upper normal level during the year before recruitment. The remaining six subjects showed liver cirrhosis by US.
The HCC group (median age 54 years, range 27–97 years) comprised of 244 subjects positive for HBsAg and diagnosed with HCC. A diagnosis of HCC was based on cytological or pathological examinations or positive angiogram, US, or computed tomography images combined with serum α‐fetoprotein levels greater than 400 ng/mL. Among the HCC patients, 207 patients had liver cirrhosis based on clinical evaluation and radiological investigations.
Clinical variables including age (or age group, represented in Table 1), alcohol consumption, and smoking status were reviewed. The alcohol intake and smoking status of patients was classified as either ‘ever’ or ‘never’.
Table 1.
Demographic characteristics of healthy controls, hepatitis B virus (HBV) carriers, and patients with HBV‐related hepatocellular carcinoma (HCC) who participated in this study
| Variables | Groups | Controls (n = 314) No. (%) | HBV carriers (n = 223) No. (%) | HCC patients (n = 244) No. (%) |
|---|---|---|---|---|
| Age (years) | Mean ± SD | 49.8 ± 5.3 | 49.2 ± 7.5 | 52.7 ± 9.1 |
| 20–29 | 0 (0.0) | 0 (0.0) | 1 (0.4) | |
| 30–39 | 4 (1.3) | 21 (9.4) | 13 (5.3) | |
| 40–49 | 161 (51.3) | 99 (44.4) | 67 (27.5) | |
| 50–59 | 132 (42.0) | 83 (37.2) | 96 (39.3) | |
| 60–69 | 17 (5.4) | 19 (8.5) | 57 (23.4) | |
| 70–79 | 0 (0.0) | 1 (0.4) | 10 (4.1) | |
| Cigarette smoking | Never | 44 (14.0) | 45 (20.2) | 89 (36.5) |
| Ever | 219 (69.7) | 138 (61.9) | 131 (53.7) | |
| Unknown | 51 (16.2) | 40 (17.9) | 24 (9.8) | |
| Alcohol intake | Never | 7 (2.2) | 13 (5.8) | 3 (1.2) |
| Ever | 252 (80.3) | 169 (75.8) | 217 (88.9) | |
| Unknown | 55 (17.5) | 41 (18.4) | 24 (9.8) | |
| Liver cirrhosis | No | 314 (100.0) | 217 (97.3) | 37 (15.2) |
| Yes | 0 (0.0) | 6 (2.7) | 207 (84.8) |
SD, standard deviation.
Chemistry and viral marker tests. Blood samples were collected into a serum separating tube. The following biochemical assays were carried out with a Hitachi 747 system (Hitachi, Tokyo, Japan): serum total‐bilirubin; AST; ALT; alkaline phosphatase; and gamma glutamyl‐transferase. Testing for HBsAg, hepatitis B surface antibody, antihepatitis B core antibody, and anti‐HCV was carried out using a microparticle enzyme immunoassay using the AxSym automated immunoassay system (Abbott Laboratories, Abbott Park, IL).
DNA samples and DNA pools. Genomic DNA was isolated from peripheral blood leukocytes using the Wizard Genomic DNA Purification kit following the manufacturer's instructions (Promega, Madison, WI). The DNA concentration of each sample was measured using the GeneQuant DNA/RNA calculator (Pharmacia, UK). Samples were diluted to 1 mg/L DNA with Tris–EDTA buffer (pH 8.0, 10 mM Tris‐HCl, 1 mM EDTA).
Polymerase chain reaction (PCR) and sequencing. Exon 1 and the promoter region, extending to –500 bp from the ATG, of the UGT1A7 gene were amplified using specific primers. The PCR reaction mixture (10 µL) contained 1.0 µL of 10 × PCR buffer (100 mM Tris‐HCl, 15 mM MgCl2, and 500 mM KCl, pH 8.3; Genemed, Pittsburgh, PA), 200 nM each dNTP (Genemed), 0.4 µM each primer (Bioneer, Chungwon, Korea), 1 U Taq DNA polymerase (Genemed), and 100 ng of genomic DNA. The reaction was carried out with a thermal cycler (model 9600; Applied Biosystems, Foster City, CA) using a 5 min preincubation at 95°C followed by 35 cycles of 40 s denaturation at 95°C, 40 s annealing at 63°C, and 60 s extension at 72°C. An additional 5 min extension at 72°C was carried out after completion of the cycles.
Amplified DNA (1.5 µL) was treated with 0.4 U shrimp alkaline phosphatase and 2 U exonuclease I (USB, Cleveland, OH) at 37°C for 15 min followed by inactivation at 80°C for 15 min. Sequencing was carried out with a BigDye Terminator Cycle Sequencing Ready Reaction kit, version 3.0 (Applied Biosystems) on an automated ABI Prism 3100 Genetic Analyzer (Applied Biosystems).
Statistical analysis of individual genotypes. The χ2‐test or Fisher's exact test was used to determine the statistical significance of differences in allele frequencies of the UGT1A7 gene between the three groups (control, HBV carrier, and HCC patients). The Hardy–Weinberg equilibrium was applied to the healthy control group using the χ2‐test. The haplotype was analyzed using PHASE software version 2.1.( 21 , 22 ) Linkage disequilibrium between UGT1A7 gene polymorphisms was determined using the Haploview program version 3.2.( 23 ) Genotype data was analyzed and odds ratios (ORs) for HCC and 95% confidence intervals (CI) were estimated by logistic regression analysis. Multivariate logistic regression analysis considering age and haplotypes was carried out.( 24 ) In the multivariate logistic regression model, age was considered as an ordinal variable beginning with age group 20–29 years and ending with age group 70–79 years, or as a numeric variable.
Statistical analyses were carried out using STATA software version 9.1 (StataCorp LP, College Station, TX). All tests were based on a two‐sided probability.
Results
Clinical characteristics of the subjects. The present study included 314 healthy controls, 223 HBV carriers, and 244 HCC patients (Table 1). The mean age of the HBV carrier and control groups was similar, whereas the mean age of the HCC patient group was higher (P < 0.01). The frequency of cigarette smoking was greater in the healthy control group (70%) than in the HBV carrier (62%) and HCC patient (54%) groups. Liver cirrhosis was found in 207 HCC patients (84.8%) and in six HBV carriers (2.7%). Of the remaining HBV carriers, 170 (76.2%) were asymptomatic carriers and 47 (21.1%) were diagnosed with chronic hepatitis determined by US findings and clinical data.
Genotypes of UGT1A7. Eight polymorphisms were detected in the promoter region and exon 1 of UGT1A7; these included c.–341C>T, c.–57T>G, c.33C>A, c.387T>G, c.391C>A, c.392G>A, c.622T>C, and c.756G>A. The frequencies of UGT1A7 genotypes are shown in Table 2. All genotype frequencies followed the Hardy–Weinberg equilibrium in healthy controls. Four polymorphisms were at an amino acid change locus (c.387T>G; p.N129K, c.391C>A and c.392G>A; p.R131K, c.622T>C; p.W208R). The four UGT1A7 alleles were designated as UGT1A7*1 (wild‐type), UGT1A7*2 (c.387T>G, c.391C>A, and c.392G>A), UGT1A7*3 (c.387T>G, c.391C>A, c.392G>A, and c.622T>C), and UGT1A7*4 (c.622T>C) according to a previous study.( 11 ) PHASE analysis revealed a total of 13 haplotypes with only four occurring at a frequency greater than 1% (Table 3). These four haplotypes were analyzed with respect to their association with HBV‐related HCC risk in multivariate logistic regression. The association of haplotype with allele type was as follows: UGT1A7*1 for haplotypes 1, 6, 10, and 13; UGT1A7*2 for haplotypes 3, 4, 5, 7, 9, and 11; and UGT1A7*3 for haplotypes 2, 8, and 12. When the entire UGT1A7 gene is considered as a whole, different haplotypes are present in the same allele type. There was strong linkage disequilibrium (correlation coefficient, r 2 = 0.965; Lewontin's D′, D′ = 1.0) from –341 to 756, and a single block was observed from –341 to 622 (Fig. 1) using Haploview analysis.
Table 2.
Genotype frequency of UDP‐glucuronosyltransferase UGT1A7 gene in healthy controls, hepatitis B virus (HBV) carriers, and patients with HBV‐related hepatocellular carcinoma (HCC) who participated in this study
| Position | Genotype | Controls No. (%) | HBV carriers No. (%) | HCC patients No. (%) |
|---|---|---|---|---|
| –341 | CC | 235 (74.8) | 165 (74.0) | 165 (67.6) |
| CT | 77 (24.6) | 53 (23.8) | 76 (31.1) | |
| TT | 2 (0.6) | 5 (2.2) | 3 (1.2) | |
| –57 | TT | 163 (51.9) | 137 (61.4) | 134 (54.9) |
| TG | 127 (40.4) | 75 (33.6) | 96 (39.3) | |
| GG | 24 (7.6) | 11 (4.9) | 14 (5.7) | |
| 33 | CC | 176 (56.1) | 137 (61.4) | 135 (55.3) |
| CA | 119 (37.9) | 76 (34.1) | 97 (39.8) | |
| AA | 19 (6.1) | 10 (4.5) | 12 (4.9) | |
| 387 | TT | 107 (34.1) | 90 (40.4) | 69 (28.3) |
| TG | 158 (50.3) | 100 (44.8) | 126 (51.6) | |
| GG | 49 (15.6) | 33 (14.8) | 49 (20.1) | |
| 391 | CC | 107 (34.1) | 90 (40.4) | 69 (28.3) |
| AC | 158 (50.3) | 100 (44.8) | 126 (51.6) | |
| AA | 49 (15.6) | 33 (14.8) | 49 (20.1) | |
| 392 | GG | 107 (34.1) | 90 (40.4) | 69 (28.3) |
| GA | 158 (50.3) | 100 (44.8) | 126 (51.6) | |
| AA | 49 (15.6) | 33 (14.8) | 49 (20.1) | |
| 622 | TT | 175 (55.7) | 139 (62.3) | 135 (55.3) |
| TC | 120 (38.2) | 74 (33.2) | 96 (39.3) | |
| CC | 19 (6.1) | 10 (4.5) | 13 (5.3) | |
| 756 | GG | 233 (74.2) | 161 (72.2) | 165 (67.6) |
| GA | 79 (25.2) | 56 (25.1) | 76 (31.1) | |
| AA | 2 (0.6) | 6 (2.7) | 3 (1.2) |
Table 3.
Frequency of UGT1A7 haplotypes in healthy controls, hepatitis B virus (HBV) carriers, and patients with HBV‐related hepatocellular carcinoma (HCC) who participated in this study
| Haplotype (Ht; nucleotide at –341, –57, 33, 387, 391, 392, 622, and 756 locus) | Allele type | Controls No. (%) | HBV carriers No. (%) | HCC patients No. (%) |
|---|---|---|---|---|
| Ht1: CTCTCGTG | *1 | 368 (58.6) | 277 (62.1) | 262 (53.7) |
| Ht2: CGAGAACG | *3 | 156 (24.8) | 93 (20.9) | 121 (24.8) |
| Ht3: TTCGAATA | *2 | 71 (11.3) | 62 (13.9) | 78 (16.6) |
| Ht4: CTCGAATG | *2 | 14 (2.2) | 5 (1.1) | 12 (4.1) |
| Ht5: TGCGAATA | *2 | 10 (1.6) | 0 (0.0) | 1 (0.2) |
| Ht6: CGCTCGTG | *1 | 4 (0.6) | 1 (0.2) | 2 (0.4) |
| Ht7: CTCGAATA | *2 | 0 (0.0) | 3 (0.7) | 0 (0.0) |
| Ht8: CGCGAACG | *3 | 2 (0.3) | 0 (0.0) | 1 (0.2) |
| Ht9: CGAGAATG | *2 | 1 (0.2) | 2 (0.4) | 0 (0.0) |
| Ht10: CTCTCGTA | *1 | 0 (0.0) | 1 (0.2) | 0 (0.0) |
| Ht11: CGCGAATA | *2 | 2 (0.3) | 0 (0.0) | 0 (0.0) |
| Ht12: CGAGAACA | *3 | 0 (0.0) | 1 (0.2) | 0 (0.0) |
| Ht13: TTCTCGTA | *1 | 0 (0.0) | 1 (0.2) | 0 (0.0) |
Figure 1.
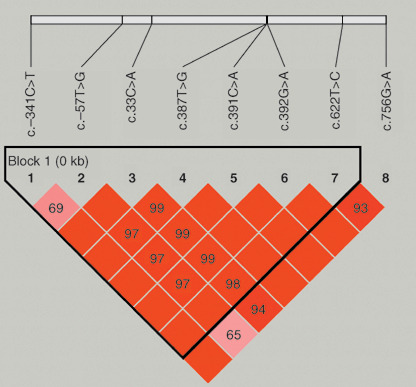
Linkage disequilibrium (LD) pattern for the UGT1A7 gene in 781 unrelated subjects. Haplotype block structure, as depicted by Haploview software program version 3.2, is shown. The numbers in boxes indicate pair‐wise D′ values and the box color changes (orange to red) are according to increasing D′ values. Bright red represents strong LD.
Association between UGT1A7 haplotype and HCC. As the age of HCC patients was significantly different from healthy controls, we examined the genotype frequency of each age group to assess the age effect. We found no correlation between gene frequency and age in healthy controls.
The association of genotype in each polymorphic locus for HCC patients with controls and HBV carriers was assessed and ORs are represented in Table 4. The frequency of polymorphisms at 387, 391, and 392 was significantly different between the HBV carrier and HCC patient groups (P = 0.02 and 0.02, heterozygous and homo‐variant, respectively). The difference of frequency of genotype was prominent from 50 to 59 years of age when we stratified the age groups. The frequency of other polymorphisms did not differ significantly between the groups.
Table 4.
Odds ratio (OR) and 95% confidence intervals (CI) of UGT1A7 genotype for hepatocellular carcinoma (HCC)
| Position | Genotype | OR1 (95% CI) | P1 | OR2 (95% CI) | P 2 |
|---|---|---|---|---|---|
| –341 | CC | 1.00 (reference) | 1.00 (reference) | ||
| CT | 1.41 (0.97–2.04) | 0.07 | 1.43 (0.95–2.16) | 0.09 | |
| TT | 2.14 (0.35–12.9) | 0.41 | 0.6 (0.14–2.55) | 0.49 | |
| –57 | TT | 1.00 (reference) | 1.00 (reference) | ||
| TG | 0.91 (0.64–1.29) | 0.60 | 1.30 (0.88–1.90) | 0.19 | |
| GG | 0.76 (0.38–1.51) | 0.43 | 1.39 (0.62–3.15) | 0.42 | |
| 33 | CC | 1.00 (reference) | 1.00 (reference) | ||
| CA | 1.06 (0.75–1.51) | 0.73 | 1.30 (0.88–1.90) | 0.19 | |
| AA | 0.82 (0.39–1.75) | 0.62 | 1.22 (0.51–2.91) | 0.66 | |
| 387 | TT | 1.00 (reference) | 1.00 (reference) | ||
| TG | 1.24 (0.84–1.81) | 0.28 | 1.64 (1.09–2.47) | 0.02 | |
| GG | 1.55 (0.94–2.55) | 0.08 | 1.94 (1.13–3.33) | 0.02 | |
| 391 | CC | 1.00 (reference) | 1.00 (reference) | ||
| AC | 1.24 (0.84–1.81) | 0.28 | 1.64 (1.09–2.47) | 0.02 | |
| AA | 1.55 (0.94–2.55) | 0.08 | 1.94 (1.13–3.33) | 0.02 | |
| 392 | GG | 1.00 (reference) | 1.00 (reference) | ||
| GA | 1.24 (0.84–1.81) | 0.28 | 1.64 (1.09–2.47) | 0.02 | |
| AA | 1.55 (0.94–2.55) | 0.08 | 1.94 (1.13–3.33) | 0.02 | |
| 622 | TT | 1.00 (reference) | 1.00 (reference) | ||
| TC | 1.04 (0.73–1.47) | 0.84 | 1.34 (0.91–1.96) | 0.14 | |
| CC | 0.89 (0.42–1.86) | 0.75 | 1.34 (0.57–3.16) | 0.51 | |
| 756 | GG | 1.00 (reference) | 1.00 (reference) | ||
| GA | 1.36 (0.94–1.97) | 0.11 | 1.32 (0.88–1.99) | 0.18 | |
| AA | 2.12 (0.35–12.81) | 0.41 | 0.49 (0.12–1.98) | 0.32 |
P‐value was calculated by logistic regression analysis. P 1, HCC patients versus control; P 2, HCC patients versus hepatitis B virus (HBV) carrier.
OR and 95% CI of homozygote and heterozygote carriers of the at‐risk allele were determined with reference to homozygotes of the wild‐type allele. OR1, HCC patients versus control; OR2, HCC patients versus HBV carrier.
The ORs for HCC patients increased, except for alleles *2/*2 or *3/*3, when each genotype was compared with UGT1A7 *1/*1 in HBV carriers (Table 5). There was no significant change between the ORs for controls and HCC patients in each allele compared with UGT1A7 *1/*1.
Table 5.
Odds ratio (OR) and 95% confidence intervals (CI) of UGT1A7 allele type or haplotype (Ht) for hepatocellular carcinoma (HCC)
| Controls No. (%) | HBV carriers No. (%) | HCC patients No. (%) | OR 1† (95% CI) | P‐value | |
|---|---|---|---|---|---|
| Allele type | |||||
| *1/*1 | 107 (34.1) | 90 (40.4) | 69 (28.3) | 1.00 (reference) | |
| *1/*2 | 64 (20.4) | 43 (19.3) | 59 (24.2) | 1.79 (1.08–2.96) | 0.023 |
| *1/*3 | 94 (29.9) | 57 (25.6) | 67 (27.5) | 1.53 (0.96–2.46) | 0.076 |
| *2/*2 | 4 (1.2) | 6 (2.7) | 7 (2.9) | 1.52 (0.49–4.73) | 0.468 |
| *2/*3 | 26 (8.3) | 17 (7.6) | 29 (11.9) | 2.23 (1.13–4.37) | 0.020 |
| *3/*3 | 19 (6.1) | 10 (4.5) | 13 (5.3) | 1.70 (0.70–4.10) | 0.241 |
| Allele type | |||||
| *1/*1 | 107 (34.1) | 90 (40.4) | 69 (28.3) | 1.00 (reference) | |
| *1/others | 158 (50.3) | 100 (44.8) | 126 (51.6) | 1.64 (1.09–2.47) | 0.017 |
| Others/others | 49 (15.6) | 33 (14.8) | 49 (20.1) | 1.94 (1.13–3.33) | 0.017 |
| Ht1 | |||||
| Ht1/Ht1 | 106 (33.8) | 90 (40.4) | 69 (28.3) | 1.00 (reference) | |
| Ht1/others | 156 (49.7) | 97 (43.5) | 124 (50.8) | 1.67 (1.11–2.52) | 0.015 |
| Others/others | 52 (16.6) | 36 (16.1) | 51 (20.9) | 1.85 (1.09–3.14) | 0.023 |
HCC patients versus hepatitis B virus (HBV) carriers.
The association between UGT1A7 polymorphisms and enzymatic activity is well established, with the UGT1A7*2, *3, and *4 alleles associated with enzymatic activity lower than the normal or wild‐type levels associated with the UGT1A7*1 allele. On this basis, we analyzed the *1/others allele and others/others alleles compared with the homozygote *1 allele. The proportion of UGT1A7 *1/others and others/others alleles was higher in HCC patients than in HBV carriers (44.8%versus 51.6% and 14.8%versus 20.1%, respectively). The ORs of *1/others was 1.64 (95% CI; 1.09–2.47) and others/others was 1.94 (95% CI; 1.13–3.33). HBV carriers with haplotypes other than the wild‐type homozygous haplotype, Ht1, had an increased risk of developing HCC (OR [95% CI], 1.67 [1.11–2.52] and 1.85 [1.09–3.14] for heterozygous and homo‐variant; P = 0.015 and 0.023, respectively). In multivariate logistic regression analysis including age and haplotyes (Ht1 to Ht4, and other haplotype), the presence of Ht2 or Ht4 was associated with HCC risk (OR [95% CI], 1.45 [1.03–2.03] and 4.95 [1.75–14.0], respectively) (Table 6).
Table 6.
Multivariate logistic regression analysis including age and haplotypes Ht1 to Ht4, to determine the risk of hepatitis B carriers developing hepatocellular carcinoma
| OR1 (95% CI) | OR2 (95% CI) | |
|---|---|---|
| Age | 1.83 (1.47–2.29) | 1.06 (1.04–1.09) |
| Ht1 (*1) | 1.00 (reference) | 1.00 (reference) |
| Ht2 (*3) | 1.45 (1.03–2.03) | 1.44 (1.03–2.02) |
| Ht3 (*2) | 1.37 (0.92–2.03) | 1.34 (0.90–1.99) |
| Ht4 (*2) | 4.95 (1.75–13.98) | 4.56 (1.62–12.87) |
| Other haplotype | 0.38 (0.10–1.41) | 0.36 (0.10–1.38) |
OR1, adjusted age as an ordinal variable beginning with age group 20–29 years and ending with age group 70–79 years; OR2, adjusted age as a numeric variable.
Discussion
The present study reveals that HBV carriers with a UGT1A7 haplotype other than Ht1, the wild‐type homozygous haplotype (CTCTCGTG at –341, –57, 33, 387, 391, 392, 622, and 756), were at an increased risk of developing HCC. In multivariate analysis, the presence of Ht2 (CGAGAACG) or Ht4 (CTCGAATG) was associated with HCC risk (OR = 1.45 [95% CI; 1.03–2.03] and OR = 4.95 [95% CI; 1.75–13.98], respectively). However, Ht3 (OR = 1.37 [95% CI; 0.92–2.03]) did not show increased risk, although Ht3 and Ht4 were classified into same allele type *2. Considering these results, we think the haplotype is a more useful marker for HCC risk than the single polymorphism or allele type.
The healthy control group showed no significant difference in genotype frequency compared with the HCC patient group. This finding indicates that determination of a control group is important in a case‐controlled study assessing genetic polymorphisms as a risk factor. Our result showing a significant difference in genotype frequency between the HBV carrier and HCC patient groups suggests that it is more useful to use HBV carriers as a control group in a study of HBV‐related HCC.
When each genotype was compared with UGT1A7 *1/*1, the OR for HCC patients increased, except for the *2/*2 or *3/*3 genotype. This might be due to the low frequency of *2/*2 or *3/*3 homozygotes. A notable difference between the results of the present study and those reported by studies from Germany and Japan, is the allelic frequency.( 18 , 19 ) In other populations, the *4 allele was observed frequently in HCC patients. In German HCC patients the frequency of the *1/*4 and *3/*4 alleles was 3.4 and 1.7%, respectively. In Japanese patients with HCV‐related HCC the frequency of the *3/*4 and *4/*4 alleles was 4.9 and 1.6%, respectively. In the present study there was no allele type indicating *4 after haplotype analysis. Thus, *2/*4 might not be considered a *1/*3 allele type, which cannot be distinguished by sequencing analysis.
A previous study revealed high ORs of 7–10 for the UGT1A7 gene in HBV‐related HCC.( 18 ) By comparison, the present study revealed a lower OR. This difference might be due to ethnic differences or differences in the underlying cause of HCC. Although the previous study included a particular type of HCC related to alcohol consumption, HBV, and HCV, only HCC‐related HBV was included in the present study. Further investigations of the carcinogens underlying HCC‐related HBV might provide useful information for future studies.
In the present study, the frequency of cigarette smoking was higher in the healthy control group than in the HBV carrier or HCC patient group. Smoking appeared to be a protective factor rather than a risk factor in univariate analysis. Lifestyle modification might be a factor in this case, in that most HBV carriers were diagnosed before they were adults, and for this reason might have chosen not to take up smoking or alcohol.
In summary, the present study investigated the relationship between UGT1A7 gene haplotypes and the risk of developing HCC. The results show that the UGT1A7 haplotype is a suitable susceptibility marker for the development of HCC in HBV carriers.
Acknowledgments
This work was supported by grants from the Korean HapMap Project of the Ministry of Science and Technology, Korea.
References
- 1. Hepatitis B. World Health Organization Fact Sheet No. 204 (Revised October 2000) (Website on the Internet). Geneva: World Health Organization. Available from URL: http://www.who.int/mediacentre/factsheets/fs204/en/. [Google Scholar]
- 2. Lee WM. Hepatitis B virus infection. N Engl J Med 1997; 337: 1733–45. [DOI] [PubMed] [Google Scholar]
- 3. Parkin DM, Bray F, Ferlay J, Pisani P. Global cancer statistics, 2002. CA Cancer J Clin 2005; 55: 74–108. [DOI] [PubMed] [Google Scholar]
- 4. Chen CJ, Yu MW, Liaw YF. Epidemiological characteristics and risk factors of hepatocellular carcinoma. J Gastroenterol Hepatol 1997; 12: S294–308. [DOI] [PubMed] [Google Scholar]
- 5. Fang JL, Beland FA, Doerge DR et al . Characterization of benzo (a) pyrene‐trans‐7,8‐dihydrodiol glucuronidation by human tissue microsomes and overexpressed UDP‐glucuronosyltransferase enzymes. Cancer Res 2002; 62: 1978–86. [PubMed] [Google Scholar]
- 6. Zheng Z, Fang JL, Lazarus P. Glucuronidation: an important mechanism for detoxification of benzo[a]pyrene metabolites in aerodigestive tract tissues. Drug Metab Dispos 2002; 30: 397–403. [DOI] [PubMed] [Google Scholar]
- 7. Strassburg CP, Kneip S, Topp J et al . Polymorphic gene regulation and interindividual variation of UDP‐glucuronosyltransferase activity in human small intestine. J Biol Chem 2000; 275: 36164–71. [DOI] [PubMed] [Google Scholar]
- 8. Strassburg CP, Manns MP, Tukey RH. Expression of the UDP‐glucuronosyltransferase 1A locus in human colon. Identification and characterization of the novel extrahepatic UGT1A8 . J Biol Chem 1998; 273: 8719–26. [DOI] [PubMed] [Google Scholar]
- 9. Fisher MB, Paine MF, Strelevitz TJ, Wrighton SA. The role of hepatic and extrahepatic UDP‐glucuronosyltransferases in human drug metabolism. Drug Metab Rev 2001; 33: 273–97. [DOI] [PubMed] [Google Scholar]
- 10. Ciotti M, Marrone A, Potter C, Owens IS. Genetic polymorphism in the human UGT1A6 (planar phenol) UDP‐glucuronosyltransferase: pharmacological implications. Pharmacogenetics 1997; 7: 485–95. [DOI] [PubMed] [Google Scholar]
- 11. Guillemette C, Ritter JK, Auyeung DJ, Kessler FK, Housman DE. Structural heterogeneity at the UDP‐glucuronosyltransferase 1 locus: functional consequences of three novel missense mutations in the human UGT1A7 gene. Pharmacogenetics 2000; 10: 629–44. [DOI] [PubMed] [Google Scholar]
- 12. Raijmakers MT, Jansen PL, Steegers EA, Peters WH. Association of human liver bilirubin UDP‐glucuronyltransferase activity with a polymorphism in the promoter region of the UGT1A1 gene. J Hepatol 2000; 33: 348–51. [DOI] [PubMed] [Google Scholar]
- 13. Strassburg CP, Nguyen N, Manns MP, Tukey RH. Polymorphic expression of the UDP‐glucuronosyltransferase UGT1A gene locus in human gastric epithelium. Mol Pharmacol 1998; 54: 647–54. [PubMed] [Google Scholar]
- 14. Strassburg CP, Strassburg A, Nguyen N, Li Q, Manns MP, Tukey RH. Regulation and function of family 1 and family 2 UDP‐glucuronosyltransferase genes (UGT1A, UGT2B) in human oesophagus. Biochem J 1999; 338: 489–98. [PMC free article] [PubMed] [Google Scholar]
- 15. Strassburg CP, Nguyen N, Manns MP, Tukey RH. UDP‐glucuronosyltransferase activity in human liver and colon. Gastroenterology 1999; 116: 149–60. [DOI] [PubMed] [Google Scholar]
- 16. Strassburg CP, Vogel A, Kneip S, Tukey RH, Manns MP. Polymorphisms of the human UDP‐glucuronosyltransferase (UGT) 1A7 gene in colorectal cancer. Gut 2002; 50: 851–6. [DOI] [PMC free article] [PubMed] [Google Scholar]
- 17. Ockenga J, Vogel A, Teich N, Keim V, Manns MP, Strassburg CP. UDP glucuronosyltransferase (UGT1A7) gene polymorphisms increase the risk of chronic pancreatitis and pancreatic cancer. Gastroenterology 2003; 124: 1802–8. [DOI] [PubMed] [Google Scholar]
- 18. Vogel A, Kneip S, Barut A et al . Genetic link of hepatocellular carcinoma with polymorphisms of the UDP‐glucuronosyltransferase UGT1A7 gene. Gastroenterology 2001; 121: 1136–44. [DOI] [PubMed] [Google Scholar]
- 19. Wang Y, Kato N, Hoshida Y et al . UDP‐glucuronosyltransferase 1A7 genetic polymorphisms are associated with hepatocellular carcinoma in Japanese patients with hepatitis C virus infection. Clin Cancer Res 2004; 10: 2441–6. [DOI] [PubMed] [Google Scholar]
- 20. Tseng CS, Tang KS, Lo HW, Ker CG, Teng HC, Huang CS. UDP‐glucuronosyltransferase 1A7 genetic polymorphisms are associated with hepatocellular carcinoma risk and onset age. Am J Gastroenterol 2005; 100: 1758–63. [DOI] [PubMed] [Google Scholar]
- 21. Stephens M, Smith NJ, Donnelly P. A new statistical method for haplotype reconstruction from population data. Am J Hum Genet 2001; 68: 978–89. [DOI] [PMC free article] [PubMed] [Google Scholar]
- 22. Stephens M, Scheet P. Accounting for decay of linkage disequilibrium in haplotype inference and missing‐data imputation. Am J Hum Genet 2005; 76: 449–62. [DOI] [PMC free article] [PubMed] [Google Scholar]
- 23. Barrett JC, Fry B, Maller J, Daly MJ, Haploview. analysis and visualization of LD and haplotype maps. Bioinformatics 2005; 21: 263–5. [DOI] [PubMed] [Google Scholar]
- 24. Wallenstein S, Hodge SE, Weston A. Logistic regression model for analyzing extended haplotype data. Genetic Epidemiol 1998; 15: 173–81. [DOI] [PubMed] [Google Scholar]