

Abstract
Invariant natural killer T (iNKT) cells possess potent antitumor effects after activation with a specific glycolipid antigen, α‐galactosylceramide (αGalCer). A phase I–II clinical study of αGalCer‐pulsed dendritic cells (DC) to activate endogenous iNKT cells was previously performed in patients with non‐small‐cell lung cancer (NSCLC). In this clinical trial, the patients with increased interferon‐γ (IFN‐γ) production (>two‐fold) in PBMC after the DC treatment (good responder group) experienced a prolonged overall survival time in comparison with the poor responder group. We extended the previous study and performed a microarray‐based gene expression analysis using peripheral blood CD56+ cells and CD56−CD3+ T cells from patients enrolled in the above‐mentioned clinical study. We sought to identify any biomarkers associated with the immune responses in this immunotherapy trial. Six patient samples corresponding to three subjects in the good responder group and three subjects in the poor responder group were included in the microarray analysis. Genes differentially expressed between pre‐treatment and post‐treatment samples were selected for analysis. Subsequently, genes that were only expressed in the good responder group or poor responder group were chosen. After these procedures, four selected genes were quantified by reverse transcriptase–polymerase chain reaction in another eight patient samples, and two genes, LTB4DH and DPYSL3, were confirmed to be candidate genes for the predictor of a good immune response. The expression profile of these two genes may be associated with the responsiveness of IFN‐γ production after αGalCer‐pulsed DC treatment. (Cancer Sci 2010; 101: 2333–2340)
Lung cancer is the leading cause of cancer death in industrialized countries. Most patients with non‐small‐cell lung cancer (NSCLC) present as either locally advanced or metastatic cases, and the overall 5‐year survival rate is <15%. Platinum‐based chemotherapy is the standard first‐line treatment for advanced inoperable NSCLC.( 1 ) Refractory or recurrent cases after first‐line therapy are considered to be far more difficult to treat.( 2 , 3 , 4 ) Patients with late‐stage NSCLC are often symptomatic and standard chemotherapy frequently causes unfavorable complications; therefore, the establishment of a novel therapy with low toxicity, such as immunotherapy, is highly desirable.
Invariant natural killer T (iNKT) cells are a unique subgroup of lymphocytes that regulate a broad range of immune responses.( 5 , 6 , 7 ) Invariant natural killer T cells recognize glycolipid antigens presented by the non‐classical MHC molecule CD1d. α‐Galactocylceramide (αGalCer; KRN7000) was originally extracted from a marine sponge and was the first glycolipid ligand identified for iNKT cells.( 8 ) In response to αGalCer, iNKT cells promote the release of cytokines such as interferon‐γ (IFN‐γ) and thereby exert effects that are adjuvant to those of other effector cells, including dendritic cells (DC), natural killer (NK) cells and CD8+ T cells. Invariant natural killer T cells also exhibit powerful direct cytotoxic activities against malignant tumor cells both in vitro and in vivo. ( 9 , 10 , 11 , 12 , 13 )
To assess the clinical application of the antitumor activity of iNKT cells, a phase I and phase I–II clinical study of αGalCer‐pulsed DC was recently performed in patients with NSCLC refractory to standard treatment. The use of αGalCer‐pulsed DC was designed to activate endogenous iNKT cells.( 14 , 15 ) The results revealed a significant correlation between increased IFN‐γ production in PBMC and prolonged median survival time. The patients who exhibited high IFN‐γ production capability due to stimulation with αGalCer in vitro (good‐responder group) experienced a significantly longer median survival time than the group who exhibited low or no IFN‐γ production capability (poor‐responder group).( 15 ) Therefore, IFN‐γ production is a valuable biomarker for αGalCer‐pulsed DC immunotherapy.
In this study, a cDNA microarray‐based gene expression analysis of peripheral blood CD56+ cells and CD56−CD3+ T cells from lung cancer patients undergoing αGalCer‐pulsed DC injection was used to identify novel biomarkers for responsiveness to this immunotherapy. Alterations in the specific gene expression in NK cells or T cells may reflect the augmented antitumor effects, which could induce the prolongation of survival time. Two candidate genes, namely LTB4DH and DPYSL3, were selected. These genes were associated with the responsiveness of IFN‐γ production.
Materials and Methods
Patient samples. Frozen peripheral blood mononuclear cells were obtained from 14 patients with NSCLC who were enrolled in a previously reported Phase I–II study,( 15 ) and who had received four rounds of αGalCer‐pulsed DC injection at Chiba University Hospital (Chiba, Japan). A microarray analysis and quantitative RT‐PCR (qRT‐PCR) were performed for samples collected prior to treatment (pre‐treatment) and 3 months after the first DC injection (post‐treatment). The good responder group was defined as patients achieving a twofold or more increase in IFN‐γ‐producing ability after treatment and the poor‐responder group was categorized as patients who showed a less than twofold‐increase in IFN‐γ‐producing ability, as previously described.( 15 )
This protocol was approved by the institutional Ethics Committee (No.181) of Chiba University and informed consent was obtained from the patients or the patients’ family.
MACS separation and flow cytometry analysis. The outline of the procedure is shown in Figure 1. To obtain CD56+ cells and CD56−CD3+ T cells, an autoMACS separation system (Miltenyi Biotec Inc., Gladbach, Germany) was used according to the manufacturer’s protocol. CD56+ cells were trapped using CD56 microbeads (20 μL/107 cells; Miltenyi Biotec Inc.). CD56−CD3+ T cells were obtained from the CD56− cell population using FITC‐conjugated anti‐CD3 mAb (BD‐pharmingen, San Diego, CA, USA; clone‐UHCT1) and FITC microbeads (20 μL/107 cells; Miltenyi Biotec Inc.).
Figure 1.
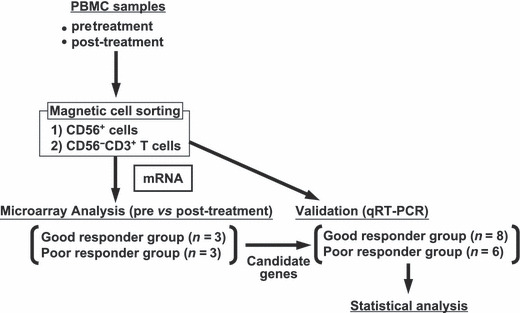
Study design of the gene expression analysis. Cryopreserved PBMC samples of pre‐ and post‐αGalCer‐pulsed DC therapy were thawed. CD56+ cells and CD56−CD3+ T cells were purified using magnetic beads and an Auto‐MACS sorter. mRNA was extracted from CD56+ cells and CD56−CD3+ T cells and a microarray analysis was performed in six patients. Three patients were from the good responder group and three were from the poor responder group. The candidate genes identified by the microarray data were validated with quantitative RT‐PCR (qRT‐PCR).
cDNA microarray. Total RNA was isolated using TRIzol reagent (Invitrogen Japan, Tokyo, Japan). Samples in which the RNA integrity number was >7.0 were used for mRNA profiling by microarray analysis. cDNA synthesis, cRNA amplification, biotinylation and fragmentation were performed with a One‐Cycle Target Labelling Kit (Affymetrix, Santa Clara, CA, USA). Twenty micrograms of labelled target RNA were hybridized with Human Genome U133 Plus 2.0 (HG‐U133_Plus2) GeneChip expression arrays (Affymetrix) at 45°C for 16 h, as described according to the manufacturer’s instructions. Washing stages and streptavidin‐phycoerythrin staining were conducted using a GeneChip Fluidics Station (Affymetrix). Subsequently, the chips were scanned using a GeneChip Scanner 3000 (Affymetrix). The array data were normalized using either MAS5( 16 ) or gcRMA( 17 ) algorithms.
Quantitative RT‐PCR. A qRT‐PCR analysis was performed as previously described.( 18 ) The primers and probes used in this study are listed in Table 1.
Table 1.
Primers and probes
| Gene | Primer (Sense) | Primer (Antisense) | Probe† | Start (bp) |
|---|---|---|---|---|
| LTB4DH | GGCCAGACACAATACCACTGT | AGGCCAAAGTAGGCAGTCAG | #21 | 429 |
| DPYSL3 | CCAAGGCAAGAAGAACATCC | TTCCATGTAAATATCAGCATAAAAGG | #16 | 119 |
| LGALS2 | GAGCCTACCCTGCCACTG | AGGCAAAGGCAGGTTATAAGG | #3 | 447 |
| C13orf15 | TGCTGATCTTGACAAAACTTTAGC | GCAGGTCCTCGGAACTTTCT | #7 | 683 |
| GAPDH | AGCCACATCGCTCAGACAC | GCCCAATACGACCAAATCC | #60 | 83 |
†Adequate probes (#1–#165) from Universal Probelibrary (Roche Applied Science, Penzberg, Germany) were used. bp, base pair.
Statistical analysis. The expression of each gene and GAPDH mRNA in the samples was calculated using the plasmid standard curve. The concentration was expressed as mRNA copies and reported as the mean ± SD. The relative sample amount was expressed as a ratio of target genes (copies)/GAPDH (copies), and differences in mRNA expression between the two different time points (pre‐ and post‐treatment) were analyzed using the Wilcoxon test. We corrected the findings for multiple testing using Bonferroni’s method, based on four independent tests. A two‐tailed P value of <0.0125 was considered to be statistically significant. All statistical analyses were performed using the JMP software program (SAS Institute, Cary, NC, USA). The receiver operating characteristic (ROC) curve was drawn using the JMP software package in order to obtain the cut‐off value of both highest sensitivity and specificity in regard to the fold increase of gene expression.( 19 , 20 )
Results
Patient characteristics. A total of 14 patient samples were included in the present study. Eight patients (#00, #03, #04, #05, #08, #10, #13 and #25) were good responders, while six patients (#01, #12, #16, #22, #23 and #24) were poor responders on the basis of the criteria described in Materials and Methods (Table 2). The PBMC from six patients (#00, #01, #04, #10, #16 and #24) were evaluated by microarray analysis. The PBMC from the remaining eight patients were analyzed by qRT‐PCR to validate the results of the microarray data. Patient characteristics are shown in Table 2.
Table 2.
Patient characteristics
| Immunological response | Case | Age/gender | Diagnosis | |
|---|---|---|---|---|
| Microarray | Good | #00 | 67/F | Rec, Ad |
| #04 | 44/M | Rec, Ad | ||
| #10 | 54/F | Rec, Ad | ||
| Poor | #01 | 52/M | IV, Sq | |
| #16 | 43/M | Rec, Ad | ||
| #24 | 62/M | IV, Sq | ||
| Validation | Good | #03 | 66/M | Rec, Ad |
| #05 | 60/M | Rec, Sq | ||
| #08 | 57/F | IV, Ad | ||
| #13 | 60/F | IIIB, Ad | ||
| #25 | 56/M | Rec, Ad | ||
| Poor | #12 | 59/M | Rec, Ad | |
| #22 | 55/M | IIIB, Ad | ||
| #23 | 57/F | Rec, Ad |
Microarray, cases performed using microarray analysis (n = 6); Validation, cases analyzed using only quantitative RT‐PCR (n = 8); Good, good responder group; Poor, poor responder group; M, male; F, female; Rec, recurrence after complete surgical resection; IIIB, clinical stage IIIB; IV, clinical stage IV; Ad, adenocarcinoma; Sq, squamous cell carcinoma.
cDNA microarray analysis of CD56+ cells and CD56−CD3+ T cells from pre‐ and post‐αGalCer‐pulsed DC treatment. Whole PBMC were separated to obtain CD56+ cells including NK cells and CD56−CD3+ T cells using a MACS system. The mean values of the purity of pretreatment CD56+ cells was 95.5% (86.6–98.3%), pretreatment CD56−CD3+ cells was 98.1% (88.4–99.6%), post‐treatment CD56+ cells was 96.1% (93.0–99.1%) and post‐treatment CD56−CD3+ cells was 98.4% (93.7–99.8%) after MACS separation (Table 3). The mean percentage of CD3−CD56+ NK cells in all CD56+ cells was 76.0% (31.0–95.6%) (Table 3). To identify the significant changes in gene expression in CD56+ cells and CD56−CD3+ T cells during the αGalCer‐pulsed DC treatment, the transcription levels of pretreatment samples were compared with those of the post‐treatment samples. At first, from more than 56 000 genes, probe sets targeting antisense transcripts, cross‐hybridizing probe sets and non‐informational probe sets were excluded from the analysis as described previously,( 21 ) and 17 572 CD56+ cell genes and 16 873 CD56−CD3+ T cell genes were extracted. Thereafter, the candidate genes which changed over the threshold level from the pretreatment expression level in both the good responder group and the poor responder group were selected using the Rank products methods (Fig. 2). After DC treatment, upregulated genes in CD56+ cells from the good responder group (Fig. 2a) and the poor responder group (Fig. 2b) and upregulated genes in CD56−CD3+ T cells from the good responder group (Fig. 2c) and the poor responder group (Fig. 2d) were shown. No gene expression levels were decreased in the post‐treatment samples (Table 4).
Table 3.
FACS profile of separated mononuclear cells
| Case | Pretreatment | Post‐treatment | |||
|---|---|---|---|---|---|
| CD56+ cell | CD56−CD3+ T cell | CD56+ cell | CD56−CD3+ T cell | ||
| Microarray | #00 | 97.9 (80.9) | 97.5 | 97.5 (n.d.) | 93.7 |
| #04 | 96.0 (33.7) | 99.4 | 95.0 (31.0) | 99.0 | |
| #10 | 86.6 (51.5) | 88.4 | 99.1 (58.1) | 98.3 | |
| #01 | 95.1 (95.6) | 99.2 | 97.7 (96.6) | 99.0 | |
| #16 | 93.1 (91.1) | 95.6 | 93.0 (96.0) | 95.4 | |
| #24 | 95.6 (59.7) | 98.6 | 95.1 (63.2) | 97.0 | |
| Validation | #03 | 98.3 (86.0) | 98.9 | 97.0 (80.2) | 99.4 |
| #05 | 95.3 (88.1) | 99.1 | 95.4 (91.9) | 99.5 | |
| #08 | 95.1 (89.6) | 99.2 | 94.7 (81.9) | 99.5 | |
| #13 | 97.3 (81.1) | 99.3 | 95.8 (90.5) | 99.5 | |
| #25 | 97.5 (81.5) | 99.3 | 96.0 (96.3) | 99.2 | |
| #12 | 95.4 (88.8) | 99.6 | 96.8 (90.5) | 98.7 | |
| #22 | 95.1 (41.1) | 99.5 | 97.4 (34.1) | 99.8 | |
| #23 | 98.2 (95.4) | 99.6 | 95.3 (60.7) | 98.9 | |
The number in parenthesis represents the percentage of natural killer cells in CD56+ cells. n.d., not done.
Figure 2.
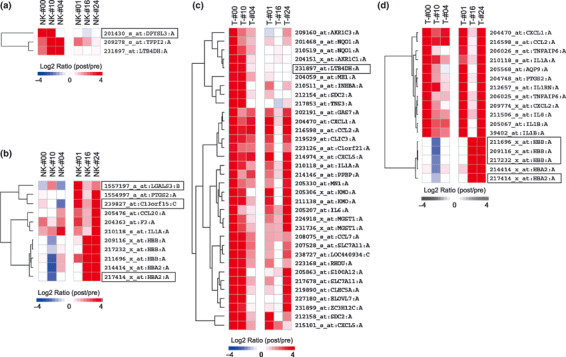
Differential gene expression analysis in CD56−CD3+ T cells and CD56+ cells between pre‐ and post‐treatment samples. Gene expression levels were normalized, log2‐transformed and mean‐centered to produce relative values. Each column represents the pooled samples from three different patients (good responders: #00, #10, #04; poor responders: #01, #16, #24). Upregulated genes are shown in red, and downregulated genes are shown in blue. The color bars (bottom) relate to the intensity of the differences in gene expression. (a) Upregulated genes in CD56+ cells and (c) CD56−CD3+ T cells of the good responder group. (b) Upregulated genes in CD56+ cells and (d) CD56−CD3+ T cells of the poor responder group. The squares are selected genes where at least two out of three counterpart cases of microarray analyzed cases were decreased (log2 ratio <0). NK, CD56+ cells; T, CD56−CD3+ T.
Table 4.
Number of statistically changed genes
| CD56+ cell | CD56−CD3+ T cell | |||
|---|---|---|---|---|
| Pre>Post | Post>Pre | Pre>Post | Post>Pre | |
| Good pre versus Good post | 0 | 3 | 0 | 34 |
| Poor pre versus Poor post | 0 | 11 | 0 | 17 |
Good pre, before α‐galactosylceramide (αGalCer)‐pulsed DC therapy in the good responder group. Good post, after αGalCer‐pulsed DC therapy in the good responder group. Poor pre, before αGalCer‐pulsed DC therapy of the poor responder group. Poor post, after αGalCer‐pulsed DC therapy of the poor responder group. Pre>Post, decreasing the gene expression (less than a quarter) after therapy. Post>Pre, increasing the gene expression (more than four times) after therapy.
Subsequently, to identify the genes specific for the good or poor responder groups, the genes that behaved in the same pattern in both the good and poor responder groups were excluded. The genes that showed a decrease after DC treatment (log2 ratio <0 in Fig. 2) in at least two out of three counterpart samples were included. Six genes were selected in this procedure (Fig. 2). Among the six genes, hemoglobin‐related genes (HBB and HBA2) were excluded since the hemoglobin levels showed a dramatic difference in the enrolled patients. The remaining four genes were leukotriene B4 12‐hydroxydehydrogenase (LTB4DH) in the CD56−CD3+ T cells of the good responder group, dihydropyrimidinase‐like 3 (DPYSL3) in the CD56+ cells of the good responder group, chromosome 13 open reading frame 15 (C13orf15) and lectin, galactoside‐binding, soluble, 3 (LGALS3) in the CD56+ cells of the poor responders.
Quantitative RT‐PCR analysis of selected genes. In order to validate the selected four genes, qRT‐PCR was performed using eight microarray‐independent validation cases and six microarray cases. The validation cases included five cases from the good responder group and three from the poor responder group.
LTB4DH significantly increased in the post‐treatment CD56−CD3+ T cells of the good responders (P = 0.0117), but not in the poor responder group (Fig. 3a and Table 5). Furthermore, DPYSL3 was upregulated in the post‐treatment CD56+ cells of the good responders (P = 0.0117), and this finding was not observed in the poor responders (Fig. 3b and Table 5). The C13orf15 expression was elevated in the post‐treatment CD56+ cells of the poor responders, which was not significant (P = 0.0277) (Fig. 3c and Table 5). LGALS3, which was picked up in the post‐treatment CD56+ cells of the poor responders, showed no significant difference between the pre‐ and post‐treatment samples (P = 0.1730) (Fig. 3d and Table 5). These results indicate that increased LTB4DH and DPYSL3 expression is therefore associated with a good immune response.
Figure 3.
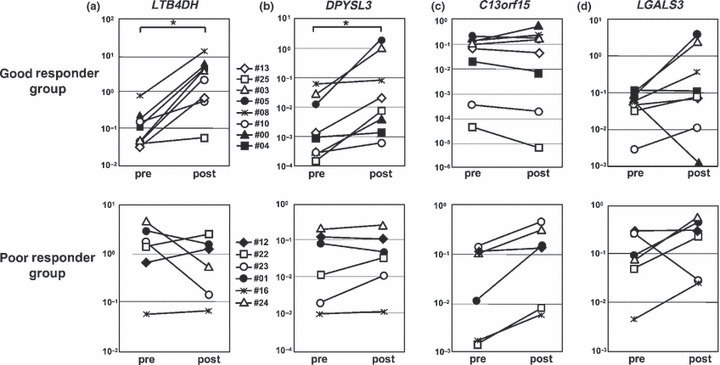
Changes in the expression level of LTB4DH, DPYSL3, C13orf15 and LGALS3 in the good or poor responder group. Transcripts relative to GAPDH expression determined by qRT‐PCR in pre‐ and post‐treatment samples in the good or poor responder group. All cases including validation cases (n = 8; five samples were from patients in the good responder group and three were from the poor responder group) and microarray tested cases were analyzed with qRT‐PCR (n = 14). *P < 0.0125; Wilcoxon test. (a) In CD56−CD3+ T cells, post‐treatment LTB4DH was increased after treatment in all of the good responder group (P = 0.0117), but not in the poor responder group. (b) In CD56+ cells, post‐treatment DPYSL‐3 was upregulated in all of the good responder group (P = 0.0117), but not in the poor responder group. In CD56+ cells, post‐treatment C13orf15 (c) and LGALS3 (d) did not increase significantly in the poor responder group (P = 0.0277 and P = 0.1730).
Table 5.
List of selected genes
| Gene | Gene ID | Probe ID | FC (pre/post) | FDR | Description |
|---|---|---|---|---|---|
| LTB4DH | NM_012212.2 | 231897_at | 0.0600 | 0.0281 | Leukotriene B4 12‐hydroxydehydrogenase |
| DPYSL3 | NM_001387.2 | 201430_s_at | 0.0605 | 0.0100 | Dihydropyrimidinase‐like 3 |
| C13orf15 | NM_014059.2 | 239827_at | 0.1241 | 0.0209 | Chromosome 13 open reading frame 15 |
| LGALS3 | NM_002306.2 | 1557197_a_at | 0.1088 | 0.0033 | Lectin, galactoside‐binding, soluble, 3 |
FC, fold change; FDR, false discovery rate; ID, identification.
ROC curve analysis of the gene expression change to distinguish good and poor responders. To determine the cut‐off value of the fold increase of significantly upregulated two genes including LTB4DH in CD56−CD3+ T cells and DPYSL3 in CD56+ cells, receiver‐operating‐characteristic (ROC) curves were used and the maximal area under the curve was calculated as described in the Materials and Methods section (Fig. 4a,c). The cut‐off points of LTB4DH and DPYSL3 to distinguish good and poor responders were 4.19‐ and 17.3‐fold increases, respectively (Fig. 4b,d).
Figure 4.
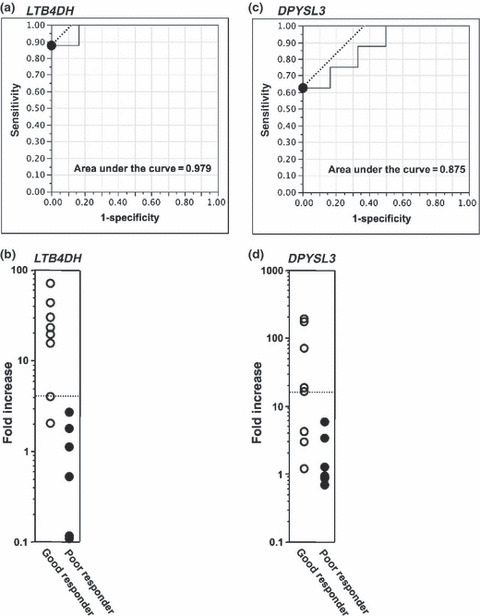
Determination of the cut‐off level of the fold increase in LTB4DH and DPYSL3 expression. The fold increase in gene expression including LTB4DH in CD56−CD3+ T cells (a,b) and DPYSL3 (c) in CD56+ cells is shown. The receiver‐operating‐characteristic (ROC) curve was calculated in order to obtain the highest cut‐off value in both specificity and sensitivity. The black circles in (a) and (c) were the highest point of both specificity and sensitivity. The area under the curve is also indicated in the panel (a) and (c). The dotted lines in (b) and (d) indicate the cut‐off fold increase value of each gene.
Correlation between the fold changes in gene expression and overall survival. Finally, we addressed the direct correlation between the gene expression levels of LTB4DH and DPYSL3 and the overall survival of each patient. Log‐linear regression analysis was performed to evaluate the association of these parameters (Fig. 5). There was a trend toward an increasing association between the upregulated expression of LTB4DH or DPYSL3 and increased patient survival (R 2 = 0.228, P = 0.0842 in LTB4DH and R 2 = 0.196, P = 0.1126 in DPYSL3), although no clear statistical significance was detected in the limited number of patients in the current study.
Figure 5.
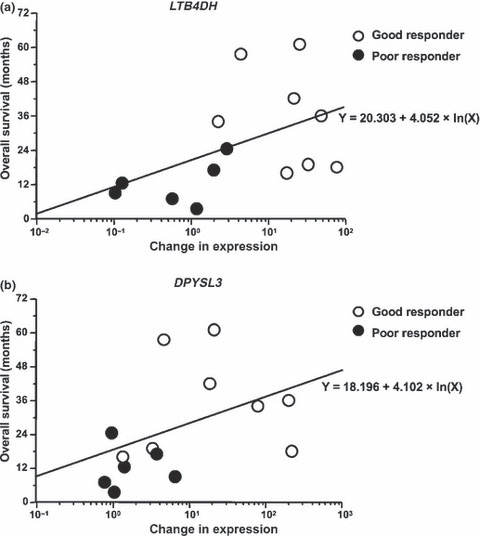
Correlation between the fold changes in gene expression and overall survival. A log‐linear regression analysis was performed to evaluate the association between the fold increase in the gene expression of LTB4DH (a) and DPYSL3 (b), and the overall survival of each patient. The open circles are the good responder cases and the filled circles are the poor responder cases.
Discussion
A microarray‐based gene expression analysis of peripheral blood CD56+ cells or CD56−CD3+ T cells during αGalCer‐pulsed DC treatment revealed a set of genes that can possibly predict the immunological and clinical response to αGalCer‐pulsed DC in patients with advanced or recurrent lung cancer. We compared the gene expression profiles of both good and poor immune responders. The patients with a good immune responder achieved a more than two‐fold increase in αGalCer‐reactive IFN‐γ producing PBMC, whereas the poor responders showed a less than two‐fold increase in response. In a comparison of these good and poor responder groups, the IFN‐γ production capability after in vitro stimulation with NKT cell‐specific ligand, αGalCer, was found to be associated with the overall survival of patients receiving αGalCer‐pulsed DC treatment.( 15 ) Regarding gene expression analysis in the current study, PBMC were used without stimulation, and therefore IFN‐γ may not be considered as an appropriate candidate gene. In fact, the IFN‐γ gene was not selected in our gene expression assay (Motohashi, unpublished observation, 2008).
Two candidate genes were revealed, namely LTB4DH and DPYSL3. Leukotriene B4 12‐hydroxydehydrogenase (LTB4DH) is a member of the zinc‐independent medium chain dehydrogenase/reductase (MDR) family and is a key enzyme in the irreversible degradation of three eicosanoids, leukotriene B4 (LTB4), prostaglandin E and F (PGE and PGF) and lipoxin A4.( 22 ) In the current study, the expression level of LTB4DH was increased in T cells of the good responder group (Fig. 3a). It is known that PGE2 acts on T cells to enhance their production of IL‐4, IL‐5 and IL‐10 and to suppress their production of IL‐2 and IFN‐γ.( 23 , 24 ) PGE2 inhibits CD8+ T cell proliferation and decreases the production of IFN‐γ by CD8+ T cell clones through a cAMP‐dependent pathway.( 24 ) Therefore, in good responder patients, increased LTB4DH might induce the enhanced degradation of PGE2 and inhibit the suppression of CD8+ T cell proliferation and IL‐2 and IFN‐γ production from T cells. In fact, a high level of LTB4DH expression in tumor tissue appears to be a positive predictive marker of a good prognosis in cases of bladder carcinoma.( 25 , 26 )
Dihydropyrimidinase‐like 3 (DPYSL3), a member of the TUC (TOAD‐64/Ulip/CRMP) family, is also known as collapsin response mediator protein‐4 (CRMP‐4) or TUC‐4 and is involved in neuronal plasticity and neurite outgrowth and extension.( 27 ) DPYSL3 interactions with structural proteins such as tubulin, actin and chondroitin sulfate proteoglycans suggest that this protein plays a role in the regulation of cytoskeleton organization. In the TUC family, the presence of CRMP2 mRNA has been reported to be induced in maturing monocytes( 28 ) and human adult lung tissue.( 29 , 30 ) We detected increased DPYSL3 gene expression in CD56+ cells in the good responders (Fig. 3b). The functional significance of this gene in human lymphocytes and the mechanism of the correlation between increased DPYSL3 expression and the functional alteration of NK cells in the good responders is still unclear at present.
Although it is not easy to conclude that the levels of LTB4DH and DPYSL3 are more informative as markers of the therapeutic response than the number of IFN‐γ‐producing cells, it would be helpful to have a panel of predictive biomarkers rather than just the number of IFN‐γ producing cells. For instance, case 08 showed a good immune response, while the overall survival of this patient was 16.4 months, which was shorter than the median survival of all cases. The expression level of DPYSL3 was not upregulated in this case (Fig. 4d). Thus, in this particular case, the expression of DPYSL3 was a more appropriate marker for predicting survival. In any event, accuracy would be improved with the use of multiple predictive biomarkers. In addition, measurement of gene expression is much simpler than IFN‐γ enzyme‐linked immunospot (ELISPOT) assay, and less invasive for patients. It is necessary to collect 30 mL of whole blood to obtain the PBMC before treatment and then to collect blood weekly during the 3 months of follow up for the ELISPOT assay. To detect changes in gene expression, we needed to collect 20 mL of whole blood only once before treatment and once after treatment (about 3 months after the first apheresis).
For effective antitumor responses, it is essential for CD8+ cytotoxic T cells and NK cells to increase in their function and number. However, in the tumor‐bearing host, the function of tumor‐specific CD8+ T cells and NK cells was often down‐modulated. The NKT cells are known to mediate adjuvant activity by their production of IFN‐γ, which in turn activates and increases in the number of both NK cells and tumor‐specific CD4+/CD8+ T cells. Therefore, activation of NKT cells in the tumor‐bearing host regresses tumor growth and rejects the tumor.( 15 , 31 , 32 ) Based on these results, we expected that the good and poor immune responders had some alterations in gene expression in their NK and T cells. Unfortunately, the number of cryopreserved cells was limited. We separated CD56+ cells prior to CD3+ cell separation in the current study to try to obtain more cells. The CD56+ cells included NK cells and also some activated T and NKT cells. In a follow‐up study with an increased number of patients, we will collect both CD56+CD3− cells and CD56−CD3+ cells from the individual PBMC samples.
Recently, several molecular biomarkers have been identified for cancer detection, prognosis prediction and treatment evaluation.( 33 , 34 ) 14‐3‐3ζ,( 35 ) Clusterin( 36 ) and KIF4A( 37 ) can be used as prognostic biomarkers for NSCLC in addition to the conventional tumor markers CEA, SCC and CYFRA. We did not obtain any solid results regarding the direct association between the changes of a single gene expression and tumor pregression. Although a large number of patients are needed to further confirm the validity of this biomarker, these genes could be useful surrogate markers for estimating immunological responses after NKT cell‐based immunotherapy. CD56+ cells include several types of immune cells such as NK cells, NKT cells and activated T cells, and those cells are crucial for effective antitumor immunity. In addition, we would like to design a new trial with a substantial number of patients to establish effective pretreatment biomarkers that can predict appropriate candidate cases to undergo NKT cell immunotherapy before receiving this immunotherapy. This type of biomarker enables us to select the most effective treatment option for each patient, thus leading to the establishment of personalized medicine.
In summary, we sought to identify biomarkers for predicting the immunological response to αGalCer‐pulsed DC therapy in patients with NSCLC. At present, we have so far identified two genes, namely LTB4DH and DPYSL3, which are thus considered to be potentially useful biomarkers.
Disclosure Statement
The authors have no conflict of interest.
Acknowledgments
The authors are grateful to Dr Naohiko Seki for helpful comments in the preparation of the manuscript. We also thank Ms Mayumi Chiba and Ms Yukie Aita for their excellent help with the experiments. This work was supported by Global COE Program (Global Center for Education and Research in Immune System Regulation and Treatment), City Area Program (Kazusa/Chiba Area) MEXT (Japan), and by grants from the Ministry of Education, Culture, Sports, Science and Technology (Japan) (Grants‐in‐Aid: for Scientific Research on Priority Areas #17016010; Scientific Research [B] #21390147, and Scientific Research [C] #21591808, and Cancer Translational Research Project), the Ministry of Health, Labor and Welfare (Japan), Yasuda Medical Foundation, Astellas Foundation, Sagawa Foundation, Kobayashi Institute for Innovative Cancer Chemotherapy, and Mitsui Life Social Welfare Foundation.
References
- 1. Schiller JH, Harrington D, Belani CP et al. Comparison of four chemotherapy regimens for advanced non‐small‐cell lung cancer. N Engl J Med 2002; 346: 92–8. [DOI] [PubMed] [Google Scholar]
- 2. Shepherd FA, Dancey J, Ramlau R et al. Prospective randomized trial of docetaxel versus best supportive care in patients with non‐small‐cell lung cancer previously treated with platinum‐based chemotherapy. J Clin Oncol 2000; 18: 2095–103. [DOI] [PubMed] [Google Scholar]
- 3. Spira A, Ettinger DS. Multidisciplinary management of lung cancer. N Engl J Med 2004; 350: 379–92. [DOI] [PubMed] [Google Scholar]
- 4. Huisman C, Smit EF, Giaccone G, Postmus PE. Second‐line chemotherapy in relapsing or refractory non‐small‐cell lung cancer: a review. J Clin Oncol 2000; 18: 3722–30. [DOI] [PubMed] [Google Scholar]
- 5. Taniguchi M, Harada M, Kojo S, Nakayama T, Wakao H. The regulatory role of Vα14 NKT cells in innate and acquired immune response. Annu Rev Immunol 2003; 21: 483–513. [DOI] [PubMed] [Google Scholar]
- 6. Bendelac A, Savage PB, Teyton L. The biology of NKT cells. Annu Rev Immunol 2007; 25: 297–336. [DOI] [PubMed] [Google Scholar]
- 7. Godfrey DI, MacDonald HR, Kronenberg M, Smyth MJ, Van Kaer L. NKT cells: what’s in a name? Nat Rev Immunol 2004; 4: 231–7. [DOI] [PubMed] [Google Scholar]
- 8. Kawano T, Cui J, Koezuka Y et al. CD1d‐restricted and TCR‐mediated activation of Vα14 NKT cells by glycosylceramides. Science 1997; 278: 1626–9. [DOI] [PubMed] [Google Scholar]
- 9. Fujii S, Shimizu K, Smith C, Bonifaz L, Steinman RM. Activation of natural killer T cells by α‐galactosylceramide rapidly induces the full maturation of dendritic cells in vivo and thereby acts as an adjuvant for combined CD4 and CD8 T cell immunity to a coadministered protein. J Exp Med 2003; 198: 267–79. [DOI] [PMC free article] [PubMed] [Google Scholar]
- 10. Smyth MJ, Crowe NY, Pellicci DG et al. Sequential production of interferon‐γ by NK1.1(+) T cells and natural killer cells is essential for the antimetastatic effect of α‐galactosylceramide. Blood 2002; 99: 1259–66. [DOI] [PubMed] [Google Scholar]
- 11. Eberl G, MacDonald HR. Selective induction of NK cell proliferation and cytotoxicity by activated NKT cells. Eur J Immunol 2000; 30: 985–92. [DOI] [PubMed] [Google Scholar]
- 12. Carnaud C, Lee D, Donnars O et al. Cutting edge: cross‐talk between cells of the innate immune system: NKT cells rapidly activate NK cells. J Immunol 1999; 163: 4647–50. [PubMed] [Google Scholar]
- 13. Taniguchi M, Seino K, Nakayama T. The NKT cell system: bridging innate and acquired immunity. Nat Immunol 2003; 4: 1164–5. [DOI] [PubMed] [Google Scholar]
- 14. Ishikawa A, Motohashi S, Ishikawa E, et al. A phase I study of α‐galactosylceramide (KRN7000)‐pulsed dendritic cells in patients with advanced and recurrent non‐small cell lung cancer. Clin Cancer Res 2005; 11: 1910–7. [DOI] [PubMed] [Google Scholar]
- 15. Motohashi S, Nagato K, Kunii N et al. A phase I‐II study of α‐galactosylceramide‐pulsed IL‐2/GM‐CSF‐cultured peripheral blood mononuclear cells in patients with advanced and recurrent non‐small cell lung cancer. J Immunol 2009; 182: 2492–501. [DOI] [PubMed] [Google Scholar]
- 16. Hubbell E, Liu WM, Mei R. Robust estimators for expression analysis. Bioinformatics 2002; 18: 1585–92. [DOI] [PubMed] [Google Scholar]
- 17. Irizarry RA, Bolstad BM, Collin F, Cope LM, Hobbs B, Speed TP. Summaries of Affymetrix GeneChip probe level data. Nucleic Acids Res 2003; 31: e15. [DOI] [PMC free article] [PubMed] [Google Scholar]
- 18. Kimura YM, Hosokawa H, Yamashita M et al. Regulation of T helper type 2 cell differentiation by murine Schnurri‐2. J Exp Med 2005; 201: 397–408. [DOI] [PMC free article] [PubMed] [Google Scholar]
- 19. Swets JA. Measuring the accuracy of diagnostic systems. Science 1988; 240: 1285–93. [DOI] [PubMed] [Google Scholar]
- 20. Zweig MH, Campbell G. Receiver‐operating characteristic (ROC) plots: a fundamental evaluation tool in clinical medicine. Clin Chem 1993; 39: 561–77. [PubMed] [Google Scholar]
- 21. Hijikata A, Kitamura H, Kimura Y et al. Construction of an open‐access database that integrates cross‐reference information from the transcriptome and proteome of immune cells. Bioinformatics 2007; 23: 2934–41. [DOI] [PubMed] [Google Scholar]
- 22. Hori T, Yokomizo T, Ago H et al. Structural basis of leukotriene B4 12‐hydroxydehydrogenase/15‐Oxo‐prostaglandin 13‐reductase catalytic mechanism and a possible Src homology 3 domain binding loop. J Biol Chem 2004; 279: 22615–23. [DOI] [PubMed] [Google Scholar]
- 23. Hilkens CM, Snijders A, Snijdewint FG, Wierenga EA, Kapsenberg ML. Modulation of T‐cell cytokine secretion by accessory cell‐derived products. Eur Respir J Suppl 1996; 22: 90s–4s. [PubMed] [Google Scholar]
- 24. Harris SG, Padilla J, Koumas L, Ray D, Phipps RP. Prostaglandins as modulators of immunity. Trends Immunol 2002; 23: 144–50. [DOI] [PubMed] [Google Scholar]
- 25. Schultz IJ, Wester K, Straatman H et al. Prediction of recurrence in Ta urothelial cell carcinoma by real‐time quantitative PCR analysis: a microarray validation study. Int J Cancer 2006; 119: 1915–9. [DOI] [PubMed] [Google Scholar]
- 26. Dyrskjot L, Thykjaer T, Kruhoffer M et al. Identifying distinct classes of bladder carcinoma using microarrays. Nat Genet 2003; 33: 90–6. [DOI] [PubMed] [Google Scholar]
- 27. Kowara R, Moraleja KL, Chakravarthy B. PLA(2) signaling is involved in calpain‐mediated degradation of synaptic dihydropyrimidinase‐like 3 protein in response to NMDA excitotoxicity. Neurosci Lett 2008; 430: 197–202. [DOI] [PubMed] [Google Scholar]
- 28. Rouzaut A, Lopez‐Moratalla N, De Miguel C. Differential gene expression in the activation and maturation of human monocytes. Arch Biochem Biophys 2000; 374: 153–60. [DOI] [PubMed] [Google Scholar]
- 29. Hamajima N, Matsuda K, Sakata S, Tamaki N, Sasaki M, Nonaka M. A novel gene family defined by human dihydropyrimidinase and three related proteins with differential tissue distribution. Gene 1996; 180: 157–63. [DOI] [PubMed] [Google Scholar]
- 30. Charrier E, Reibel S, Rogemond V, Aguera M, Thomasset N, Honnorat J. Collapsin response mediator proteins (CRMPs): involvement in nervous system development and adult neurodegenerative disorders. Mol Neurobiol 2003; 28: 51–64. [DOI] [PubMed] [Google Scholar]
- 31. Motohashi S, Nakayama T. Clinical applications of natural killer T cell‐based immunotherapy for cancer. Cancer Sci 2008; 99: 638–45. [DOI] [PMC free article] [PubMed] [Google Scholar]
- 32. Fujii S, Motohashi S, Shimizu K, Nakayama T, Yoshiga Y, Taniguchi M. Adjuvant activity mediated by iNKT cells. Semin Immunol 2010; 22: 97–102. [DOI] [PubMed] [Google Scholar]
- 33. Singhal S, Miller D, Ramalingam S, Sun SY. Gene expression profiling of non‐small cell lung cancer. Lung Cancer 2008; 60: 313–24. [DOI] [PMC free article] [PubMed] [Google Scholar]
- 34. Eberhard DA, Giaccone G, Johnson BE. Biomarkers of response to epidermal growth factor receptor inhibitors in Non‐Small‐Cell Lung Cancer Working Group: standardization for use in the clinical trial setting. J Clin Oncol 2008; 26: 983–94. [DOI] [PubMed] [Google Scholar]
- 35. Fan T, Li R, Todd NW et al. Up‐regulation of 14‐3‐3ζ in lung cancer and its implication as prognostic and therapeutic target. Cancer Res 2007; 67: 7901–6. [DOI] [PubMed] [Google Scholar]
- 36. Albert JM, Gonzalez A, Massion PP et al. Cytoplasmic clusterin expression is associated with longer survival in patients with resected non small cell lung cancer. Cancer Epidemiol Biomarkers Prev 2007; 16: 1845–51. [DOI] [PubMed] [Google Scholar]
- 37. Taniwaki M, Takano A, Ishikawa N et al. Activation of KIF4A as a prognostic biomarker and therapeutic target for lung cancer. Clin Cancer Res 2007; 13: 6624–31. [DOI] [PubMed] [Google Scholar]