

Abstract
The hypoxia‐inducible factor (HIF) is the master regulator for oxygen‐dependent gene expression. The HIF signal transduction pathway can be manipulated by inhibiting the activity of the HIFα‐regulating prolyl‐4‐hydroxylase domain (PHD) enzymes. The consequence of inhibiting the PHD activity for chemoresistance was studied. Inhibiting the PHD activity with the 2‐oxoglutarate analog dimethyloxaloylglycine (DMOG) results in increased chemoresistance towards etoposide but not carboplatin in HeLa cells. Evidence for an etoposide‐specific resistance, which develops as a consequence of inhibiting the PHD activity, was further supported in a tetracycline‐inducible PHD2 knockdown HeLa cell model. The etoposide‐resistance was mediated by HIF‐1α as shown in mouse embryonic fibroblast HIF‐1α+/+ and HIF‐1α−/− cells. Decreased cellular cytotoxicity after etoposide treatment inversely correlated with a dimethyloxaloylglycine (DMOG)‐inducible, HIF‐1α‐dependent enhanced MDR‐1 expression and efflux activity as determined by RT‐PCR, immunoblots, and with the fluorescent dye DiOC2. Taken together, our data indicate that PHD inhibitors might increase chemoresistance of tumor cells in a HIF‐1‐dependent manner. (Cancer Sci 2009; 101: xxx–xxx)
Due to inadequate vascularisation and irregular blood flow, solid tumors often present hypoxic or anoxic areas.( 1 ) In response to hypoxia, HIF‐1 becomes activated. HIF‐1 comprises two subunits, the oxygen‐dependently regulated α‐subunit and the constitutively expressed β‐subunit.( 2 ) In normoxia HIF‐1α undergoes oxygen‐dependent prolyl‐hydroxylation and subsequent pVHL‐mediated ubiquitination and proteasomal degradation.( 3 , 4 , 5 ) Hydroxylation is permitted by three PHD enzymes.( 6 , 7 , 8 ) Of these, PHD2 is the main isoform regulating HIF‐1α degradation in normoxia.( 9 ) In hypoxia the hydroxylation is impaired due to the lack of oxygen and thus HIF‐1α is stabilized, heterodimerizes with HIF‐1β, and activates hypoxia‐dependent gene expression. More than 70 HIF target genes have been identified, which are required for the cellular adaptation towards hypoxia.( 10 ) Regarding tumor biology, it is important to note that erythropoiesis, tumor angiogenesis, pH‐regulation, and metabolic adaptation are mediated at least in part by HIF target genes.( 11 ) It is well described that high levels of HIF‐1α are often associated with tumor progression and with resistance towards chemotherapy treatment.( 12 ) In contrast, the role of the HIF‐1α‐regulating PHD enzymes for tumor growth and tumor therapy is not entirely clear. Recent studies indicated a link between cancer and perturbation of PHD activity and subsequent HIF‐1‐mediated signalling.( 13 , 14 ) PHD2, in particular, seems to have an impact on tumor growth and tumor cell sensitivity. In head and neck squamous cell carcinoma increased levels and nuclear translocation of PHD2 are associated with a less differentiated tumor phenotype.( 15 ) Moreover, the tumor‐forming potential can be promoted by PHD2 depending on its expression levels.( 16 ) A recent report indicates that low PHD2 expression in patients with head and neck squamous cell carcinoma is associated with good radiation response.( 18 ) From these studies it may be concluded that PHD2 promotes tumor formation and resistance towards cancer therapy. Yet it is also reasonable to speculate that inhibition of PHD activity induces therapy resistance because of the stabilization of HIF‐1α. Therefore, we explored the consequences of inhibiting PHD activity for chemotherapy sensitivity in MEF HIF‐1α+/+ and MEF HIF‐1α−/− cells. In these studies etoposide, carboplatin, and vinblastine were applied, which show cytotoxicity through different molecular mechanisms. As PHD2 is the major PHD isoform regulating HIF‐1α stability in normoxia, we also established a Tet‐inducible HeLa PHD2 knockdown cell line, which was used as a PHD2‐deficient cell model in this study.
Materials and Methods
Cell culture. MEF HIF‐1α+/+ and MEF HIF‐1α−/− SV40 large T antigen immortalized and H‐ras transformed cells were a kind gift of R.S. Johnson (University of San Diego, San Diego, CA, USA). HeLa T‐Rex cells were purchased from Invitrogen (Karlsruhe, Germany). All cells were cultivated in high glucose modified Eagle’s medium containing 10% Tet‐free FCS (Biochrom, Berlin, Germany), 50 U/mL penicillin G, and 50 μg/mL streptomycin (Pan Biotech, Aidenbach, Germany) in a humidified 5% CO2/95% air atmosphere at 37°C. In the case of HeLa T‐Rex cells, 5 μg/mL blasticidine (Invitrogen) were added to the culture medium. For hypoxic conditions, O2 levels were decreased to 1% with N2 in an in vivo 400 work station (IUL Instruments, Königswinter, Germany). For some experiments, cells were treated with 10 μg/mL Tet (Sigma‐Aldrich, München, Germany), 1 mm DMOG (Frontier Scientific, Carnforth, UK), 1–400 μm etoposide (Sigma‐Aldrich), 1–103 μm carboplatin (Sigma‐Aldrich), or 10−3–1 nm vinblastine (Sigma‐Aldrich) for the indicated time periods.
Prolyl‐4‐hydroxylase domain 2 shRNA plasmid. For generating the PHD2 knockdown cell line the linearized pENTR/H1/TO plasmid (Invitrogen) and the following oligos containing the overhanging sequences CACC (forward oligo) or AAAA (reverse oligo) to ensure directional cloning were used: shPHD2 forward, 5′‐CACCGGACTGGAAGAAGCACAAGCTTTCAAGAGAAGCTTGTGCTTCTTCCAGTCC‐3′; shPHD2 reverse, 5′‐AAAAGGACTGGAAGAAGCACAAGCTTCTCTTGAAAGCT TGTGCTTCTTCCAGTCC‐3′. The shRNA coding plasmid was generated by annealing the single‐stranded oligos to obtain a double‐stranded oligo. Subsequently, the double‐stranded oligo was ligated with the linearized plasmid pENTR/H1/TO according to the manufacturer’s recommendation. Correct ligation was verified by sequencing.
Cell survival/viability assays.
MTT assay. Cells were cultured in 96‐well plates and treated with 1 mm DMOG for 24 h, followed by treatment with the indicated concentrations of etoposide, vinblastine, or carboplatin. Cell survival was analyzed by MTT assays as described previously.( 19 ) Then 24 or 48 h after drug treatment the culture medium was replaced with fresh medium containing 0.5 mg/mL MTT (Sigma‐Aldrich) and incubated for 2 h at 37°C. One volume of lysis buffer (isopropyl alcohol, 0.1% HCl) was added and cells were lysed in this solution for 1 h. Finally, absorbances at 570 nm were determined. Following non‐cellular background substraction (which corresponds to 100% cytotoxicity), all data were normalized to the MTT conversion activity of solvent‐treated control cells. The value obtained from the solvent‐treated control cells corresponds to 0% cytotoxicity.
Viability assay. Cell viability was tested with the MultiTox‐Fluor Multiplex Cytotoxicity Assay (Promega, Mannheim, Germany). To this end, cells were plated and treated as described for the MTT assays. After drug incubation the number of viable cells was analyzed using the MultiTox‐Fluor Cytotoxicity Assay kit according to the manufacturer’s recommendations.
Caspase 3 and 7 activities. Caspase 3 and 7 activities were analyzed using the Apo‐ONE Homogeneous Caspase3/7 assay kit (Promega) according to the manufacturer’s recommendations.
Cell cycle distribution. HeLa T‐Rex and 2.1.1‐16 cells were incubated in the absence or presence of 10 μg/mL Tet. After 48 h, cells were trypsinized and washed with PBS. Detached cells (1 × 10⁶) were fixed with 3 mL of ice‐cold 75% ethanol and stored for 24 h at −20°C. Subsequently, cells were centrifuged at 500 g for 5 min and the pellets were resuspended in 450 μL PBS and 50 μL RNase (1 mg/mL stock solution; Roche, Mannheim, Germany). Then 25 μL propidium iodide were added per sample. FACS analysis was carried out with a FACSCalibur (BD Biosciences, Franklin Lakes, NJ, USA). At least 20 000 cells per sample were monitored for their DNA content.
MDR1 efflux activity. MDR1 efflux activity was determined using the multidrug resistance direct dye efflux assay kit (Millipore, Schwalbach, Germany). HeLa, MEF HIF‐1α+/+ and MEF HIF‐1α−/− cells were cultivated in 10 cm cell culture plates. After plating, cells were incubated in the presence or absence of 1 mm DMOG for 24 h. Subsequently, cells were detached from the plastic dish by treatment with trypsin and incubated with 1 μg/mL DiOC2/rhodamine for 15 min. DiOC2/rhodamine export was analyzed as indicated by the manufacturer’s recommendation. In some cases, MDR‐1 activity was inhibited by treating the cells with 22 μm vinblastine.
Reporter gene assay. For reporter gene assays, HeLa T‐Rex and 2.1.1‐16 cells were transfected with 1 μg pH3SVL containing three hypoxia responsive element sites fused to the coding sequence of the firefly luciferase and 200 ng pRLSV40, encoding renilla luciferase, for internal standardization using Lipofectamine 2000, as described previously.( 20 ) Twenty‐four hours after transfection cells were lysed and firefly and renilla luciferase activities were measured using the dual luciferase assay kit (Promega).
Protein analysis. For obtaining total cellular protein extracts, the culture medium was removed, cells were washed twice with ice‐cold PBS then incubated for 15 min in lysis buffer (10 mm Tris HCl [pH 8.0], 1 mm EDTA, 400 mm NaCl, 0.1% Triton X‐100, and a complete mini protease inhibitor cocktail [Roche]) on ice. Lysates were centrifuged at 16 100 g for 20 min at 4°C. The supernatant was collected and stored at −80°C. Protein extracts were separated by SDS‐PAGE and analyzed by immunoblotting. Primary antibodies used were rabbit anti‐PHD2 (NB 100‐137; Novus, Littleton, CO, USA), mouse anti‐β‐actin (A 5441; Sigma‐Aldrich), anti‐mouse HIF‐1α (NB100‐479; Novus), anti‐human HIF‐1α (610959; BD Transduction Laboratories, Heidelberg, Germany), and mouse anti‐MDR1 (517310; Calbiochem, Bad Soden, Germany). For detection of immunocomplexes horseradish‐conjugated secondary goat anti‐rabbit or goat anti‐mouse antibodies (Santa Cruz Biotechnology, Santa Cruz, CA, USA) were used and membranes were incubated with 100 mm Tris‐HCl (pH 8.5), 2.65 mm H2O2, 0.45 mm luminol, and 0.625 mm coumaric acid for 1 min. Chemiluminescence signals were detected with the LAS3000 camera system (Fujifilm Europe, Düsseldorf, Germany).
RT‐PCR. After total RNA extraction reverse transcription was carried out with 1 μg RNA and the first‐strand cDNA synthesis kit (Fermentas, St. Leon‐Rot, Germany) in a total volume of 20 μL. Subsequently, mRNA levels were detected using 1 μL of the cDNA reaction and 2X Master Mix (Fermentas). Primers were as follows: mMDR‐1b forward, 5′‐CCT GTT CTT TCT GGT TAT GG‐3′; mMDR‐1b reverse, 5′‐GCT ACA TTC TGG GTA ACT ACA G‐3′; hMDR‐1 forward, 5′‐ATC CAC GGA CAC TCC TAC GA‐3′; hMDR‐1 reverse, 5′‐CCT GTA TTG TTT GCC ACC ACG‐3′; mS12 forward, 5′‐GAA GCT GCC AAG GCC TTA GA‐3′; mS12 reverse, 5′‐AAC TGC AAC CAA CCA CCT TC‐3′; hL28 forward, 5′‐GCA TCT GCA ATG GAT GGT‐3′; and hL28 reverse, 5′‐TGT TCT TGC GGA TCA TGT GT‐3′.
Results
Establishment of a Tet‐inducible PHD2 knockdown cell line. For analyzing the importance of PHD2 for chemotherapy resistance we established a Tet‐inducible PHD2 knockdown cell line, which was named 2.1.1‐16. To this end, HeLa T‐Rex cells were stably transfected with a plasmid, which encodes an shRNA sequence targeting PHD2 RNA. The expression of the shRNA is under the control of the CMV promoter. Two Tet operator sequences were inserted between the TATA box of the CMV promoter and the transcriptional start site, which enables a Tet‐inducible expression of the shRNA in the Tet repressor expressing HeLa T‐Rex cells. After transfection and subcloning, a Tet‐inducible PHD2 knockdown cell clone (2.1.1‐16) was identified and characterized. Addition of 10 μg/mL Tet to the culture medium for 96 h resulted in a significant reduction of PHD2 expression in 2.1.1‐16 cells cultivated at 20% O2 or 1% O2 (Fig. 1A). As a result of the decreased PHD2 expression, HIF‐1α was stabilized in the Tet‐treated 2.1.1‐16 cells (Fig. 1B). The increased HIF‐1α protein expression correlated with an elevated HIF‐1 activity as determined by reporter gene assays (Fig. 1C). Treating HeLa T‐Rex cells with Tet did not change the protein levels of PHD2 or HIF‐1 activity, excluding a Tet‐induced non‐specific effect. In addition, the impact of Tet treatment on the cell cycle distribution was determined (Fig. 1D). In the untreated 2.1.1‐16 cells, slightly more cells in the G0/G1 phase and less cells in the S phase were found compared to untreated HeLa T‐Rex cells. Incubation of HeLa T‐Rex cells or 2.1.1‐16 cells with Tet for 48 h, however, did not significantly affect the cell cycle phase distribution excluding a significant impact of Tet on cell proliferation.
Figure 1.
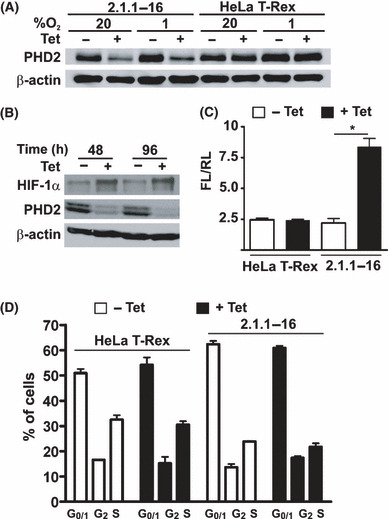
Characterization of the 2.1.1‐16 tetracycline (Tet)‐inducible prolyl‐4‐hydroxylase domain 2 (PHD2) knockdown cell line. (A) HeLa T‐Rex and 2.1.1‐16 cells were incubated in the presence or absence of 10 μg/mL Tet for 96 h at 20% O2 or 1% O2. Subsequently, cells were lysed and protein extracts were analyzed by immunoblot. (B) The 2.1.1‐16 cells were incubated for 48 or 96 h in the presence or absence of 10 μg/mL Tet at 20% O2. Subsequently, cells were lysed and protein extracts were analyzed by immunoblot. (C) HeLa T‐Rex and 2.1.1‐16 cells were incubated in the presence or absence of 10 μg/mL Tet for 48 h. Subsequently, cells were transfected with the firefly luciferase (FL) hypoxia‐inducible factor (HIF) reporter gene plasmid pH3SVL and the renilla luciferase (RL) control plasmid pRLSV40. After 24 h transfection cells were lysed and FL and RL activities were determined. (n = 3 ± SEM) *P < 0.05. (D) HeLa T‐Rex and 2.1.1‐16 cells were incubated in the presence or absence of 10 μg/mL Tet for 48 h. Subsequently, cell cycle distribution was analyzed by FACS (n = 3 ± SD).
Inhibition of PHD activity affects etoposide and vinblastine but not carboplatin‐induced cytotoxicity. The 2.1.1‐16 cells were used to analyze the impact of PHD2 on chemotherapy‐induced cytotoxicity. To this end HeLa T‐Rex and 2.1.1‐16 cells were treated with increasing concentrations of etoposide or carboplatin. The two drugs were chosen to gain insight into the PHD2‐induced effects as they differ regarding their molecular targets and in chemoresistance. Etoposide inhibits the topoisomerase II enzyme thereby inducing DNA double‐strand breaks. Carboplatin is a platinum agent that forms strong chemical bonds with DNA, which eventually leads to cell death. Additionally, both drugs differ regarding the mechanisms, which result in chemoresistance towards their cytotoxic effects. Whereas etoposide is a substrate of various ABC drug transporters, carboplatin is not transported likewise.( 21 , 22 ) Drug‐induced cytotoxicity was analyzed by MTT assays 48 h after the start of chemotherapy treatment. The 2.1.1‐16 cells, in which PHD2 knockdown was induced by Tet treatment, were significantly less sensitive towards incubation with etoposide compared to untreated 2.1.1‐16 cells as well as HeLa T‐Rex cells (Fig. 2A). Most interestingly, no similar effect was observed after incubating the cells with carboplatin (Fig. 2B). The influence of PHD2 on etoposide‐induced cytotoxicity was additionally verified by determining the fraction of viable cells after incubating Tet‐treated versus untreated 2.1.1‐16 cells with etoposide (Fig. 2C). In line with the MTT assays, the viability in the Tet‐treated 2.1.1‐16 cell population was significantly higher compared to untreated 2.1.1‐16 cells or HeLa T‐Rex cells. Additionally, activated caspase 3 and 7 levels were determined after incubating the cells with etoposide (Fig. 2D). In Tet‐treated 2.1.1‐16 cells significantly lower levels of activated caspase 3 and 7 were found after etoposide incubation compared to untreated 2.1.1‐16 cells confirming the cytotoxicity/viability data.
Figure 2.
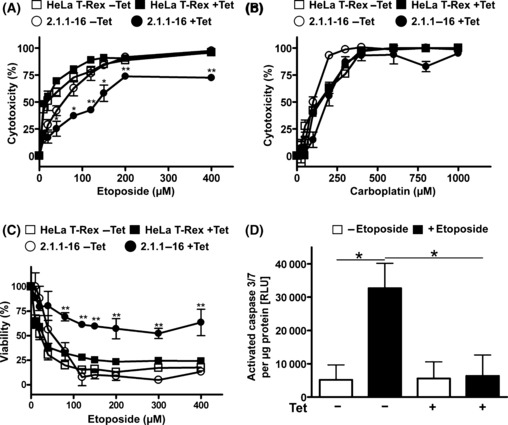
Knockdown of prolyl‐4‐hydroxylase domain 2 (PHD2) results in increased resistance towards treatment with etoposide but not carboplatin. HeLa T‐Rex and 2.1.1‐16 cells were incubated in the presence or absence of 10 μg/mL tetracycline (Tet) for 48 h. Subsequently, cells were seeded in 96‐well plates and treated with the indicated concentrations of etoposide (A) or carboplatin (B) for 48 h. Etoposide and carboplatin‐induced cytotoxicity was analyzed by MTT assays. (n = 3 ± SD) *P < 0.05; **P < 0.01. (C) HeLa T‐Rex and 2.1.1‐16 cells were incubated in the presence or absence of 10 μg/mL Tet for 48 h. Subsequently, cells were seeded in 96‐well plates and treated with the indicated concentrations of etoposide for 48 h. Cell viability was analyzed using the MultiTox‐Fluor Multiplex Cytotoxicity Assay. (n = 3 ± SD) **P < 0.01. (D) Tet‐inducible PHD2 knockdown 2.1.1‐16 cells were incubated in the presence or absence of 10 μg/mL Tet for 48 h. Subsequently, cells were seeded in 96‐well plates and treated with 60 μm etoposide for 48 h as indicated. Cells were lysed and levels of activated caspase 3 and 7 as well as protein concentrations were determined. (n = 3 ± SEM) *P < 0.05. RLU, relative light units.
As noted above, etoposide is a well‐described substrate of various ABC drug transporters, whereas carboplatin is not transported in this way.( 21 , 22 ) A similar effect regarding differential cytotoxicity in Tet‐treated versus untreated 2.1.1‐16 cells was also observed after treating the cells with vinblastine, which is, like etoposide, a substrate of the MDR1 drug transporter (Fig. 3A). Verapamil is a well‐described inhibitor of MDR1 transport activity.( 23 , 24 ) Co‐treatment of Tet‐treated 2.1.1‐16 cells with etoposide and verapamil abrogated the etoposide resistance in line with the assumption that the chemotherapy resistance in the PHD2 knockdown cells was mediated by MDR1 (Fig. 3B). In accordance carboplatin‐induced cytotoxicity was unaffected by co‐treatment with verapamil (Fig. 3C). Co‐treatment of Tet‐treated 2.1.1‐16 cells with etoposide and verapamil, however, abrogated the etoposide resistance in line with the assumption that the chemotherapy resistance in the PHD2 knockdown cells was mediated by MDR1 (Fig. 3B). To further strengthen this conclusion MDR1 transport activity was evaluated by determining cellular retention of the fluorescent dye DiOC2 (Fig. 3D). The 2.1.1‐16 cells, treated with or without Tet, were loaded with the fluorescent dye for 15 min at 4°C. Subsequently, cells were washed with drug‐free culture medium and incubated at 37°C for 30 min to activate the MDR1 export activity. Dye export was quantified by measuring the fluorescence of export‐stimulated cells compared to cells just loaded with DiOC2 at 4°C. In line with the cytotoxicity data, MDR1 transport activity was significantly increased as a consequence of the PHD2 knockdown. Furthermore, MDR1 pump activity was verified by inhibition of the export activity with vinblastine, which is competing for MDR1‐mediated export. The increased MDR1 export activity in Tet‐treated 2.1.1‐16 cells correlated with increased MDR1 RNA levels (Fig. 3E).
Figure 3.
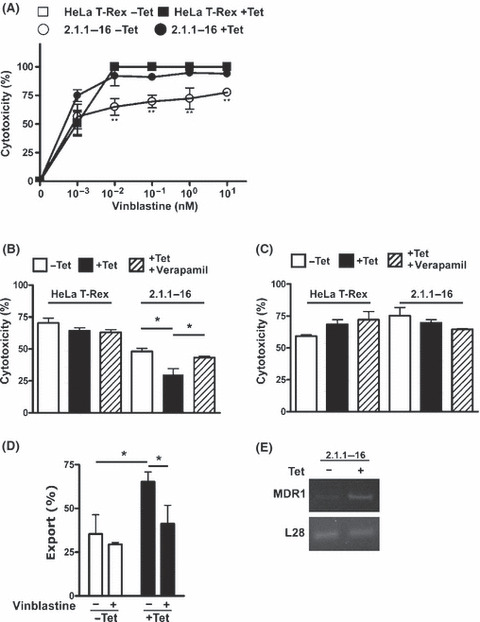
Knockdown of prolyl‐4‐hydroxylase domain 2 (PHD2) results in increased resistance towards treatment with vinblastine. (A) HeLa T‐Rex and 2.1.1‐16 cells were incubated in the presence or absence of 10 μg/mL tetracycline (Tet) for 48 h. Subsequently, cells were seeded in 96‐well plates and treated with the indicated concentrations of vinblastine for 48 h. Vinblastine‐induced cytotoxicity was analyzed by MTT assays. (n = 3 ± SD) **P < 0.01. (B,C) Tet‐inducible PHD2 knockdown 2.1.1‐16 cells were incubated in the presence or absence of 10 μg/mL Tet for 48 h. Subsequently, cells were seeded in 96‐well plates and treated with 60 μm etoposide (B) or 300 μm carboplatin (C) in the absence or presence of 10 μm verapamil for 48 h. Etoposide‐induced cytotoxicity was analyzed by MTT assays. (n = 3 ± SEM) *P < 0.05. (D,E) 2.1.1‐16 cells were incubated in the presence or absence of 10 μg/mL Tet. Subsequently, MDR1 efflux activity (D) and MDR1 RNA expression (E) were analyzed. (n = 3 ± SD) *P < 0.05.
Treating HeLa cells with the 2‐oxoglutarate analog DMOG, a widely used PHD inhibitor, results in a strong stabilization of HIF‐1α in normoxia (Fig. 4A). To determine if the increased resistance towards etoposide incubation in the 2.1.1‐16 PHD2 knockdown cells could be mimicked by inhibiting PHD activity, the etoposide and carboplatin‐induced cytotoxicity in DMOG‐treated HeLa cells was tested (Fig. 4B,C). Therefore, HeLa T‐Rex cells were treated with 1 mm DMOG for 24 h. Subsequently, cells were incubated with increasing concentrations of etoposide or carboplatin. As shown in Figure 4(C), DMOG treatment did not affect carboplatin‐induced cytotoxicity. However, DMOG‐treated cells were less sensitive towards incubation with etoposide compared to untreated HeLa cells (Fig. 4B). These data indicate that inhibition of PHD activity confers a selective chemotherapy resistance.
Figure 4.
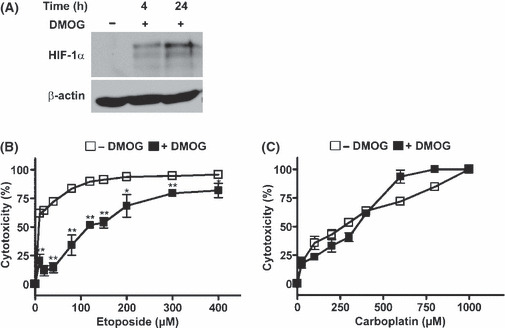
Dimethyloxaloylglycine (DMOG) treatment affects etoposide but not carboplatin‐induced cytotoxicity in HeLa cells. (A) HeLa cells were incubated in the presence of 1 mm DMOG for 4 or 24 h. Subsequently, cells were lysed and protein extracts were analyzed by immunoblot. (B) HeLa cells were seeded in 96‐well plates and incubated in the presence or absence of 1 mm DMOG for 24 h. Subsequently, cells were treated with the indicated concentrations of etoposide (B) or carboplatin (C) for 48 h. Etoposide and carboplatin‐induced cytotoxicity were analyzed by MTT assays. (n = 3 ± SD) *P <0.05; **P < 0.01.
DMOG‐induced resistance towards etoposide is mediated by HIF‐1α. To gain further insight into the mechanism of DMOG‐induced chemoresistance, etoposide‐induced cytotoxicity was analyzed in MEF HIF‐1α+/+ and MEF HIF‐1α−/− cells. Treating MEF HIF‐1α+/+ and MEF HIF‐1α−/− cells with 1 mm DMOG resulted in HIF‐1α accumulation in the HIF‐1α+/+ cells only (Fig. 5A). Incubation of DMOG‐treated MEF HIF‐1α+/+ cells with etoposide resulted in a decreased etoposide‐induced cytotoxicity compared to untreated cells (Fig. 5B). A similar DMOG‐induced etoposide resistance was not detectable in the MEF HIF‐1α−/− cells, indicating that DMOG mediates its effect through HIF‐1α stabilization (Fig. 5C). Most interestingly, DMOG affected the etoposide‐induced cytotoxicity, whereas carboplatin‐induced cytotoxicity was not affected in either MEF HIF‐1α+/+ or MEF HIF‐1α−/− cells (Fig. 5D,E).
Figure 5.
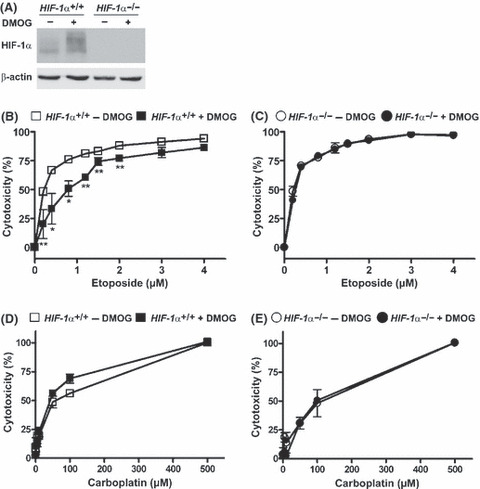
Treatment of mouse embryonic fibroblast (MEF) cells with dimethyloxaloylglycine (DMOG) affects etoposide but not carboplatin‐induced cytotoxicity in a hypoxia‐inducible factor‐1α (HIF‐1α)‐dependent manner. (A) MEF HIF‐1α+/+ and MEF HIF‐1α−/− cells were incubated in the presence of 1 mm DMOG for 24 h. Subsequently, cells were lysed and protein extracts were analyzed by immunoblot. (B–E) MEF HIF‐1α+/+ and MEF HIF‐1α−/− cells were seeded in 96‐well plates and incubated in the presence or absence of 1 mm DMOG for 24 h. Subsequently, cells were treated with the indicated concentrations of etoposide (B,C) or carboplatin (D,E). Etoposide and carboplatin‐induced cytotoxicity were analyzed by MTT assays. (n = 3 ± SD) *P < 0.05; **P < 0.01.
MDR1 efflux activity induced by inhibition of PHD activity with DMOG. Etoposide is a known substrate of various ABC efflux drug transporters. Among the etoposide‐transporting ABC efflux pumps, MDR1 has been described to be expressed in a HIF‐dependent manner in hypoxia.( 25 ) We verified that DMOG treatment results in increased expression of MDR1 RNA and protein levels (Fig. 6A,B). This effect was observed after treatment of MEF HIF‐1α+/+ cells with 1 mm DMOG for up to 24 h, whereas no increase in MDR1 RNA or protein levels were observed in MEF HIF‐1α−/− cells. Subsequently, MDR1 transport activity was evaluated in MEF HIF‐1α+/+, MEF HIF‐1α−/−, and HeLa cells (Fig. 6C,D). Furthermore, the MDR1 pump activity was verified by inhibition of the export activity with vinblastine. There was no significant difference in the baseline MDR1 transport activity between the MEF HIF‐1α+/+ and MEF HIF‐1α−/− cells. Pre‐treatment of the MEF HIF‐1α+/+ cells or HeLa cells with 1 mm DMOG, however, increased the efflux activity. This effect was not detectable in the MEF HIF‐1α−/− cells, indicating that the MDR1 activity is mediated by HIF‐1α after DMOG treatment.
Figure 6.
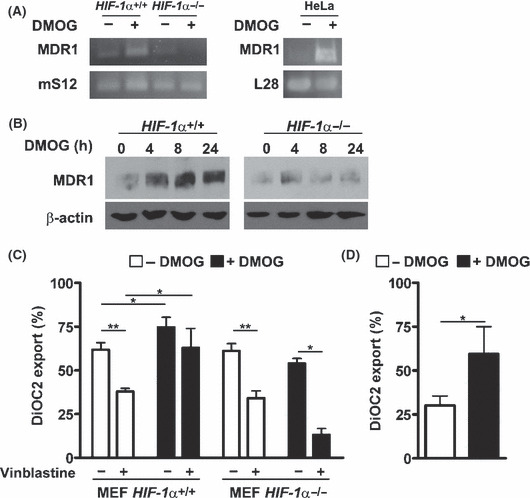
Dimethyloxaloylglycine (DMOG) treatment induces hypoxia‐inducible factor‐1α (HIF‐1α)‐mediated MDR1 expression and MDR1 drug efflux activity. Mouse embryonic fibroblast (MEF) HIF‐1α+/+, MEF HIF‐1α−/−, and HeLa cells were incubated in the presence of 1 mm DMOG for 24 h. Subsequently, MDR1, mS12, or L28 RNA levels, as well as MDR1 protein levels, were determined by RT‐PCR (A) and immunoblots (B). (C) MEF HIF‐1α+/+, MEF HIF‐1α−/−, and (D) HeLa cells were incubated in the presence of 1 mm DMOG for 24 h and MDR1 efflux activity was analyzed. (n = 3 ± SD) *P < 0.05; **P < 0.01.
Discussion
Solid tumors often present hypoxic areas, which apparently correlate with the occurrence of chemotherapy resistance.( 26 ) HIF‐1 has been shown to be one player in hypoxia‐mediated therapy resistance.( 27 ) The impact of HIF‐1α‐regulating PHD on this chemoresistance is of importance because these enzymes are druggable targets of the HIF pathway.( 28 ) PHD inhibitors are developed for generating drugs that are able to induce HIF‐1α stabilization and activation.( 29 ) Inhibiting PHD activity is sought to be a therapeutic strategy for increasing endogenous erythropoietin levels in case of anemia and for tissue protection in case of ischemic diseases.( 28 ) Our data indicate the induction of a chemoresistance towards etoposide and vinblastine but not carboplatin as a consequence of inhibiting PHD activities with DMOG. Comparing the effect induced by DMOG treatment in MEF HIF‐1α+/+ and MEF HIF‐1α−/− cells, we show that the PHD‐dependent resistance is mediated by HIF‐1α. HIF‐1 induces transcriptional changes that promote cell survival and resistance to chemotherapy at the cellular level. These include changes in apoptotic pathways, drug‐induced senescence, DNA repair, cellular uptake, and drug extrusion.( 30 , 31 , 32 , 33 , 34 , 35 ) The selective PHD2‐dependent resistance towards etoposide treatment was further supported using a newly‐established Tet‐inducible PHD2 knockdown HeLa cell line. Due to the PHD2 knockdown, 2.1.1‐16 cells presented detectable HIF‐1α protein levels and HIF‐1 activity in normoxia. A HIF‐1‐mediated etoposide resistance is in line with previous reports.( 19 , 31 , 36 ) The DMOG‐inducible etoposide resistance correlated with the increased HIF‐dependent expression and activity of MDR1. MDR1 is one of the most clinically important ATP‐driven transmembrane efflux pumps in humans.( 37 ) It is a member of the large ATP‐binding cassette family. MDR1 confers a multidrug resistance phenotype to cancer cells by reducing the intracellular drug accumulation. MDR1 transports many structurally diverse chemical agents including etoposide.( 38 ) The expression and activity of MDR1 correlates with resistance towards etoposide in various malignancies.( 39 ) For several transcription factors a regulation of the MDR1 expression has been described including NFκB, c‐fos, and p53.( 40 , 41 ) The observed enhanced expression of MDR1 in hypoxia, however, is mediated through the binding of HIF‐1 to a functional hypoxia responsive element in the MDR1 promoter.( 25 ) Previously we reported that etoposide was equally toxic at normoxia (20% O2) compared to hypoxia (1% O2).( 19 ) There was just a slight increase in the IC50 of etoposide at 1% O2. This seems to be in contrast to the data obtained with DMOG in the present study. However, one has to consider that inhibition of PHD does not entirely reflect hypoxia responses. Most importantly hypoxia activates several signal transduction pathways independent of HIF‐1, whereas PHD are modulating the HIF‐1 pathway in a relatively selective manner. Furthermore, the HIF‐1 response in hypoxia and after inhibition of PHD differs. In hypoxia the HIF‐dependent response is limited by the hypoxic induction of PHD2 and 3.( 42 ) The increased expression of PHD2 and 3 compensates for the decreased oxygen levels. After DMOG treatment the increased levels of PHD2 and 3 do not limit the HIF‐response, because the PHD activity is significantly inhibited by the oxoglutarate analog. Thus, treatment of cells with a PHD inhibitor results in a chronic activation of the HIF‐1 pathway. This is in contrast to the conditions of continuing hypoxia. Finally, a dose‐equivalence is difficult to judge, when comparing hypoxia incubation with the treatment of cells with PHD inhibitors.
Based on our data the long‐term HIF‐activation after inhibiting PHD activity can affect the chemosensitivity of tumor cells. Carboplatin, in contrast to etoposide, is not a substrate of MDR1.( 22 ) Accordingly, we did not observe a PHD‐dependent change in chemosensitivity towards carboplatin. The effect of carboplatin was not influenced by PHD2, HIF‐1α expression, or DMOG treatment. Our data regarding MDR1 transport activity and the impact of verapamil on etoposide or carboplatin‐induced cytotoxicity imply that this is most likely due to the differential MDR1 transport of etoposide or carboplatin. Recently it has been reported that HIF‐1 confers chemotherapy resistance also through the DNA double‐strand break repair machinery.( 31 ) This effect seems to involve at least three members of the DNA‐PK complex, that is, DNA‐PKc, Ku70, and Ku80. This should have impact on the cytotoxicity of carboplatin. However, the expression of the DNA‐PK complex members was described to be independent of HIF‐1α stabilization induced by hypoxia or DMOG, which is in contrast to the hypoxia and DMOG‐inducible expression of MDR1.
We have presented evidence that DMOG treatment results in MDR1‐dependent effects. However, our results do not rule out that additional mechanisms, such as changes in pH buffering, or changes in apoptotic pathways, are involved in the observed PHD‐mediated chemoresistance. Although it is widely accepted that HIF‐1α supports chemotherapy resistance and thus it is anticipated that changes in PHD activity can recruit this pathway, this hypothesis has not been formally proven in previous published reports. Diminished expression of PHD2 in endothelial cells seems to result in endothelial normalization in tumor tissues, which could result in increased accessibility of chemotherapeutic drugs through the blood.( 17 ) Inhibition in tumor cells, however, results in HIF‐1α stabilization which, as indicated here, increases chemoresistance. Thus, currently there are conflicting data for the usage of PHD inhibitors as a cancer therapy. This also regards the usage of PHD inhibitors for the treatment of anemia in cancer patients. Further in vivo studies are therefore needed to determine whether, in a tumor, an increased accessibility for chemotherapeutic drugs after PHD inhibition is able to compensate for the induction of resistance at the cellular level.
Taken together, our data indicate that inhibition of PHD activity induces a HIF‐dependent MDR1 chemoresistance phenotype in tumor cells. This has to be taken into account in the context of developing clinical protocols for the use of PHD inhibitors.
Abbreviations
- ABC
ATP binding cassette
- DMOG
Dimethyloxaloylglycine
- DNA‐PK
DNA‐dependent protein kinase
- HIF
hypoxia‐inducible factor
- MEF
mouse embryonic fibroblast
- PHD
prolyl‐4‐hydroxylase domain
- Tet
tetracycline
Acknowledgments
The project was supported by grants from the Wilhelm Sander Stiftung (project no. 1348530) and the Deutsche Krebshilfe (project no. 107757). We gratefully acklowledge the technical help of Sabine Krull.
References
- 1. Vaupel P, Schlenger K, Knoop C et al. Oxygenation of human tumors: evaluation of tissue oxygen distribution in breast cancers by computerized O2 tension measurements. Cancer Res 1991; 51: 3316–22. [PubMed] [Google Scholar]
- 2. Schofield CJ, Ratcliffe PJ. Oxygen sensing by HIF hydroxylases. Nat Rev Mol Cell Biol 2004; 5: 343–54. [DOI] [PubMed] [Google Scholar]
- 3. Ivan M, Kondo K, Yang H et al. HIFα targeted for VHL‐mediated destruction by proline hydroxylation: implications for O2 sensing. Science 2001; 292: 464–8. [DOI] [PubMed] [Google Scholar]
- 4. Jaakkola P, Mole DR, Tian YM et al. Targeting of HIF‐α to the von Hippel‐Lindau ubiquitylation complex by O2‐regulated prolyl hydroxylation. Science 2001; 292: 468–72. [DOI] [PubMed] [Google Scholar]
- 5. Yu F, White SB, Zhao Q et al. HIF‐1α binding to VHL is regulated by stimulus‐sensitive proline hydroxylation. Proc Natl Acad Sci U S A 2001; 98: 9630–5. [DOI] [PMC free article] [PubMed] [Google Scholar]
- 6. Bruick RK, McKnight SL. A conserved family of prolyl‐4‐hydroxylases that modify HIF. Science 2001; 294: 1337–40. [DOI] [PubMed] [Google Scholar]
- 7. Epstein AC, Gleadle JM, McNeill LA et al. C. elegans EGL‐9 and mammalian homologs define a family of dioxygenases that regulate HIF by prolyl hydroxylation. Cell 2001; 107: 43–54. [DOI] [PubMed] [Google Scholar]
- 8. Ivan M, Haberberger T, Gervasi DC et al. Biochemical purification and pharmacological inhibition of a mammalian prolyl hydroxylase acting on hypoxia‐inducible factor. Proc Natl Acad Sci U S A 2002; 99: 13459–64. [DOI] [PMC free article] [PubMed] [Google Scholar]
- 9. Berra E, Benizri E, Ginouves A et al. HIF prolyl‐hydroxylase 2 is the key oxygen sensor setting low steady‐state levels of HIF‐1α in normoxia. EMBO J 2003; 22: 4082–90. [DOI] [PMC free article] [PubMed] [Google Scholar]
- 10. Wenger RH, Stiehl DP, Camenisch G. Integration of oxygen signaling at the consensus HRE. Sci STKE 2005; 2005: re12. [DOI] [PubMed] [Google Scholar]
- 11. Pouyssegur J, Dayan F, Mazure NM. Hypoxia signalling in cancer and approaches to enforce tumour regression. Nature 2006; 441: 437–43. [DOI] [PubMed] [Google Scholar]
- 12. Semenza GL. HIF‐1 and tumor progression: pathophysiology and therapeutics. Trends Mol Med 2002; 8: S62–7. [DOI] [PubMed] [Google Scholar]
- 13. Selak MA, Armour SM, MacKenzie ED et al. Succinate links TCA cycle dysfunction to oncogenesis by inhibiting HIF‐α prolyl hydroxylase. Cancer Cell 2005; 7: 77–85. [DOI] [PubMed] [Google Scholar]
- 14. Esteban MA, Maxwell PH. HIF, a missing link between metabolism and cancer. Nat Med 2005; 11: 1047–8. [DOI] [PubMed] [Google Scholar]
- 15. Jokilehto T, Rantanen K, Luukkaa M et al. Overexpression and nuclear translocation of hypoxia‐inducible factor prolyl hydroxylase PHD2 in head and neck squamous cell carcinoma is associated with tumor aggressiveness. Clin Cancer Res 2006; 12: 1080–7. [DOI] [PubMed] [Google Scholar]
- 16. Lee K, Lynd JD, O’Reilly S et al. The biphasic role of the hypoxia‐inducible factor prolyl‐4‐hydroxylase, PHD2, in modulating tumor‐forming potential. Mol Cancer Res 2008; 6: 829–42. [DOI] [PubMed] [Google Scholar]
- 17. Mazzone M, Dettori D, Leite de Oliveira R et al. Heterozygous deficiency of PHD2 restores tumor oxygenation and inhibits metastasis via endothelial normalization. Cell 2009; 136: 839–51. [DOI] [PMC free article] [PubMed] [Google Scholar]
- 18. Luukkaa M, Jokilehto T, Kronqvist P et al. Expression of the cellular oxygen sensor PHD2 (EGLN‐1) predicts radiation sensitivity in squamous cell cancer of the head and neck. Int J Radiat Biol 2009; 9: 1–9. [DOI] [PubMed] [Google Scholar]
- 19. Unruh A, Ressel A, Mohamed HG et al. The hypoxia‐inducible factor‐1 α is a negative factor for tumor therapy. Oncogene 2003; 22: 3213–20. [DOI] [PubMed] [Google Scholar]
- 20. Köditz J, Nesper J, Wottawa M et al. Oxygen‐dependent ATF‐4 stability is mediated by the PHD3 oxygen sensor. Blood 2007; 110: 3610–7. [DOI] [PubMed] [Google Scholar]
- 21. Froelich‐Ammon SJ, Osheroff N. Topoisomerase poisons: harnessing the dark side of enzyme mechanism. J Biol Chem 1995; 270: 21429–32. [DOI] [PubMed] [Google Scholar]
- 22. Rabik CA, Dolan ME. Molecular mechanisms of resistance and toxicity associated with platinating agents. Cancer Treat Rev 2007; 33: 9–23. [DOI] [PMC free article] [PubMed] [Google Scholar]
- 23. Sharom FJ. The P‐glycoprotein efflux pump: how does it transport drugs? J Membr Biol 1997; 160: 161–75. [DOI] [PubMed] [Google Scholar]
- 24. Yusa K, Tsuruo T. Reversal mechanism of multidrug resistance by verapamil: direct binding of verapamil to P‐glycoprotein on specific sites and transport of verapamil outward across the plasma membrane of K562/ADM cells. Cancer Res 1989; 49: 5002–6. [PubMed] [Google Scholar]
- 25. Comerford KM, Wallace TJ, Karhausen J et al. Hypoxia‐inducible factor‐1‐dependent regulation of the multidrug resistance (MDR1) gene. Cancer Res 2002; 62: 3387–94. [PubMed] [Google Scholar]
- 26. Semenza GL. Hypoxia‐inducible factor 1 and cancer pathogenesis. IUBMB Life 2008; 60: 591–7. [DOI] [PubMed] [Google Scholar]
- 27. Semenza GL. Hypoxia, clonal selection, and the role of HIF‐1 in tumor progression. Crit Rev Biochem Mol Biol 2000; 35: 71–103. [DOI] [PubMed] [Google Scholar]
- 28. Fraisl P, Aragones J, Carmeliet P. Inhibition of oxygen sensors as a therapeutic strategy for ischaemic and inflammatory disease. Nat Rev Drug Discov 2009; 8: 139–52. [DOI] [PubMed] [Google Scholar]
- 29. Katschinski DM. In vivo functions of the prolyl‐4‐hydroxylase domain oxygen sensors: direct route to the treatment of anaemia and the protection of ischaemic tissues. Acta Physiol (Oxf) 2009; 195: 407–14. [DOI] [PubMed] [Google Scholar]
- 30. Sullivan R, Pare GC, Frederiksen LJ et al. Hypoxia‐induced resistance to anticancer drugs is associated with decreased senescence and requires hypoxia‐inducible factor‐1 activity. Mol Cancer Ther 2008; 7: 1961–73. [DOI] [PubMed] [Google Scholar]
- 31. Wirthner R, Wrann S, Balamurugan K et al. Impaired DNA double‐strand break repair contributes to chemoresistance in HIF‐1 α‐deficient mouse embryonic fibroblasts. Carcinogenesis 2008; 29: 2306–16. [DOI] [PubMed] [Google Scholar]
- 32. Wartenberg M, Donmez F, Ling FC et al. Tumor‐induced angiogenesis studied in confrontation cultures of multicellular tumor spheroids and embryoid bodies grown from pluripotent embryonic stem cells. FASEB J 2001; 15: 995–1005. [DOI] [PubMed] [Google Scholar]
- 33. Erler JT, Cawthorne CJ, Williams KJ et al. Hypoxia‐mediated down‐regulation of Bid and Bax in tumors occurs via hypoxia‐inducible factor 1‐dependent and ‐independent mechanisms and contributes to drug resistance. Mol Cell Biol 2004; 24: 2875–89. [DOI] [PMC free article] [PubMed] [Google Scholar]
- 34. Schnitzer SE, Schmid T, Zhou J et al. Hypoxia and HIF‐1α protect A549 cells from drug‐induced apoptosis. Cell Death Differ 2006; 13: 1611–3. [DOI] [PubMed] [Google Scholar]
- 35. Sermeus A, Cosse JP, Crespin M et al. Hypoxia induces protection against etoposide‐induced apoptosis: molecular profiling of changes in gene expression and transcription factor activity. Mol Cancer 2008; 7: 27. [DOI] [PMC free article] [PubMed] [Google Scholar]
- 36. Brown LM, Cowen RL, Debray C et al. Reversing hypoxic cell chemoresistance in vitro using genetic and small molecule approaches targeting hypoxia inducible factor‐1. Mol Pharmacol 2006; 69: 411–8. [DOI] [PubMed] [Google Scholar]
- 37. Ambudkar SV, Kimchi‐Sarfaty C, Sauna ZE et al. P‐glycoprotein: from genomics to mechanism. Oncogene 2003; 22: 7468–85. [DOI] [PubMed] [Google Scholar]
- 38. Ambudkar SV, Dey S, Hrycyna CA et al. Biochemical, cellular, and pharmacological aspects of the multidrug transporter. Annu Rev Pharmacol Toxicol 1999; 39: 361–98. [DOI] [PubMed] [Google Scholar]
- 39. Tsuruo T, Naito M, Tomida A et al. Molecular targeting therapy of cancer: drug resistance, apoptosis and survival signal. Cancer Sci 2003; 94: 15–21. [DOI] [PMC free article] [PubMed] [Google Scholar]
- 40. Ogretmen B, Safa AR. Negative regulation of MDR1 promoter activity in MCF‐7, but not in multidrug resistant MCF‐7/Adr, cells by cross‐coupled NF‐kappa B/p65 and c‐Fos transcription factors and their interaction with the CAAT region. Biochemistry 1999; 38: 2189–99. [DOI] [PubMed] [Google Scholar]
- 41. Li ZH, Zhu YJ, Lit XT. Wild‐type p53 gene increases MDR1 gene expression but decreases drug resistance in an MDR cell line KBV200. Cancer Lett 1997; 119: 177–84. [DOI] [PubMed] [Google Scholar]
- 42. Stiehl DP, Wirthner R, Köditz J et al. Increased prolyl 4‐hydroxylase domain proteins compensate for decreased oxygen levels. Evidence for an autoregulatory oxygen‐sensing system. J Biol Chem 2006; 281: 23482–91. [DOI] [PubMed] [Google Scholar]