

Abstract
The maturation of blood vessels requires mural cell adhesion to endothelial cells. Angiopoietin‐1 (Ang1), a ligand for Tie2 receptor expressed on endothelial cells, plays a critical role in cell adhesion between mural cells and endothelial cells and in endothelial cell sprouting from preexisting vessels in the absence of mural cells. Much information has been amassed on the Tie2–Ang1 system in physiological blood vessel formation during embryogenesis; however, the role of Ang1 in the tumor environment and its interaction with mural cells has not been well documented. Here we studied how Ang1 regulates maturation of blood vessels using the human colon cancer cell line HT29 and the human prostate cancer cell line PC3, and studied how Ang1 affects tumor growth. In a xenograft tumor model using female nude mice, we found that Ang1 enhanced angiogenesis and resulted in tumor growth in the case of PC3 tumors but suppressed tumor growth in the case of HT29 tumors. In PC3 tumors, the number of mural cells adhering to endothelial cells was less than that in HT29 tumors. Ang1 induced sprouting angiogenesis in PC3 tumors although there was little maturation of blood vessels. On the other hand, there was abundant mural cell adhesion to endothelial cells in HT29 tumors and Ang1 did not induce angiogenesis. These results suggest that Ang1 alters tumor growth in a manner that is dependent on the adhesion of mural cells and their localization in the tumor environment. (Cancer Sci 2008; 99: 2373–2379)
Blood vessel formation commences by assembly and tube formation of endothelial cells (EC), or EC progenitors. This process is termed vasculogenesis and is followed by angiogenesis, which results in the emergence of new vessels through the sprouting and elongation from, or the remodeling of, preexisting vessels.( 1 ) In both processes, the structural stability of the tube made of EC is derived from mural cells (MC), such as smooth muscle cells and pericytes, that are recruited around EC forming the tube and adhere to them. Many growth factors are involved in these processes.( 2 , 3 , 4 , 5 , 6 , 7 , 8 , 9 ) Vascular endothelial growth factor (VEGF) plays an important role in the development of EC and tube formation. Platelet‐derived growth factor (PDGF)‐BB produced from EC induces recruitment of MC to the proximity of EC forming the tube.( 10 ) Subsequently, MC adhere to EC for the formation of a structurally stable blood vessel. It has been reported that this cell adhesion between EC and MC occurs when angiopoietin‐1 (Ang1), produced from MC, stimulates Tie2, a receptor tyrosine kinase on EC.( 11 , 12 , 13 ) Therefore, Ang1 is involved in the maturation process of blood vessels.
So far four types of Tie2 ligands (Ang1 to Ang4) have been isolated.( 14 ) Ang1 binds to Tie2 and activates it by inducing dimerization of Tie2, which results in phosphorylation of the kinase domain of Tie2. Ang2 also binds to Tie2; however, Ang2 does not induce phosphorylation of Tie2 at physiological concentration. Therefore, Ang2 has been suggested to work as a naturally occurring antagonist of Ang1. Tie2 activation by Ang1 induces cell adhesion to the extracellular matrix via integrin activation,( 15 ) and disruption of the interaction between EC and MC by targeted mutation of Tie2( 11 , 12 ) or overexpression of Ang2 in EC inhibits angiogenesis.( 16 ) Ang2 expression is induced in EC under conditions of tissue hypoxia. However, Ang1 expression is not altered by hypoxia and it is expressed constitutively in MC. Therefore, it has been suggested that Ang1 induces cell adhesion between EC and MC, resulting in the stabilization of blood vessel structure and silencing of angiogenesis. In contrast, Ang2 induces sprouting angiogenesis by the inhibition of cell adhesion between EC and MC.
It is widely accepted that high‐level Ang2 expression in tumors both induces hypervascularity by promoting sprouting angiogenesis and enhances tumor growth; this was confirmed in clinical samples of tumors and studies of Ang2 overexpression in tumor xenograft models.( 17 ) However, the role of Ang1 in tumor angiogenesis is less clear. In a xenograft model using Hela cells, knockdown of the Ang1 gene led to decreased tumor growth and angiogenesis( 18 ) and overexpression of Ang1 promoted angiogenesis, resulting in enhanced tumor growth.( 19 ) Therefore, in this case, Ang1 seems to stimulate angiogenesis. In contrast, overexpression of Ang1 in breast( 20 ) and colon cancer cells( 21 ) results in decreased tumor growth and angiogenesis. We hypothesized that these controversial results may have arisen from differences relating to whether MC occur in proximity to blood vessels or not. Ang1 induces cell‐to‐cell adhesion between MC and EC for the structural stabilization of blood vessels and also induces spreading of EC.( 22 , 23 ) In the former function sprouting angiogenesis must be restricted, and in the latter function sprouting angiogenesis is induced. To test whether Ang1 has the ability to alter tumor growth affected by the abundance of MC in the tumor environment, in the present study we examined blood vessel formation in two different types of xenograft tumor model: the colon cancer cell line HT29 and the prostate cancer cell line PC3.
Materials and Methods
Mice, cell lines, and tumors. The HT29 (human colon cancer) and PC3 (human prostate cancer) cell lines were cultured in RPMI‐1640 (Sigma, St Louis, MO, USA) supplemented with 10% fetal bovine serum (Sigma), 100 U/mL penicillin, 100 µg/mL streptomycin, and 4 µg/mL l‐glutamine (only for HT29 cells) at 37 °C in 5% CO2, 95% air. Colon26 (mouse colon cancer), B16 (mouse melanoma), and LLC (mouse lung cancer) cell lines were cultured in Dulbecco's modified Eagle's medium (Sigma) supplemented with 10% fetal bovine serum, 100 U/mL penicillin, and 100 µg/mL streptomycin at 37 °C in an atmosphere of 5% CO2, 95% air.
The mouse Ang1 (mAng1) expression plasmid was constructed by replacing the coding region of enhanced green fluorescent protein (EGFP) in the pEGFP‐N1 vector (Clonetech, Palo Alto, CA, USA) with the mAng1‐FLAG gene. It was transfected into each cell line using Lipofectamine 2000 reagent (Invitrogen, Carlsbad, CA, USA). After transfection, the cells were cultured in medium supplemented with G418 (Gibco, Rockville, MD, USA; 1000 µg/mL for HT29 cells; 800 µg/mL for PC3 cells) to obtain cells stably expressing mAng1 (HT29–Ang1 and PC3–Ang1). Mock vector was used for obtaining control cells (HT29–mock and PC3–mock). The mAng1 gene was transduced into colon26, B16, and LLC cells as described above and cells stably expressing mAng1 were selected with G418 (800 µg/mL). Expression of the mAng1 gene was confirmed by real‐time polymerase chain reaction (PCR) and reverse transcription (RT)–PCR.
KSN female nude mice (7–8 weeks of age), C57BL/6 female mice (7–8 weeks of age), and BALB/c female mice (7–8 weeks of age) were purchased from Japan SLC (Shizuoka, Japan). Subcutaneous xenografts were established by injecting 3.6 × 10⁶ cells into the flanks of mice. Tumor dimensions were measured using a caliper and volume was calculated according to the formula V = (short side)2 × (long side)/2. The mice were killed using ethyl ether anesthesia. Immediately after removal, tumors were fixed for 2 h at 4 °C in 4% paraformaldehyde–phosphate‐buffered saline (pH 7.5) (PBS) and washed with PBS. Subsequently, samples were soaked in 20% sucrose–PBS until sinking. Then, samples were frozen in optimal cutting temperature (OCT) compound (Sakura Finetechnical, Tokyo, Japan) in preparation for subsequent immunohistochemical analyses.
Reverse transcription–polymerase chain reaction and quantitative real‐time polymerase chain reaction. Total RNA was isolated from cultured cells with ISOGEN (Nippon Gene, Tokyo, Japan) following the manufacturer's instructions and 1 µg of the RNA was reverse transcribed using Advantage RT supplied with the PCR kit (Clonetech) using the manufacturer's instruction.
cDNA was quantified by real‐time PCR on a Mx3000P (Stratagene, La Jolla, CA, USA). Real‐time PCR was carried out using Platinum SYBR Green qPCR SuperMix‐UDG (Invitrogen) according to manufacturer's instructions. The amplification step consisted of 40 cycles at 95°C for 15 s and 60°C for 30 s. The relative mRNA expression level was calculated by the comparative threshold cycle (Ct) method, and mouse glyceraldehyde‐3‐phosphate dehydrogenase (mGAPDH) was used as an internal normalization control. Specific oligonucleotide primers were as follows: mAng1, sense 5′‐CTC GTC AGA CAT TCA TCA TCC AG‐3′ and antisense 5′‐CAC CTT CTT TAG TGC AAA GGC T‐3′; for mGAPDH, sense 5′‐AGG TCG GTG TGA ACG GAT TTG‐3′ and antisense 5′‐TGT AGA CCA TCT AGT TGA GGT CA‐3′.
Immunohistological analysis. Tissue fixation and immunohistological analyses of tissue sections were carried out as described previously.( 23 , 24 ) Briefly, the fixed specimens were embedded in OCT compound and sectioned at 20 µm. For the immunofluorescence analyses for counting the number of MC, Cy3‐conjugated mouse anti‐α‐smooth muscle actin (SMA) monoclonal antibody (Sigma) was used for staining MC and nuclei were counterstained with TOPRO3 (Invitrogen). Nuclei of α‐SMA‐stained cells were counted (at ×400 magnification) in five different fields (0.0531 mm2) of the core and peripheral regions in each tumor.
For the immunohistochemical analyses of tumor vessel density, rat antimouse CD31 antibody (BD Biosciences, San Diego, CA, USA) and horseradish peroxidase (HRP)‐conjugated mouse antihuman α‐SMA antibody (Dako, Carpinteria, CA, USA) were used for primary antibodies. As a secondary antibody for anti‐CD31, alkaline phosphatase (AP)‐conjugated goat antirat Ig (BioSource, Camarillo, CA, USA) was used. For the visualization of AP and HRP, a 5‐bromo‐4‐chloro‐3‐indoxyl phosphate and nitro blue tetrazolium chloride (BCIP/NBT) substrate system (Dako) and diaminobenzidine (Dojindo, Kumamoto, Japan) were used, respectively. CD31‐stained vessels were counted (at ×50 magnification) in a 5.73‐mm2 field of the core and peripheral regions of three different tumors.
For the immunofluorescence analyses of tumor vessels covered with MC, rat antimouse CD31 monoclonal antibody and Cy3‐conjugated antihuman α‐SMA antibody were used as primary antibodies. For anti‐CD31 antibody, Alexa488‐conjugated antirat was used as a secondary antibody (Invitrogen). Nuclear staining was carried out using TOPRO3. The degree to which MC adhered to and covered the EC in the blood vessels was evaluated in five fields (0.0531 mm2) at the core and peripheral regions of three different tumors. Blood vessels were divided into three groups according to the degree that MC covered the EC (0–33%, 33–67%, and 67–100%). The average percentage of counted vessels at each degree relative to the total counted vessels was calculated for each tumor.
For all experiments, pictures of fluorescence‐stained sections were taken by confocal microscopy (LSM510; Carl Zeiss MicroImaging, Oberkochen, Germany). Pictures of immunohistochemical‐stained sections were taken by digital microscopy (DM5500B; Leica Microsystems, Nussloch, Germany). Images were processed using Adobe Photoshop 7.0 software (Adobe Systems, San Jose, CA, USA).
Analyses of tumor vessel permeability. Tumor vessel permeability was analyzed by detecting leakage of an injected antibody. Rat anti‐B220 antibody (250 µg) was injected into the tail vein of the subcutaneous xenograft model mouse (on day 14 after inoculation of PC3 or PC3–Ang1 cells, or on day 28 after inoculation of HT29 or HT29–Ang1 cells). One hour after injection, tumors were removed and sections were prepared. For detection of leaked B220 antibody, HRP‐conjugated antirat IgG (BioSource; diluted 1:1000) was used.
Statistical analysis. Results are expressed as the mean ± SD. Student's t‐test was used for statistical analysis. Differences were considered statistically significant if the P‐value was less than 0.05.
Results
Localization of mural cells in the xenograft model using colon cancer and prostate cancer cell lines. It is widely accepted that lack of MC adhesion to EC induces endothelial hyperplasia, resulting in abnormal vascular morphogenesis and leakiness, especially in the core region of tumors.( 25 ) In a xenograft model using the human prostate cancer cell line PC3, we confirmed that there are fewer MC in the core region (center) of a tumor compared with the peripheral region (edge) (Fig. 1Aa,b,B). In contrast, when the human colon cancer cell line HT29 was used for this xenograft model, we found that MC were equally distributed in the core and peripheral regions of the tumor (Fig. 1Ac,d,B). Moreover, the number of MC in the tumors formed by HT29 cells was higher than that in tumors formed by PC3 cells. As reported previously, ectopic overexpression of Ang1 in HT29 cells results in decreased tumor growth.( 21 ) Based on that previous report and our present finding, it may be inferred that the abundance of MC localizing to the tumor alters tumor growth, affecting blood vessel formation by Ang1. Therefore, to test this possibility, we tried to induce mAng1 in both PC3 and HT29 tumor cells (Fig. 2a; PC3–Ang1 and HT29–Ang1) and to observe the proliferation of MC in a tumor xenograft model (1, 2). Our results indicated that Ang1 did not affect the number of MC in either tumor by PC3 or HT29 cells.
Figure 1.
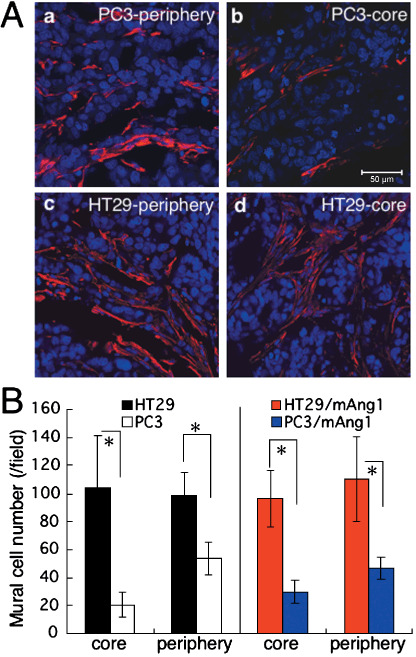
Localization of mural cells in the tumor environment. (A) Tissue sections from (a,b) PC3 and (c,d) HT29 tumors from the (a,c) peripheral and (b,d) core regions were stained with anti‐α‐smooth muscle actin antibody (red). Nuclei were counterstained with TOPRO3 (blue). Scale bar = 50 µm. (B) Statistical evaluations of the number of mural cells in the core and peripheral regions of individual tumors are indicated. Data show the means ± SD from five random fields. *P < 0.01. mAng1, mouse angiopoietin‐1.
Figure 2.
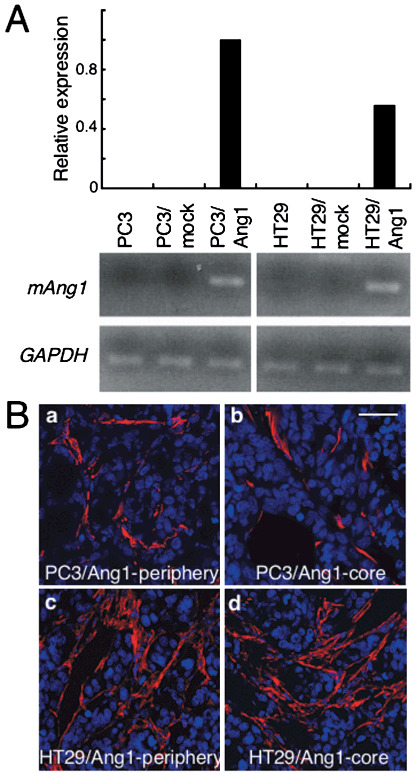
Effect of the overexpression of angiopoietin‐1 (Ang1) in tumor cells on the prevalence of mural cells in tumors. (A) Relative expression of mouse Ang1 (mAng1) mRNA in PC3 and HT29 cells, PC3 and HT29 cells transfected with mock vector (PC3–mock and HT29–mock, respectively), and PC3 and HT29 cells transfected with a vector containing the mouse Ang1 gene (PC3–Ang1 and HT29–Ang1, respectively) detected by real‐time polymerase chain reaction analysis (upper) and further confirmed by reverse transcription–polymerase chain reaction analysis (lower). Glyceraldehyde‐3‐phosphate dehydrogenase (GAPDH) was used as an internal control. (B) Tissue sections from (a,b) PC3–Ang1 and (c,d) HT29–Ang1 tumors from the (a,c) peripheral and (b,d) core regions were stained with anti‐α‐smooth muscle actin antibody (red). Nuclei were counterstained with TOPRO3 (blue). Scale bar = 50 µm.
Angiopoietin‐1 alters tumor growth. To examine the effect of Ang1 on tumor growth, we investigated whether PC3 and HT29 cells express human Ang1 endogenously. However, we could not detect human Ang1 in PC3 or HT29 cells cultured in vitro. It is possible that tumor cells inoculated into mice express human Ang1 by receiving stimuli present in their environment, but we could not detect human Ang1 in the peripheral or core regions of PC3 and HT29 tumors (data not shown).
Transfection of HT29 cells with Ang1 expression vector significantly reduced the growth of tumors derived from HT29–Ang1 cells compared with HT29 parental cells or HT29 cells transduced with mock vector (HT29–mock) (Fig. 3a), confirming a previous report.( 21 ) In contrast, when Ang1 was expressed in PC3 cells by transfection with Ang1 expression vector, the growth of tumors derived from the cells was enhanced significantly compared to that of PC3 parental cells or PC3 cells transduced with mock vector (PC3–mock). We evaluated tumor growth using several Ang1‐induced subclones derived from HT29 and PC3 cells and obtained similar results (Fig. 3).
Figure 3.
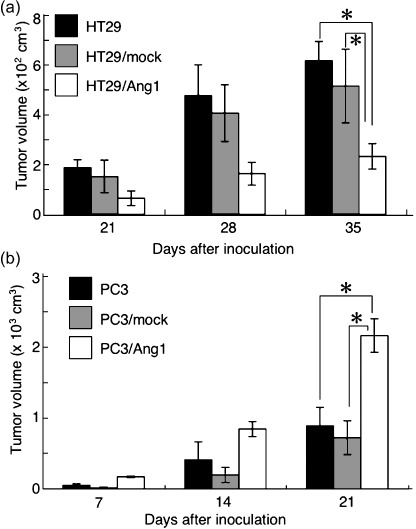
Effect of angiopoietin‐1 (Ang1) overexpression in tumor cells on tumor growth. (a) Tumor growth was evaluated by measuring tumor volume on days 21, 28, and 35 after inoculation of tumor cells as indicated. *P < 0.03 (n = 3). (b) Tumor growth was evaluated by measuring tumor volume on days 7, 14, and 21 after inoculation of tumor cells as indicated. *P < 0.03 (n = 3).
Angiopoietin‐1 enhances angiogenesis in the core region of PC3 tumors. As noted, Ang1 expression in the tumor enhanced tumor growth derived from PC3 cells but inhibited the growth of tumors derived from HT29 cells. We therefore hypothesized that Ang1 enhanced tumor angiogenesis in PC3 tumors but suppressed it in HT29 tumors. As such, we evaluated the number of blood vessels in tumors derived from PC3, PC3–Ang1, HT29, and HT29–Ang1 cells. The number of blood vessels in the peripheral region of tumors was comparable between tumors derived from PC3 and PC3–Ang1 (data not shown). As expected, blood vessel formation was enhanced in tumors from PC3–Ang1 cells in the core region of tumors (Fig. 4Aa,b,B). However, an unexpected finding was that the number of blood vessels in tumors derived from HT29 and HT29–Ang1 cells was not different in the core (Fig. 4Ac,d,B) and peripheral regions of tumors (data not shown). The numbers of blood vessels in PC3 tumors compared with PC3–mock tumors, and in HT29 tumors compared with HT29–mock tumors were not greatly different. Therefore, Ang1‐mediated suppression of tumor growth was not induced by the inhibition of tumor angiogenesis in HT29 cells.
Figure 4.
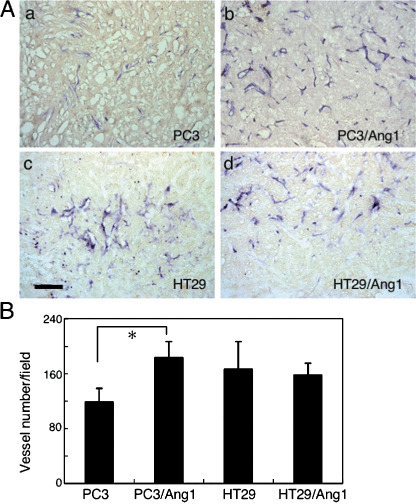
Effect of angiopoietin‐1 (Ang1) overexpression in tumor cells on the number of blood vessels. (A) Tissue sections from the core region of tumors derived from (a) PC3, (b) PC3–Ang1, (c) HT29, and (d) HT29–Ang1 were stained with anti‐α‐smooth muscle actin antibody (brown) and anti‐CD31 antibody (dark blue). Tumors were dissected from mice on day 14 after the inoculation of tumor cells into mice in the case of PC3 and PC3–Ang1 tumors, and on day 28 after inoculation in the case of HT29 and HT29–Ang1 tumors. Scale bar = 500 µm. (B) Statistical evaluations of the number of blood vessels in the core region of individual tumors are indicated. Data show means ± SD from three different tumors. *P < 0.03 (n = 3).
Angiopoietin‐1‐induced mural cell adhesion to endothelial cells in tumor vessels. Finally, we determined the effect of Ang1 on MC adhesion to EC in tumors. For this purpose, we divided blood vessels into three groups according to the percentage of MC that adhered to and covered the EC (0–33%, poorly matured; 33–67%, moderately matured; and 67–100%, highly matured) and evaluated the maturation of blood vessels in tumors. In the case of PC3 tumors, half of the blood vessels were highly matured in the peripheral region of tumors (Fig. 5Aa,e) and Ang1 overexpression slightly enhanced blood vessel maturation (Fig. 5Ac,e). However, in the core region of PC3 tumors, most blood vessels were poorly matured (Fig. 5Ab,f). Ang1 overexpression induced blood vessel maturation in the core region of PC3–Ang1 tumors; however, compared to the peripheral region, most of the blood vessels were in the poorly and moderately matured part (Fig. 5Ad,f). In case of HT29 tumors, most blood vessels in the peripheral region of the tumors were highly matured (Fig. 5Ba,e) and Ang1 overexpression in HT29 cells enhanced blood vessel maturation in the peripheral region of the tumors (Fig. 5Bc,e). Compared to PC3 tumors, half of the blood vessels in the core region of HT29 tumors were highly matured originally (Fig. 5Bb,f) and Ang1 in HT29 cells enhanced maturation of the blood vessels (Fig. 5Bd,f). Therefore, a large difference was observed between PC3 tumors and HT29 tumors in the extent of adhesion of MC to EC in the core region of tumors; that is, lack of MC adhesion to EC was broadly observed in the core region of PC3 tumors, which is a well‐known characteristic of most of tumors. On the other hand, in the case of HT29 tumors, blood vessels were well matured in the core region as well as the peripheral region of the tumors. The maturation of blood vessels in PC3 compared with PC3–mock tumors, and in HT29 compared with HT29–mock tumors was not notably different. Therefore, we concluded that the mechanism whereby Ang1 alters tumor growth depends on the proportion of mature blood vessels in the tumors.
Figure 5.
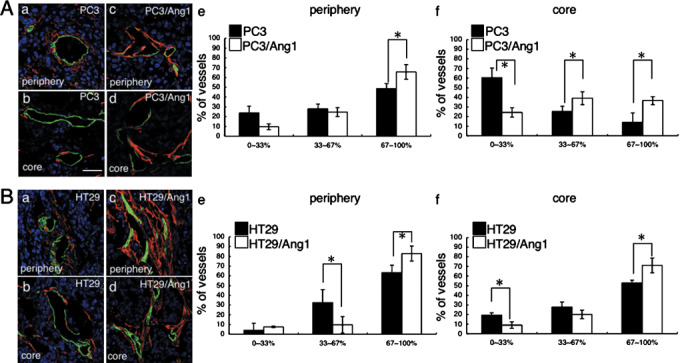
Effect of angiopoietin‐1 (Ang1) overexpression in tumor cells on the maturation of blood vessels. (A) Tissue sections from (a,b) PC3 and (c,d) PC3–Ang1 tumors from the (a,c) peripheral and (b,d) core regions were stained with anti‐α‐smooth muscle actin (SMA) antibody (red) and anti‐CD31 antibody (green). Nuclei were counterstained with TOPRO3 (blue). Tumors were dissected from mice on day 14 after inoculation of tumor cells into mice in the case of PC3 and PC3–Ang1 tumors, and on day 28 in the case of HT29 and HT29–Ang1 tumors. Scale bar = 50 µm. (e,f) Statistical evaluations of the maturation of blood vessels from the (e) peripheral and (f) core regions of tumors. Data show means ± SD from five random fields. *P < 0.03 (n = 5). (B) Tissue sections from (a,b) HT29 and (c,d) HT29–Ang1 tumors from the (a,c) peripheral and (b,d) core regions were stained with anti‐α‐SMA (red) and anti‐CD31 (green) antibodies. Nuclei were counterstained with TOPRO3 (blue). (e,f) Statistical evaluations of the maturation of blood vessels in the (e) peripheral and (f) core regions of tumors. Data show means ± SD from five random fields. *P < 0.03 (n = 5).
Discussion
In the present study, we evaluated the function of Ang1 for tumor growth and found that Ang1 alters tumor growth depending on whether blood vessels in tumors are mature or not. Ang1 has paradoxical roles in angiogenesis: Tie2 activation on EC by Ang1 induces cell adhesion between EC and MC,( 11 , 12 , 15 ) resulting in the silencing of angiogenesis, and Tie2 activation induces spreading of EC( 22 , 23 ) in the absence of MC adhesion to EC, resulting in the promotion of angiogenesis. In the case of PC3 tumors, there was a notable lack of MC adhesion in the core region of tumors. Although Ang1 overexpression induced a small degree of maturation of blood vessels in this region, most of the blood vessels were immature. Therefore, Ang1 induced sprouting of EC, resulting in enhanced angiogenesis and tumor growth (type A in Fig. 6). However, in the case of HT29 tumors, blood vessels were well matured in both the peripheral and core regions of the tumors and MC not adhering to EC were also observed near the blood vessels (Fig. 5Bb). In this situation, overexpression of Ang1 enhanced the formation of highly mature blood vessels (type B in Fig. 6). As seen with human tumor cell lines, when mouse tumor cell lines were used for the tumor xenograft model, Ang1 altered tumor growth depending on the incidence of MC in the core region of the tumor (Table 1).
Figure 6.
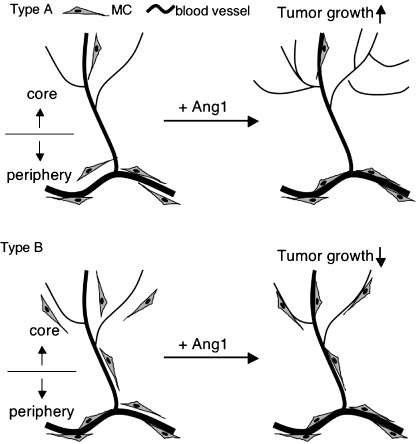
Summary of angiopoietin‐1 (Ang1) function in two types of tumors. In a type A tumor, for example PC3, the incidence of mural cells (MC) is very low and blood vessels are not highly mature, especially in the core region of the tumor. In this type of tumor, Ang1 induced sprouting angiogenesis rather than maturation of blood vessels, resulting in enhancement of tumor growth. On the other hand, in a type B tumor, for example HT29, the blood vessels are highly mature in both the core and peripheral regions. In this type of tumor, Ang1 enhanced maturation of blood vessels rather than sprouting angiogenesis. In this case, suppression of permeability may be one of the reasons for the inhibition of tumor growth.
Table 1.
Effect of angiopoietin‐1 (Ang1) on tumor growth in association with mural cell (MC) incidence
| Tumor | MC incidence | Effect of Ang1 on tumor growth | Ang1 expression fold increase † | |
|---|---|---|---|---|
| Periphery | Core | |||
| Human | ||||
| PC3 | Observed frequently | Not observed frequently | Enhanced | |
| HT29 | Observed frequently | Observed frequently | Suppressed | |
| Mouse | ||||
| Colon26 (colon cancer) | Observed frequently | Not observed frequently | Enhanced | 114.5 |
| B16 (melanoma) | Observed frequently | Observed frequently | Suppressed | 110.7 |
| LLC (lung cancer) | Observed frequently | Observed frequently | Suppressed | 92.4 |
Fold increase of mouse Ang1 mRNA expression in tumor cells transfected with Ang1 expression vector compared with Ang‐1 expression vector non‐induced tumor cells. Data are representative of three independent real‐time polymerase chain reaction analyses.
In theory, MC adhesion to EC may inhibit angiogenesis; however, our results indicated that enhancement of blood vessel maturation by Ang1 did not alter the number of blood vessels in HT29–Ang1 tumors compared with HT29 tumors. The reason why enhancement of blood vessel maturation inhibited tumor growth without suppression of angiogenesis is not clear in the present study. A previous report showed that transduction of Ang1 into colon carcinoma cells resulted in the suppression of tumor growth with the inhibition of angiogenesis.( 21 ) However, another report showed that Ang1 inhibits squamous cell carcinoma growth, not by affecting vascular density but by enhancing blood vessel maturation.( 26 ) Our result is comparable to that of the latter report. How blood vessel maturation inhibits tumor growth is not clearly understood at present and further analysis is required. However, a functional change in permeability from blood vessels for the penetration of oxygen and nutrients into deep sites of tumors( 27 ) may be critical for regulating tumor growth by Ang1. Indeed, when permeability was compared in tumors, Ang1 inhibited permeability in the core region of HT29 tumors and, conversely, Ang1 enhanced permeability in the core region of PC3 tumors (Fig. 7). However, Ang1 did not affect permeability in the peripheral region of tumors in either HT29 or PC3 tumors (data not shown). These findings suggested that maturation of blood vessels in the core region brought about by Ang1 resulted in the suppression of tumor growth in the case of HT29 tumors and that induction of abundant immature blood vessel formation in the core region by Ang1 resulted in enhancement of tumor growth in the case of PC3 tumors.
Figure 7.
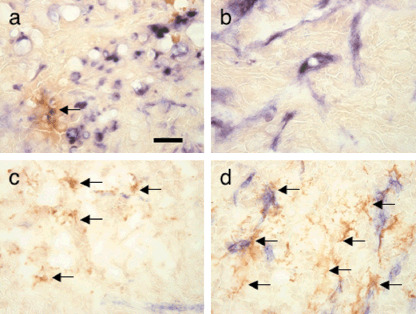
Alteration of vascular permeability by angiopoietin‐1 (Ang1) in tumors. Extravasation of anti‐B220 antibody from blood vessels is demonstrated by staining with horseradish peroxidase‐conjugated antirat IgG in the core regions of (a) HT29, (b) HT29–Ang1, (c) PC3, and (d) PC3–Ang1 tumors (brown color indicated by arrows). Scale bar = 50 µm.
It is widely accepted that an imbalance of proangiogenic and antiangiogenic factors, especially a dominance of proangiogenic factors, in the tumor environment induces abnormal blood vessel formation.( 28 ) This abnormality in blood vessels includes leakiness, tortuousness, and dilation, which are caused mainly by loss of MC adhesion to EC.( 25 ) These abnormalities contribute to the heterogeneity of tumor blood flow, resulting in hypoxia with interstitial hypertension.( 25 ) Hypoxia induces angiogenesis, which leads to continuing proliferation of tumor cells. Therefore, antitumor therapies targeting angiogenesis have been developed to destroy the tumor vasculature. However, recently, new concepts have emerged that are based on normalization of abnormal blood vessels in the tumor environment by inducing MC adhesion to EC to more effectively deliver oxygen and drugs.( 29 ) This idea came from evidence that administration of a single antiangiogenic inhibitor is not effective for cancer therapy( 30 ) but a combination of antiangiogenic inhibitors as anticancer therapy is more effective for the survival rate of colorectal cancer patients.( 31 ) However, as observed in our study, maturation of blood vessels by adhesion of MC to EC was sufficient to inhibit HT29 tumor growth without another anticancer drug. Therefore, downregulation of proangiogenic factors such as VEGF, Ang2, or upregulation of antiangiogenic factors such as Ang1 and PDGF‐BB may exert normalization or maturation of blood vessels by different mechanisms.
In the present study, however, Ang1 induced angiogenesis as well as the maturation of blood vessels in PC3 tumors, resulting in the enhancement of tumor growth. From this result, it is apparent that Ang1 administration is effective for tumor suppression when MC are observed abundantly in the entire tumor environment. For the clinical application of Ang1 or Tie2 agonist in tumors, pathological diagnosis before treatment is required. Moreover, recruitment of MC into the tumor environment may be a way to augment the action of Tie2 agonist in tumors. Compared to PC3 tumors, more MC were observed in HT29 tumors. We tried to distinguish this difference by the expression of PDGF‐BB, which induces recruitment of MC.( 10 ) However, PDGF‐BB expression was not different between HT29 and PC3 cells. Therefore, further information on the molecular mechanism by which MC recruitment is induced abundantly in HT29 tumors compared with PC3 tumors would shed light on the maturation process of blood vessels in the tumor environment.
Acknowledgments
We thank N. Fujimoto for preparation of plasmid DNA and K. Fukuhara for administrative assistance. This work was supported in part by a Grant‐in‐Aid from The Ministry of Education, Culture, Sports, Science, and Technology of Japan. There is no conflict of interest.
References
- 1. Risau W. Mechanisms of angiogenesis. Nature 1997; 386: 671–4. [DOI] [PubMed] [Google Scholar]
- 2. Gale NW, Yancopoulos GD. Growth factors acting via endothelial cell‐specific receptor tyrosine kinases: VEGFs, angiopoietins, and ephrins in vascular development. Genes Dev 1999; 13: 1055–66. [DOI] [PubMed] [Google Scholar]
- 3. Oettgen P. Transcriptional regulation of vascular development. Circ Res 2001; 89: 380–8. [DOI] [PubMed] [Google Scholar]
- 4. Carmeliet P. Angiogenesis in health and disease. Nat Med 2003; 9: 653–60. [DOI] [PubMed] [Google Scholar]
- 5. Gerhardt H, Betsholtz C. Endothelial–pericyte interactions in angiogenesis. Cell Tissue Res 2003; 314: 15–23. [DOI] [PubMed] [Google Scholar]
- 6. Simon MC. Vascular morphogenesis and the formation of vascular networks. Dev Cell 2004; 6: 479–82. [DOI] [PubMed] [Google Scholar]
- 7. Wang HU, Chen ZF, Anderson DJ. Molecular distinction and angiogenic interaction between embryonic arteries and veins revealed by ephrin‐B2 and its receptor Eph‐B4. Cell 1998; 93: 741–53. [DOI] [PubMed] [Google Scholar]
- 8. Adams RH, Wilkinson GA, Weiss C et al . Roles of ephrinB ligands and EphB receptors in cardiovascular development: demarcation of arterial/venous domains, vascular morphogenesis, and sprouting angiogenesis. Genes Dev 1999; 13: 295–306. [DOI] [PMC free article] [PubMed] [Google Scholar]
- 9. Zhong TP, Childs S, Leu JP, Fishman MC. Gridlock signalling pathway fashions the first embryonic artery. Nature 2001; 414: 216–20. [DOI] [PubMed] [Google Scholar]
- 10. Lindahl P, Johansson BR, Leveen P, Betsholtz C. Pericyte loss and microaneurysm formation in PDGF‐B‐deficient mice. Science 1997; 277: 242–5. [DOI] [PubMed] [Google Scholar]
- 11. Dumont DJ, Gradwohl G, Fong GH et al . Dominant‐negative and targeted null mutations in the endothelial receptor tyrosine kinase, tek, reveal a critical role in vasculogenesis of the embryo. Genes Dev 1994; 8: 1897–909. [DOI] [PubMed] [Google Scholar]
- 12. Sato TN, Tozawa Y, Deutsch U et al . Distinct roles of the receptor tyrosine kinases Tie‐1 and Tie‐2 in blood vessel formation. Nature 1995; 376: 70–4. [DOI] [PubMed] [Google Scholar]
- 13. Suri C, Jones PF, Patan S et al . Requisite role of angiopoietin‐1, a ligand for the Tie‐2 receptor, during embryonic angiogenesis. Cell 1996; 87: 1171–80. [DOI] [PubMed] [Google Scholar]
- 14. Valenzuela DM, Griffiths JA, Rojas J et al . Angiopoietins 3 and 4: diverging gene counterparts in mice and humans. Proc Natl Acad Sci USA 1999; 96: 1904–9. [DOI] [PMC free article] [PubMed] [Google Scholar]
- 15. Takakura N, Huang XL, Naruse T et al . Critical role of the TIE2 endothelial cell receptor in the development of definitive hematopoiesis. Immunity 1998; 9: 677–86. [DOI] [PubMed] [Google Scholar]
- 16. Maisonpierre PC, Suri C, Jones PF et al . Angiopoietin‐2, a natural antagonist for Tie2 that disrupts in vivo angiogenesis. Science 1997; 277: 55–60. [DOI] [PubMed] [Google Scholar]
- 17. Metheny‐Barlow LJ, Li LY. The enigmatic role of angiopoietin‐1 in tumor angiogenesis. Cell Res 2003; 13: 309–17. [DOI] [PubMed] [Google Scholar]
- 18. Shim WS, Teh M, Mack PO, Ge R. Inhibition of angiopoietin‐1 expression in tumor cells by an antisense RNA approach inhibited xenograft tumor growth in immunodeficient mice. Int J Cancer 2001; 94: 6–15. [DOI] [PubMed] [Google Scholar]
- 19. Shim WS, Teh M, Bapna A et al . Angiopoietin 1 promotes tumor angiogenesis and tumor vessel plasticity of human cervical cancer in mice. Exp Cell Res 2002; 279: 99–309. [DOI] [PubMed] [Google Scholar]
- 20. Hayes AJ, Huang WQ, Yu J et al . Expression and function of angiopoietin‐1 in breast cancer. Br J Cancer 2000; 83: 1154–60. [DOI] [PMC free article] [PubMed] [Google Scholar]
- 21. Ahmad SA, Liu W, Jung YD et al . The effects of angiopoietin‐1 and ‐2 on tumor growth and angiogenesis in human colon cancer. Cancer Res 2001; 61: 1255–9. [PubMed] [Google Scholar]
- 22. Witzenbichler B, Maisonpierre PC, Jones P, Yancopoulos GD, Isner JM. Chemotactic properties of angiopoietin‐1 and ‐2, ligands for the endothelial‐specific receptor tyrosine kinase Tie2. J Biol Chem 1998; 273: 18 514–21. [DOI] [PubMed] [Google Scholar]
- 23. Takakura N, Watanabe T, Suenobu S et al . A role for hematopoietic stem cells in promoting angiogenesis. Cell 2000; 102: 199–209. [DOI] [PubMed] [Google Scholar]
- 24. Yamada Y, Takakura N. Physiological pathway of differentiation of hematopoietic stem cell population into mural cells. J Exp Med 2006; 203: 1055–65. [DOI] [PMC free article] [PubMed] [Google Scholar]
- 25. Hellström M, Gerhardt H, Kalén M et al . Lack of pericytes leads to endothelial hyperplasia and abnormal vascular morphogenesis. J Cell Biol 2001; 153: 543–53. [DOI] [PMC free article] [PubMed] [Google Scholar]
- 26. Hawighorst T, Skobe M, Streit M et al . Activation of the tie2 receptor by angiopoietin‐1 enhances tumor vessel maturation and impairs squamous cell carcinoma growth. Am J Pathol 2002; 160: 1381–92. [DOI] [PMC free article] [PubMed] [Google Scholar]
- 27. Hamzah J, Jugold M, Kiessling F et al . Vascular normalization in Rgs5‐deficient tumours promotes immune destruction. Nature 2008; 453: 410–14. [DOI] [PubMed] [Google Scholar]
- 28. Jain RK. Molecular regulation of vessel maturation. Nat Med 2003; 9: 685–93. [DOI] [PubMed] [Google Scholar]
- 29. Jain RK. Normalization of tumor vasculature: an emerging concept in antiangiogenic therapy. Science 2005; 307: 58–62. [DOI] [PubMed] [Google Scholar]
- 30. Yang JC, Haworth L, Sherry RM et al . A randomized trial of bevacizumab, an anti‐vascular endothelial growth factor antibody, for metastatic renal cancer. N Engl J Med 2003; 349: 427–34. [DOI] [PMC free article] [PubMed] [Google Scholar]
- 31. Hurwitz H, Fehrenbacher L, Novotny W et al . Bevacizumab plus irinotecan, fluorouracil, and leucovorin for metastatic colorectal cancer. N Engl J Med 2004; 350: 2335–42. [DOI] [PubMed] [Google Scholar]