

Abstract
The poor prognosis of patients with hepatocellular carcinoma (HCC) is attributed to intrahepatic recurrence. To understand the molecular background of early intrahepatic recurrence, we conducted a global protein expression study. We compared the protein expression profiles of the primary HCC tissues of 12 patients who showed intrahepatic recurrence within 6 months post surgery with those of 15 patients who had no recurrence 2 years post surgery. Two‐dimensional difference gel electrophoresis identified 23 protein spots, the intensity of which was highly associated with early intrahepatic recurrence. To validate the prediction performance of the identified proteins, we examined additional HCC tissues from 13 HCC patients; six with early intrahepatic recurrence and seven without recurrence. We found that all but one of the 13 patients were grouped according to their recurrence status based on the intensity of the 23 protein spots. Mass spectrometry identified 23 proteins corresponding to the spots. Although 13 of 23 have been previously reported to be correlated with HCC, their association with early intrahepatic recurrence had not been established. The identified proteins are involved in signal transduction pathways, glucose metabolism, cytoskeletal structure, cell adhesion, or function as antioxidants and chaperones. The identified proteins may be candidates for prognostic markers and contribute to the improvement of existing therapeutic strategies. (Cancer Sci 2007; 98: 665–673)
Despiterecent progress in early diagnostic modalities and therapeutic management, the prognosis of hepatocellular carcinoma (HCC) patients remains poor, mainly due to intrahepatic recurrence.( 1 ) The incidence of intrahepatic recurrence in the liver remnant ranges from 50% to 100% of HCC patients who undergo curative resection as a result of either intrahepatic metastasis from the primary tumor or multicentric recurrence( 2 , 3 , 4 , 5 , 6 ) and the median survival after recurrence is only 11 months.( 7 ) Although various molecular alterations have been correlated with early recurrence of HCC( 8 , 9 , 10 , 11 , 12 , 13 ) and studies on such events furthered our understanding of HCC biology, the underlying mechanisms remain obscure. Studies focusing on individual candidate genes may be insufficient for precisely understanding the background of the malignant behavior of tumor cells, because the features of cancer cells are defined by multiple genetic alterations in a functionally coordinated manner. With this notion in mind, global mRNA expression analyses have been conducted to identify the gene network associated with early intrahepatic recurrence.( 14 , 15 , 16 , 17 ) Such molecular pathogenesis studies may lead to the development of gene‐based biomarkers and novel therapeutic strategies. However, mRNA expression reflects the protein expression of only a small proportion of genes, probably because of post‐translational control of protein quantity.( 18 , 19 , 20 , 21 ) To complement gene expression studies, global protein expression profiling, namely a proteomic approach, has been carried out for the study of HCC.( 22 , 23 , 24 , 25 , 26 , 27 , 28 ) Conceptually, proteomics reflects the molecular background of cancer phenotypes more directly, as the final product of genetic and epigenetic events is the proteins contained in the cells.
In this study we investigated the protein expression of HCC tissues from patients with early intrahepatic recurrence and from patients without recurrence. We used two‐dimensional fluorescence difference gel electrophoresis (2D‐DIGE) to generate quantitative protein expression profiles, and data‐mining methods and mass spectrometry to determine the proteins associated with early intrahepatic recurrence.
Materials and Methods
Patients. HCC patients who had undergone surgery at the National Cancer Center Hospital from January 1998 to April 2000 were evaluated for inclusion in this study. We assessed 40 patients who showed intrahepatic recurrence within 6 months or no recurrence within 2 years post surgery. The absence of intrahepatic metastasis in the residual liver was monitored by ultrasonography (US), computer tomography (CT) scans and angiography preoperatively, and was further confirmed by intraoperative US. CT scans were also carried out to rule out distant metastasis. Surgical margins were assessed post surgery by experienced pathologists. The patients were monitored for HCC recurrence at least once every 4 months after surgery using US and CT scans. To identify the protein spots associated with early intrahepatic recurrence, we validated the prediction performance of the selected spots using a newly enrolled sample set. The clinico‐pathological characteristics of the patient groups are summarized in Table 1. There was no significant difference of virus type between the early recurrence group and non‐recurrence group in both the training and test set. The number of primary tumor, venous invasion, and tumor‐node‐metastasis (TNM) staging were significantly different between the early recurrence and non‐recurrence groups in the training set (Table 1). The majority of cases were infected with hepatitis C virus (Table 1). This project was approved by the institutional review board for the use of human subjects of the National Cancer Center.
Table 1.
Clinical information of the patients
| Training set | Test set | |||||
|---|---|---|---|---|---|---|
| Early recurrence group (n = 12) | Non‐recurrence group (n = 15) | P‐value | Early recurrence group (n = 6) | Non‐recurrence group (n = 7) | P‐value | |
| Age (mean ± SD) | 63.2 ± 5.5 | 67.3 ± 3.6 | 0.06 | 60.5 ± 7.2 | 61 ± 9.1 | 0.91 |
| Gender (%) | ||||||
| Male | 7 (58.3) | 12 (80) | 0.06 | 5 (83.3) | 7 (100) | 0.46 |
| Female | 5 (41.7) | 3 (20) | 1 (16.7) | 0 (0) | ||
| Viral infection (%) | ||||||
| HBV(+) | 1 (8.3) | 3 (20) | 0.43 | 3 (50) | 2 (28.6) | 0.1 |
| HCV(+) | 7 (58.4) | 10 (66.7) | 1 (16.7) | 4 (57.1) | ||
| HBV(+)HCV(+) | 1 (8.3) | 0 (0) | 0 (0) | 1 (14.3) | ||
| HBV(–)HCV(–) | 3 (25) | 2 (13.3) | 2 (33.3) | 0 (0) | ||
| Child‐Pugh classification (%) | ||||||
| A | 12 (100) | 15 (100) | 6 (100) | 7 (100) | ||
| B | 0 (0) | 0 (0) | – | 0 (0) | 0 (0) | – |
| C | 0 (0) | 0 (0) | 0 (0) | 0 (0) | ||
| ICG‐15 (mean ± SD) | 19.7 ± 10.5 | 15.4 ± 9 | 0.26 | 22.1 ± 15.3 | 18.5 ± 9.8 | 0.63 |
| AFP (ng/mL) | ||||||
| > 400 | 4 (33.3) | 1 (6.7) | 0.13 | 0 (0) | 2 (28.6) | 0.46 |
| ≤ 400 | 8 (66.7) | 14 (93.3) | 6 (100) | 5 (71.4) | ||
| Tumor size (mean ± SD) | 6.6 ± 5.2 | 4.1 ± 1.5 | 0.14 | 9.3 ± 7.3 | 4.5 ± 1.3 | 0.18 |
| Primary lesion (%) | ||||||
| Single | 2 (16.7) | 14 (93.3) | < 0.001 | 1 (16.7) | 7 (100) | 0.004 |
| Multiple | 10 (63.3) | 1 (6.7) | 5 (83.3) | 0 (0) | ||
| Gross type (%) | ||||||
| Type 1 | 3 (25) | 7 (46.7) | 0 (0) | 4 (57.1) | ||
| Type 2 | 4 (33.3) | 6 (40) | 0.2 | 2 (33.3) | 3 (42.9) | 0.06 |
| Type 3 | 5 (41.7) | 2 (13.3) | 4 (66.7) | 0 (0) | ||
| Tumor differentiation (%) | ||||||
| Well | 0 (0) | 3 (20) | 0 (0) | 2 (28.6) | ||
| Moderately | 7 (58.3) | 10 (66.7) | 0.18 | 4 (66.7) | 4 (57.1) | 0.62 |
| Poorly | 5 (41.7) | 2 (13.3) | 2 (33.3) | 1 (14.3) | ||
| Venous invasion (%) | ||||||
| Presence | 12 (100) | 6 (40) | 0.001 | 5 (83.3) | 4 (57.1) | 0.31 |
| Absence | 0 (0) | 9 (60) | 1 (16.7) | 3 (42.9) | ||
| UICC pTNM stage (%) | ||||||
| Stage I | 0 (0) | 0 (0) | < 0.001 | 0 (0) | 0 (0) | 0.03 |
| Stage II | 0 (0) | 12 (80) | 0 (0) | 4 (57.1) | ||
| Stage IIIA | 10 (83.3) | 3 (20) | 3 (50) | 3 (42.9) | ||
| Stage IVA | 2 (16.7) | 0 (0) | 3 (50) | 0 (0) | ||
| Background liver (%) | ||||||
| Normal | 0 (0) | 1 (6.7) | 1 (16.7) | 0 (0) | ||
| Chronic hepatitis | 9 (75) | 12 (80) | 0.49 | 4 (66.6) | 6 (85.7) | 0.79 |
| Cirrhosis | 3 (25) | 2 (13.3) | 1 (16.7) | 1 (14.3) | ||
AFP, alpha‐fetoprotein; HBV, hepatitis B virus; HCV, hepatitis C virus; ICG, indocyanine green; pTNM, pathological TNM; UICC, Union Internationale Centre le Cancer
Protein extraction, fluorescence labeling and separation by two‐dimensional polyacrylamide gel electrophoresis. The tissue specimens obtained from the surgically resected tumors were stored in vapor nitrogen until use. The frozen tissues were homogenized in urea lysis buffer (7 M urea, 2 M thiourea, 3% CHAPS, 1% Triton X‐100) and incubated on ice for 30 min. After centrifugation at 15 000 g for 30 min, the supernatant was recovered. Fluorescence labeling of proteins was carried out as described previously (Fig. 1A).( 22 ) In brief, a portion of all samples was mixed together to make an internal control sample, aliquoted and stored at −80°C until use. Fifty micrograms of both the internal control sample and each experimental sample were labeled with 200 nmol of 1‐(5‐carboxypentyl)‐1′‐propylindocarbocyamine halide (Cy3) and 1‐(5‐carboxypentyl)‐1′‐methylindocarbocyamine halide (Cy5) (GE Healthcare Bio‐sciences, Little Chalfont, Buckinghamshire, UK), respectively. After the labeling reaction was terminated with 0.2 mM lysine, equal amounts of the Cy3‐ or Cy5‐labeled samples were mixed and the sample volume was made up to 420 µL with urea lysis buffer containing 65 mM dithiothreitol (DTT) and 1% ampholine (Amersham Biosciences, Upsala, Sweden).
Figure 1.
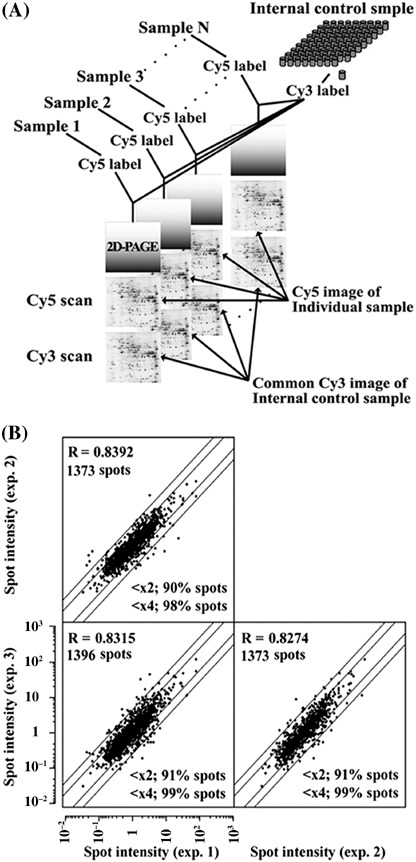
(A) Fluorescence labeling and separation by two‐dimensional polyacrylamide gel electrophoresis (2D‐PAGE). A protein sample from a cell line and the internal control sample were labeled with Cy5 and Cy3, respectively. The Cy5‐labeled sample was mixed with the Cy3‐labeled internal control sample and coseparated in the gel. The Cy5 images such as the one shown here represent the protein expression profile of individual samples while the Cy3 image represents that of the common internal control sample. (B) Scatter plot analysis of three protein expression profiles obtained from the same sample. The intensity values obtained for each of the protein spots ranged within a twofold difference between the experiments for more than 90% of the spots.
Two‐dimensional gel electrophoresis was carried out as in our previous report (Fig. 1A).( 22 ) In brief, the first separation was achieved using IPG DryStrip gels (24 cm long with a pI range between 3.0 and 10.0, Amersham Biosciences) and IPGphor (GE Healthcare Bio‐sciences), and the second‐dimension separation was achieved using Ettan Dalt II and 9–15% polyacrylamide gradient gels. Identical samples were run in triplicate gels. After electrophoresis, gels were scanned with 2920 2D‐Master Imager (GE Healthcare Bio‐sciences). The Cy5‐image of each sample was normalized by the Cy3‐image of the internal standard sample using the DeCyder software (GE Healthcare Bio‐sciences).
We analyzed the acquired proteome data, which consisted of the intensity signal ratios of approximately 1400 protein spots from 40 HCC samples, using the Impressionist software (Gene Data, Basel, Switzerland). We assessed the reproducibility of the acquired protein profiles by running an identical sample three times and examining the similarities between the protein expression profiles with scatter plot analysis. The intensity values obtained for each of the protein spots ranged within a twofold difference between the experiments for more than 90% of the spots, while the correlation coefficient for the overall protein expression was at least 0.8274 (Fig. 1B). These results indicated that the protein expression profiles obtained by 2D‐DIGE were highly reproducible both in a quantitative and in a qualitative way.
Mass spectrometric identification of proteins. Protein identification was achieved as reported previously.( 22 ) In brief, a 500‐µg protein sample was separated by two‐dimensional polyacrylamide gel electrophoresis (2D‐PAGE) and stained with SYPRO Ruby (Molecular Probes, Eugene, OR, USA). SpotPicker (GE Healthcare Bio‐sciences) collected the spots of interest. The tryptic peptides generated by in‐gel digestion( 22 ) were subjected to matrix‐assisted laser desorption/ionization time‐of‐flight mass spectrometry (MALDI‐TOF MS) using a Q‐Star Pulser‐i equipped with an orthogonal injection/MALDI ion source (Applied Biosystems, Framingham, CA, USA). Mass spectra were processed with the Analyst QS program (Applied Biosystems) and Mascot program (Matrix Science, Boston, MA, USA) using the Swiss‐Prot database for protein identification.
Results
We created a training set of 27 samples, consisting of 12 samples from patients who had early intrahepatic recurrence within 6 months and 15 samples from patients who had no recurrence within 2 years post surgery. We first examined the similarity between the 2D profiles of the samples in the training set. The correlation efficiency of all paired samples was calculated and the results were summarized in a correlation matrix (Fig. 2A). We found that the protein expression patterns of samples within each group (the non‐recurrence and the early recurrence group) were very similar to each other, while they were different to those of the other group, suggesting the presence of a certain proteomic background corresponding to the events leading to the recurrence. This observation allowed us to construct an early recurrence prediction model using spot intensity. We used a support‐vector‐machine algorithm to build a class prediction model. A support‐vector‐machine creates the hyper‐plane in a multidimensional space to best‐distinguish two sample groups.( 29 ) We identified the minimal number of protein spots that can be used to classify the samples with the minimal misclassification error rate. First, we constructed a classifier using a certain number of spots and calculated the misclassification error rate by a leave‐one‐out cross validation. Then, we ranked the protein spots according to their contribution to the classification model using support vector machine weight. The classification model was then constructed again after the lower‐ranked protein spots were deleted, and its misclassification rate was calculated. This process was repeated and the misclassification error rates were plotted as a function of the number of protein spots (Fig. 2B). Although the classifier that included all protein spots had a discriminatory power of 100% accuracy (0% misclassification error rate), a classifier with a smaller spot number (23 spots) also showed 0% misclassification error rate and was considered as the optimal for the classification model to distinguish the samples according to their recurrence status. These 23 protein spots are the minimal protein set to distinguish these two groups based on the support‐vector machine algorithm, and the reduction of the number of spots resulted in the increased misclassification error rate.
Figure 2.
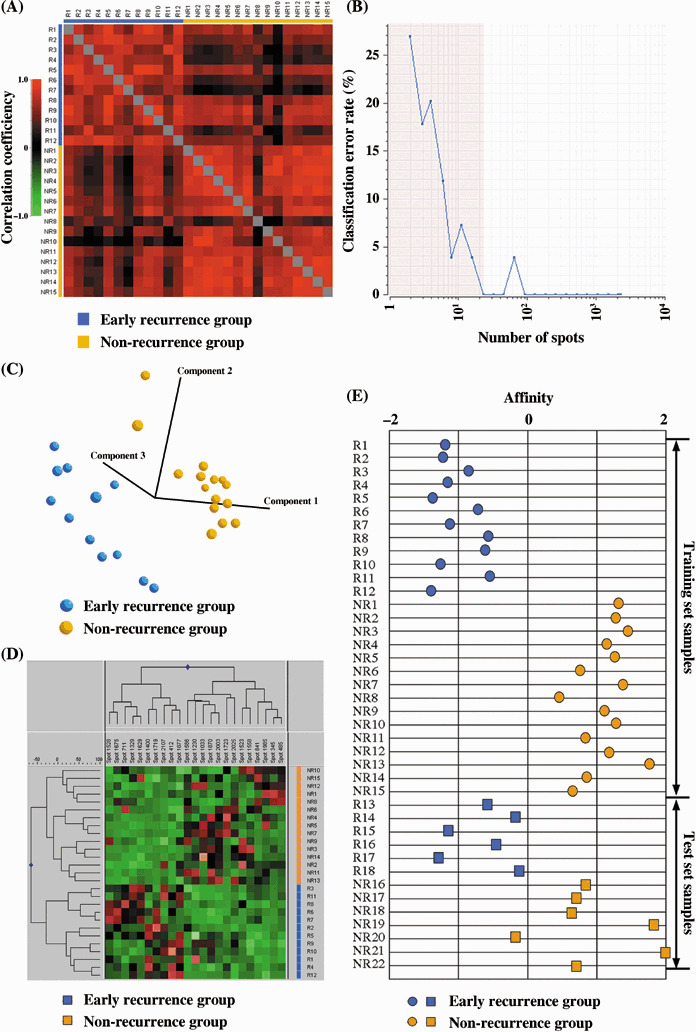
Protein spots associated with early intrahepatic recurrence. (A) Correlation matrix showing the similarity of the overall feature of proteome. (B) A leave‐one‐out cross‐validation error rate was plotted as a function of spot number, showing that the minimal number of spots to make the error rate 0% was 23. Principal component analysis (C) and hierarchical clustering analysis (D) clearly separated the samples according to their recurrence status using the 23 selected protein spots. (E) All but one of the samples in the training and test set were correctly classified on the basis of the expression pattern of the 23 protein spots. The patients were assigned as those that had early recurrence within 6 months (R1‐R18) and those that did not have recurrence for 2 years post surgery (NR1‐NR22).
The classification performance of the 23 selected protein spots was validated using different classification methods. With principal component analysis, which visualizes the correlation of samples in a three‐dimensional space created by the intensity of the 23 protein spots, the 27 samples were clearly separated according to their recurrence status (Fig. 2C). A hierarchical clustering study based on similarities in the expression profiles of the 23 protein spots categorized the early intrahepatic recurrence and non‐recurrence groups into distinct branches (Fig. 2D). As the separation was ambiguous when all spots were used (data not shown), these 23 protein spots characterized the proteome of the tumors with or without recurrence.
The predictive performance of the selected set of spots was validated using a test set, which consisted of early intrahepatic recurrence (n = 6) and non‐recurrence cases (n = 7). We determined the affinity value of each sample by calculating the minimal distance between each sample and the hyper‐plane (Fig. 2E). The distance was defined so that the samples classified in the recurrence group had a positive distance value while the samples categorized in the non‐recurrence group had a negative value. Figure 2(E) shows that all samples except NR20 were correctly classified into the groups. The expression pattern of the 23 proteins in sample NR20 was more similar to that of the recurrence group, although there were no clinico‐pathological features unique to this case.
The portal vein is the main route for intrahepatic metastasis, and portal invasion is correlated with early recurrence.( 30 ) We therefore examined the proteins associated with portal invasion and the number of primary lesions. The training sample set was divided to portal invasion positive (n = 18) and negative (n = 9) cases (Table 1). We did not find a protein spot set with a misclassification rate of less than 13%. Using the selected protein spots, principal component analysis and hierarchical clustering analysis did not separate the samples according to their portal invasion status (data not shown). The number of primary lesions (single or multiple) has been also associated with early recurrence.( 31 ) We separated the samples in the training set into two groups: cases with single primary tumors (n = 16) and multiple primary tumors (n = 11) (Table 1). We did not identify any spots based on which the HCC samples could be separated according to the number of primary tumors (data not shown).
The location of the 23 protein spots on the 2D image is demonstrated in Figure 3(A). Figure 3(B) shows the 2D differential expression images of the 23 spots. We used a standardized spot intensity, which was calculated by dividing the intensity of the Cy5 signal by that of the Cy3 signal for each protein spot in the same gel, and the apparent spot intensity in the Cy5 image did not necessarily reflect the normalized intensity (Fig. 3B). Thus, we demonstrate the standardized spot intensity across the samples used to compare the expression level among the samples (Fig. 4). The mean ratios of the identified proteins in the recurrence and non‐recurrence groups are summarized in Table 2.
Figure 3.
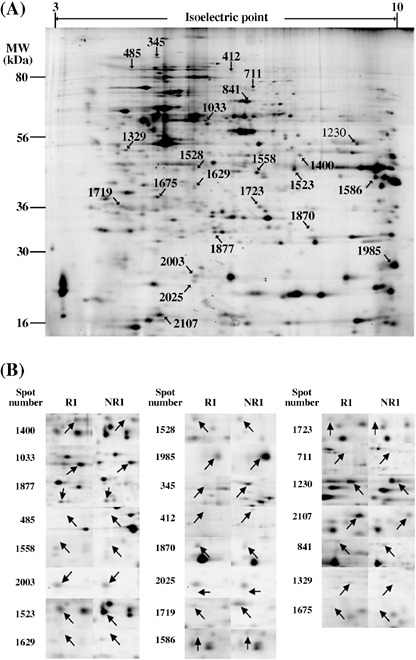
(A) Localization of the 23 selected spots on the 2D image. (B) The enlarged images are shown to compare the typical image of a sample from the early recurrence cases (R1) and one from the non‐recurrence cases (NR1).
Figure 4.
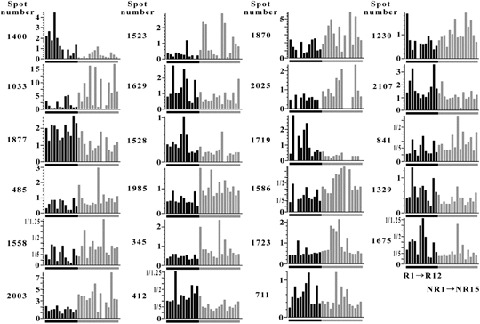
Quantitative differential display of the 23 selected spots. The standardized spot intensities of all hepatocellular carcinoma (HCC) samples in the training set are displayed. Assignment of patients corresponds to Figure 2.
Table 2.
List of the identified 23 proteins
| Ranking† | Spot no. ‡ | Identification§ | Acct.no.¶ | Theoretic†† | Observed‡‡ | Fold diff§§ | MS score††† | Coverage | MS/MS score¶¶ (%)‡‡‡ | Function | Known connection to HCC | References | ||
|---|---|---|---|---|---|---|---|---|---|---|---|---|---|---|
| Mr | pI | Mr | pI | R /NR | ||||||||||
| 1 | 1400 | Phosphoserine aminotransferase | Q9Y617 | 40.4 | 7.7 | 38.4 | 7.9 | 3.8 | 642 | 37.6 | 41 | Serine biosynthesis | – | – |
| 2 | 1033 | IFP53/Tryptophanyl‐Trna synthetase | P23381 | 53.2 | 5.8 | 48.8 | 5.8 | 0.27 | 212 | 13.4 | 66 | DNA/RNA synthesis | – | – |
| 3 | 1877 | Peroxiredoxin 3 | P30048 | 27.7 | 7.7 | 25.7 | 5.9 | 1.82 | 171 | 21.9 | 51 | Antioxidant | yes | 40 |
| 4 | 485 | GRP94 (Tumor rejection antigen 1) | P14625 | 92.5 | 4.8 | 93.5 | 4.9 | 0.59 | 1574 | 35.1 | – | Chaperone | yes | 41 |
| 5 | 1558 | Annexin A1 (Phospholipase A2 inhibitory protein) | P04083 | 38.6 | 6.6 | 34.1 | 6.8 | 0.55 | 382 | 14.7 | – | Signal transduction | yes | 42 |
| 6 | 2003 | Superoxide dismutase [Cu‐Zn] | P00441 | 15.8 | 5.7 | 21.4 | 5.8 | 0.44 | 306 | 22.7 | 31 | Antioxidant | yes | 45 |
| 7 | 1523 | Annexin A2 | P07355 | 38.5 | 7.6 | 34.7 | 7.7 | 0.42 | 548 | 18.9 | – | Signal transduction | – | – |
| 8 | 1629 | Annexin A4 | P09525 | 35.8 | 5.9 | 31.8 | 5.8 | 1.6 | 647 | 25.7 | – | Signal transduction | – | – |
| 9 | 1528 | L‐lactate dehydrogenase B chain | P07195 | 36.5 | 5.7 | 34.4 | 5.8 | 1.61 | 427 | 10.8 | – | Glucose metabolism | yes | 44 |
| 10 | 1985 | Cyclophilin B (Peptidyl‐prolyl cis‐trans isomerase B) | P23284 | 22.7 | 9.3 | 22.3 | 10 | 0.53 | 726 | 43.8 | – | Signal ransduction | yes | 47 |
| 11 | 345 | ORP150 | Q9Y4L1 | 111.3 | 5.2 | 115 | 5.2 | 0.59 | 671 | 23.9 | – | Chaperone | – | – |
| 12 | 412 | Vinculin | P12003 | 124.4 | 5.4 | 99.8 | 5.9 | 1.82 | 597 | 49.2 | – | Cytoskeletal structure | yes | 13, 14 |
| 13 | 1870 | Flavin reductase | P30043 | 21.9 | 7.3 | 25.8 | 8.1 | 0.52 | 106 | 14.1 | 48 | Antioxidant | – | – |
| 14 | 2025 | Stathmin | P16949 | 17.2 | 5.8 | 20.9 | 5.8 | 0.56 | 269 | 34.9 | 79 | Signal transduction | yes | – |
| 15 | 1719 | Protein kinase C inhibitor protein‐1 (14‐3‐3 zeta/delta) | P63104 | 27.8 | 4.7 | 29.2 | 4.6 | 2.7 | 1306 | 57.1 | – | Signal transduction | – | – |
| 16 | 1586 | Heterogeneous nuclear ribonucleoprotein A2/B1 | P22626 | 37.4 | 9 | 33.4 | 9.5 | 0.55 | 597 | 20.1 | – | Pre‐mRNA processing | – | – |
| 17 | 1723 | 26S proteasome non‐ATPase regulatory subunit 8 | P48556 | 30 | 6.9 | 29.1 | 6.9 | 0.64 | 104 | 8.9 | 38 | Protein degradation | – | – |
| 18 | 711 | Glutamine amidotransferase | P49915 | 76.7 | 6.4 | 74.6 | 6.7 | 1.31 | 945 | 51.2 | 53 | DNA and RNA synthesis | – | – |
| 19 | 1230 | Phosphoglycerate kinase 1 | P00558 | 44.6 | 8.3 | 40.6 | 9.1 | 0.69 | 234 | 34.9 | – | Glucose metabolism | – | – |
| 20 | 2107 | TCP‐1 chaperonin cofactor A | O75347 | 12.7 | 5.3 | 18.1 | 5.3 | 1.57 | 72 | 26.9 | 44 | Chaperonine | yes | 47 |
| 21 | 841 | TCP‐1‐gamma | P49368 | 60.4 | 6.1 | 65.9 | 6.6 | 0.64 | 783 | 27.8 | – | Chaperonine | yes | 48 |
| 22 | 1329 | Multidrug resistance‐associ ated protein MGr1‐Ag | P08865 | 32.9 | 4.8 | 39 | 4.7 | 1.51 | 405 | 15.3 | 74 | Cell adhesion | yes | 49 |
| 23 | 1675 | Nuclear chloride ion channel 27 | O00299 | 26.9 | 5.1 | 30.5 | 5.2 | 1.64 | 1041 | 44 | – | Ion channel | yes | 38 |
Ranking orders are determined by support vector machine weight.
§Identifications are according to Swiss‐Prot and NCBI database.
¶Accetion numbers are derived from Swiss‐Prot database.
Theoretical molecular weight (Mr) and isoelectric point (pI) are determined by Swiss‐Prot and the ExPASy databas (http://au.expasy.org).
‡‡Theoretical molecular weight (Mr) and isoelectric point (pI) are determined by the location of the spots on the 2D image.
§§Fold differences indicate the ratio between the mean intensity of the recurrence and non‐recurrence sample groups.
¶¶MS scores are calculated by MasCot program.
†††Coverages indicate the percentage of the length of the identified peptide against the full length protein.
MS/MS scores are calculated by MasCot program. The blank (–) indicate that MS/MS analysis was not successfully achieved.
The mass spectrum of tryptic peptides in spot 1400 is shown in Figure 5A as an example of mass spectrometric protein identification. Eleven peptides were matched to those of phosphoserine aminotransferase with an Analyst QS score of 945. One ion peak (m/z 1184.6646) was further processed for tandem mass spectrometry analysis, resulting in identification of the same protein (Fig. 5B–D). The peptide sequence used for the identification is shown in Figure 5(E). The other identified proteins are summarized in Table 2.
Figure 5.
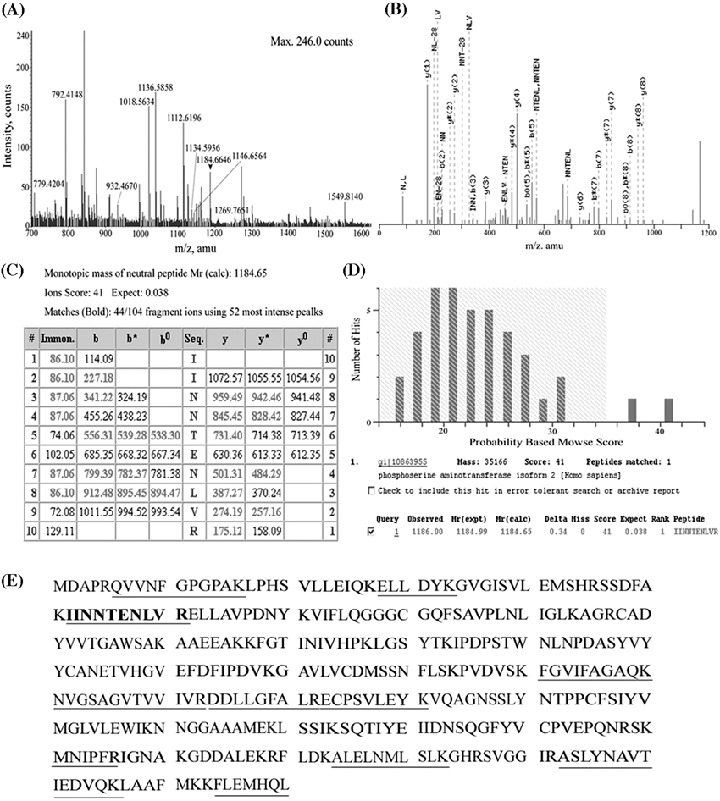
Mass spectrometric protein identification. (A) Mass spectrogram of spot 1400. Peptide ions with m/z‐values were used for protein identification. The ion peak shown with an arrow was subjected to MS/MS study. (B) MS/MS spectrogram of the peptide with m/z 1184.65. (C, D) Database search by the Mascot program using the MS/MS data. (E) Sequence of phosphoserine aminotransferase. The sequences used for the protein identification are underlined.
Discussion
We identified a set of 23 proteins whose expression pattern is significantly associated with early intrahepatic recurrence of hepatocellular carcinoma. Based on the expression profile of this set and using hierarchical clustering and principal component analysis, the HCC tumor samples were accurately classified into two groups according to their recurrence status, while they were ambiguously classified when all protein spots were used as the basis for their classification. As the prediction value of these proteins was validated by external validation samples, these proteins may be good candidates for tumor markers to predict early recurrence of HCC. The identification of patients at high risk for recurrence would be useful for further developing therapeutic strategies to possibly include prophylactic liver transplantation, an idea that would require the study of a larger number of HCC samples to be confirmed.
The proteins we identified in this study are involved in a wide range of biological processes, suggesting that various factors determine the malignant behavior of HCC cells. Phosphoserine aminotransferase is involved in the L‐serine biosynthesis pathway( 32 ) and enzymic imbalance of serine metabolism in rat hepatoma has been reported previously.( 33 ) As phosphoserine aminotransferase is highly expressed in tissues with a high rate of cell turnover( 34 ) its up‐regulation in HCC tissue in cases showing early recurrence may reflect the proliferation potential of the tumor cells. We also identified proteins involved in DNA/RNA synthesis, such as IFP53 and glutamine amidotransferase, premRNA processing, such as hnRNP A2/B1, chaperones such as GRP94, ORP150 and peptidyl‐prolyl cis‐trans isomerase B, chaperonins, such as TCP‐1‐chaperonin cofactor A and TCP‐1 gamma, and proteins in the proteolytic pathway, such as the 26S proteasome subunit. As these proteins play a key role in fundamental biological processes, from protein synthesis to degradation, they may be responsible for the overall proteomic differences observed between cases with and without recurrence (Fig. 2A). We identified three antioxidant proteins, namely peroxiredocin 3, superoxide dismutase and flavin reductase. Oxidative stress has been considered as a modulator of cancer‐relevant signaling pathways leading to the accumulation of oncogenic mutations in HCC.( 35 ) Our findings may either reflect the defensive response to the oxidative stress or the fact that tumor cells were clonally selected by the oxidative stress. Indeed, the proteins involved in the signal transduction pathways of the annexin families (annexin A1, 2, and 4) and protein kinase C (14‐3‐3 zeta/delta), and stathmin, a proliferation regulator, showed different expression levels between the early recurrence and non‐recurrence groups. Stathmin depolymerizes microtubules and plays a key role in signal transduction and cellular proliferation. Stathmin has been implicated in carcinogenesis and cancer progression in many types of malignant tumors, and was recently linked with carcinogenesis in HCC.( 36 ) Two enzymes involved in glucose metabolism, phosphoglycerate kinase 1 and L‐lactate dehydrogenase, were associated with early recurrence. Tumor formation is generally linked with increased activity of glycolytic enzymes, and a previous proteomic study on liver cancer reported the aberrant regulation of several glycolytic enzymes.( 27 ) In lung cancer patients, a proteomic study revealed that higher expression of PGK1 was also associated with reduced survival( 37 ) suggesting the importance of aberrant glycolysis in cancer progression. Nuclear chloride ion channel 27 was increased during the course of carcinogenesis in HCC( 38 ) and was also up‐regulated in the early recurrence group in our study. We observed up‐regulation of the resistance‐associated protein MGr1‐Ag in the early recurrence group. Recently, MGr1‐Ag turned out to be a ligand for PCK3145, an antimetastatic synthetic peptide for hormone‐refractory prostate cancer( 39 ) possibly presenting a novel molecular therapy target against early recurrence HCC. The early recurrence and non‐recurrence groups in the training set had the different number of primary tumor, venous invasion and TNM staging in the training set (Table 1). Therefore, these proteins might be involved in the mechanisms of these clinical features in a certain coordinated manner. However, as these clinical parameters were not significantly different between the two groups in the test set and these 23 proteins could distinguish them, the developed classifier may have more prediction value than these clinical parameters.
We may need an extensive validation study using a large‐scale sample set from the multiple hospitals to apply the present results for clinical applications because various clinical backgrounds should influence the prediction performance of the biomarkers. 2D‐DIGE is a powerful tool to discover the biomarker candidate, because it can provide quantitative protein expression data in a reproducible way across multiple samples in a relatively short time. However, it may be difficult to use 2D‐DIGE as a routine clinical examination tool in local hospitals because of its technical complexity and expensive initial and running costs. A more popular, convenient and less expensive examination tool, such as ELISA should be considered for screening purposes. Array technology has already enabled us to monitor the expression level of multiple proteins across a large number of samples in a less labor‐intense, high‐throughput and less expensive way, and the development of the specific antibody against the identified protein variants should be the key step to applying the proteomics results in the clinical setting.
Literature validation showed that many of the identified proteins were associated with HCC (Table 2).( 38 , 40 , 41 , 42 , 43 , 44 , 45 , 46 , 47 , 48 , 49 ) However, with the exception of vinculin( 14 , 15 ) the genes reported to be associated with early recurrence of HCC in transcriptomic studies were not identified in this study, a fact possibly due to the current detection limitations of 2D‐DIGE using the CyDye DIGE Fluor minimal dye. To improve the sensitivity of our proteomic studies, we are now considering the use of prefractionation methods, narrow range IPG gels, more sensitive fluorescent dye such as the CyDye DIGE Fluor saturation dye, and larger format 2D gels.( 50 ) We found that the large format 2D gel with CyDye DIGE Fluor saturation dye could increase the number of spots up to 5000.( 51 ) The extended version of 2D‐DIGE linking to the modern mass spectrometry should be considered as a key modality of cancer proteomics. In addition, the combination of multiple proteomic modalities such as the above, mass spectrometry and array technology will act in a complementary way and result in a comprehensive view of liver cancer proteomics.
Acknowledgments
This work was supported by a grant from the Ministry of Health, Labor and Welfare and by the Program for Promotion of Fundamental Studies in Health Sciences of the National Institute of Biomedical Innovation of Japan.
References
- 1. Nagao T, Inoue S, Yoshimi F et al. Postoperative recurrence of hepatocellular carcinoma. Ann Surg 1990; 211: 28–33. [DOI] [PMC free article] [PubMed] [Google Scholar]
- 2. Jwo SC, Chiu JH, Chau GY, Loong CC, Lui WY. Risk factors linked to tumor recurrence of human hepatocellular carcinoma after hepatic resection. Hepatology 1992; 16: 1367–71. [DOI] [PubMed] [Google Scholar]
- 3. Harada T, Shigemura T, Kodama S, Higuchi T, Ikeda S, Okazaki M. Hepatic resection is not enough for hepatocellular carcinoma. A follow‐up study of 92 patients. J Clin Gastroenterol 1992; 14: 245–50. [DOI] [PubMed] [Google Scholar]
- 4. Nagasue N, Uchida M, Makino Y et al. Incidence and factors associated with intrahepatic recurrence following resection of hepatocellular carcinoma. Gastroenterology 1993; 105: 488–94. [DOI] [PubMed] [Google Scholar]
- 5. Yamamoto J, Kosuge T, Takayama T et al. Recurrence of hepatocellular carcinoma after surgery. Br J Surg 1996; 83: 1219–22. [PubMed] [Google Scholar]
- 6. Cha C, Fong Y, Jarnagin WR, Blumgart LH, DeMatteo RP. Predictors and patterns of recurrence after resection of hepatocellular carcinoma. J Am Coll Surg 2003; 197: 753–8. [DOI] [PubMed] [Google Scholar]
- 7. Belghiti J, Panis Y, Farges O, Benhamou JP, Fekete F. Intrahepatic recurrence after resection of hepatocellular carcinoma complicating cirrhosis. Ann Surg 1991; 214: 114–7. [DOI] [PMC free article] [PubMed] [Google Scholar]
- 8. Kitamoto M, Nakanishi T, Kira S et al. The assessment of proliferating cell nuclear antigen immunohistochemical staining in small hepatocellular carcinoma and its relationship to histologic characteristics and prognosis. Cancer 1993; 72: 1859–65. [DOI] [PubMed] [Google Scholar]
- 9. Osada T, Sakamoto M, Ino Y et al. E‐cadherin is involved in the intrahepatic metastasis of hepatocellular carcinoma. Hepatology 1996; 24: 1460–7. [DOI] [PubMed] [Google Scholar]
- 10. Okada S, Shimada K, Yamamoto J et al. Predictive factors for postoperative recurrence of hepatocellular carcinoma. Gastroenterology 1994; 106: 1618–24. [DOI] [PubMed] [Google Scholar]
- 11. Tsuda H, Zhang WD, Shimosato Y et al. Allele loss on chromosome 16 associated with progression of human hepatocellular carcinoma. Proc Natl Acad Sci USA 1990; 87: 6791–4. [DOI] [PMC free article] [PubMed] [Google Scholar]
- 12. Nakanishi K, Sakamoto M, Yamasaki S, Todo S, Hirohashi S. Akt phosphorylation is a risk factor for early disease recurrence and poor prognosis in hepatocellular carcinoma. Cancer 2005; 103: 307–12. [DOI] [PubMed] [Google Scholar]
- 13. Peng SY, Chen WJ, Lai PL, Jeng YM, Sheu JC, Hsu HC. High alpha‐fetoprotein level correlates with high stage, early recurrence and poor prognosis of hepatocellular carcinoma. significance of hepatitis virus infection, age, p53 and beta‐catenin mutations. Int J Cancer 2004; 112: 44–50. [DOI] [PubMed] [Google Scholar]
- 14. Ye QH, Qin LX, Forgues M et al. Predicting hepatitis B virus‐positive metastatic hepatocellular carcinomas using gene expression profiling and supervised machine learning. Nat Med 2003; 9: 416–23. [DOI] [PubMed] [Google Scholar]
- 15. Iizuka N, Oka M, Yamada‐Okabe H et al. Oligonucleotide microarray for prediction of early intrahepatic recurrence of hepatocellular carcinoma after curative resection. Lancet 2003; 361: 923–9. [DOI] [PubMed] [Google Scholar]
- 16. Yuan RH, Jeng YM, Chen HL et al. Stathmin overexpression cooperates with p53 mutation and osteopontin overexpression, and is associated with tumour progression, early recurrence, and poor prognosis in hepatocellular carcinoma. J Pathol 2006; 209: 549–58. [DOI] [PubMed] [Google Scholar]
- 17. Budhu A, Forgues M, Et Al YeQH. Prediction of venous metastases, recurrence, and prognosis in hepatocellular carcinoma based on a unique immune response signature of the liver microenvironment. Cancer Cell 2006; 10: 99–111. [DOI] [PubMed] [Google Scholar]
- 18. Griffin TJ, Gygi SP, Ideker T et al. Complementary profiling of gene expression at the transcriptome and proteome levels in Saccharomyces cerevisiae. Mol Cell Proteomics 2002; 1: 323–33. [DOI] [PubMed] [Google Scholar]
- 19. Chen G, Gharib TG, Huang CC et al. Discordant protein and mRNA expression in lung adenocarcinomas. Mol Cell Proteomics 2002; 1: 304–13. [DOI] [PubMed] [Google Scholar]
- 20. Gygi SP, Rochon Y, Franza BR, Aebersold R. Correlation between protein and mRNA abundance in yeast. Mol Cell Biol 1999; 19: 1720–30. [DOI] [PMC free article] [PubMed] [Google Scholar]
- 21. Ding SJ, Li Y, Tan YX et al. From proteomic analysis to clinical significance: overexpression of cytokeratin 19 correlates with hepatocellular carcinoma metastasis. Mol Cell Proteomics 2004; 3: 73–81. [DOI] [PubMed] [Google Scholar]
- 22. Yokoo H, Kondo T, Fujii K, Yamada T, Todo S, Hirohashi S. Proteomic signature corresponding to alpha fetoprotein expression in liver cancer cells. Hepatology 2004; 40: 609–17. [DOI] [PubMed] [Google Scholar]
- 23. Fujii K, Kondo T, Yokoo H, Yamada T, Iwatsuki K, Hirohashi S. Proteomic study of human hepatocellular carcinoma using two‐dimensional difference gel electrophoresis with saturation cysteine dye. Proteomics 2005; 5: 1411–22. [DOI] [PubMed] [Google Scholar]
- 24. Fujii K, Kondo T, Yokoo H et al. Database of two‐dimensional polyacrylamide gel electrophoresis of proteins labeled with CyDye DIGE Fluor saturation dye. Proteomics 2006; 6: 1640–53. [DOI] [PubMed] [Google Scholar]
- 25. Chignard N, Shang S, Wang H et al. Cleavage of endoplasmic reticulum proteins in hepatocellular carcinoma: detection of generated fragments in patient sera. Gastroenterology 2006; 130: 2010–22. [DOI] [PubMed] [Google Scholar]
- 26. Kuramitsu Y, Harada T, Takashima M et al. Increased expression and phosphorylation of liver glutamine synthetase in well‐differentiated hepatocellular carcinoma tissues from patients infected with hepatitis C virus. Electrophoresis 2006; 27: 2998. [DOI] [PubMed] [Google Scholar]
- 27. Shen H, Cheng G, Fan H et al. Expressed proteome analysis of human hepatocellular carcinoma in nude mice (LCI‐D20) with high metastasis potential. Proteomics 2006; 6: 528–37. [DOI] [PubMed] [Google Scholar]
- 28. Song HY, Liu YK, Feng JT et al. Proteomic analysis on metastasis‐associated proteins of human hepatocellular carcinoma tissues. J Cancer Res Clin Oncol 2006; 132: 92–8. [DOI] [PubMed] [Google Scholar]
- 29. Ramaswamy S, Tamayo P, Rifkin R et al. Multiclass cancer diagnosis using tumor gene expression signatures. Proc Natl Acad Sci USA 2001; 98: 15 149–54. [DOI] [PMC free article] [PubMed] [Google Scholar]
- 30. Toyosaka A, Okamoto E, Mitsunobu M, Oriyama T, Nakao N, Miura K. Intrahepatic metastases in hepatocellular carcinoma: evidence for spread via the portal vein as an efferent vessel. Am J Gastroenterol 1996; 91: 1610–15. [PubMed] [Google Scholar]
- 31. Regimbeau JM, Abdalla EK, Vauthey JN et al. Risk factors for early death due to recurrence after liver resection for hepatocellular carcinoma: results of a multicenter study. J Surg Oncol 2004; 85: 36–41. [DOI] [PubMed] [Google Scholar]
- 32. Snell K. Fell DA. Metabolic control analysis of mammalian serine metabolism. Adv Enzyme Regul 1990; 30: 13–32. [DOI] [PubMed] [Google Scholar]
- 33. Snell K, Weber G. Enzymic imbalance in serine metabolism in rat hepatomas. Biochem J 1986; 233: 617–20. [DOI] [PMC free article] [PubMed] [Google Scholar]
- 34. Snell K. Enzymes of serine metabolism in normal, developing and neoplastic rat tissues. Adv Enzyme Regul 1984; 22: 325–400. [DOI] [PubMed] [Google Scholar]
- 35. Farazi PA, DePinho RA. Hepatocellular carcinoma pathogenesis: from genes to environment. Nat Rev Cancer 2006; 6: 674–87. [DOI] [PubMed] [Google Scholar]
- 36. Misek DE, Chang CL, Kuick R et al. Transforming properties of a Q18–>E mutation of the microtubule regulator Op18. Cancer Cell 2002; 2: 217–28. [DOI] [PubMed] [Google Scholar]
- 37. Chen G, Gharib TG, Wang H et al. Protein profiles associated with survival in lung adenocarcinoma. Proc Natl Acad Sci USA 2003; 100: 13 537–42. [DOI] [PMC free article] [PubMed] [Google Scholar]
- 38. Blanc JF, Lalanne C, Plomion C et al. Proteomic analysis of differentially expressed proteins in hepatocellular carcinoma developed in patients with chronic viral hepatitis C. Proteomics 2005; 5: 3778–89. [DOI] [PubMed] [Google Scholar]
- 39. Annabi B, Currie JC, Bouzeghrane M et al. Contribution of the 37‐kDa laminin receptor precursor in the anti‐metastatic PSP94‐derived peptide PCK3145 cell surface binding. Biochem Biophys Res Commun 2006; 346: 358–66. [DOI] [PubMed] [Google Scholar]
- 40. Choi JH, Kim TN, Kim S et al. Overexpression of mitochondrial thioredoxin reductase and peroxiredoxin III in hepatocellular carcinomas. Anticancer Res 2002; 22: 3331–5. [PubMed] [Google Scholar]
- 41. Zhu XD, Li CL, Lang ZW, Gao GF, Tien P. Significant correlation between expression level of HSP gp96 and progression of hepatitis B virus induced diseases. World J Gastroenterol 2004; 10: 1141–5. [DOI] [PMC free article] [PubMed] [Google Scholar]
- 42. Masaki T, Tokuda M, Ohnishi M et al. Enhanced expression of the protein kinase substrate annexin in human hepatocellular carcinoma. Hepatology 1996; 24: 72–81. [DOI] [PubMed] [Google Scholar]
- 43. Huang C, Wu M. Superoxide dismutase activity in tissues from 19 cases of hepatocellular carcinoma. Zhonghua Yi Xue Za Zhi 1990; 70: 138–9, 12. [PubMed] [Google Scholar]
- 44. Stenner‐Liewen F, Luo G, Sahin U et al. Definition of tumor‐associated antigens in hepatocellular carcinoma. Cancer Epidemiol Biomarkers Prev 2000; 9: 285–90. [PubMed] [Google Scholar]
- 45. Lim SO, Park SJ, Kim W et al. Proteome analysis of hepatocellular carcinoma. Biochem Biophys Res Commun 2002; 291: 1031–7. [DOI] [PubMed] [Google Scholar]
- 46. Li C, Tan YX, Zhou H et al. Proteomic analysis of hepatitis B virus‐associated hepatocellular carcinoma: Identification of potential tumor markers. Proteomics 2005; 5: 1125–39. [DOI] [PubMed] [Google Scholar]
- 47. Pang R, Yuen J, Yuen MF et al. PIN1 overexpression and beta‐catenin gene mutations are distinct oncogenic events in human hepatocellular carcinoma. Oncogene 2004; 23: 4182–6. [DOI] [PubMed] [Google Scholar]
- 48. Yokota S, Yamamoto Y, Shimizu K et al. Increased expression of cytosolic chaperonin CCT in human hepatocellular and colonic carcinoma. Cell Stress Chaperones 2001; 6: 345–50. [DOI] [PMC free article] [PubMed] [Google Scholar]
- 49. Zheng S, Ruan Y, Wu Z, Tang J. The relationship between; 67KD: laminin receptor expression and metastasis of hepatocellular carcinoma. J Tongji Med University 1997; 17: 200–2, 24. [DOI] [PubMed] [Google Scholar]
- 50. Gorg A, Weiss W, Dunn MJ. Current two‐dimensional electrophoresis technology for proteomics. Proteomics 2004; 4: 3665–85. [DOI] [PubMed] [Google Scholar]
- 51. Kondo T, Hirohashi S. Application of highly sensitive fluorescent dyes (CyDye DIGE Fluor saturation dyes) to laser microdissection and two‐dimensional difference gel electrophoresis (2D‐DIGE) for cancer proteomics. Nat Protoc 2007; 1: 2940–56. [DOI] [PubMed] [Google Scholar]