

Abstract
Liver metastasis is a major cause of poor survival of colorectal cancer patients. In order to identify the proteins associated with liver metastasis in colorectal cancer, we carried out two‐dimensional gel electrophoresis‐based comparative proteomic analysis of normal colon mucosa, primary colon cancer tissue and corresponding metastatic tumor tissue in liver. The proteins identified were further validated by immunohistochemical analysis of 67 quadruplet samples of normal colon primary colorectal cancer and normal liver‐synchronous liver metastasis, and 251 colorectal cancers as well as in vitro invasion assay of the human colon cancer cell line, SNU‐81. From proteomic assessment, the mitochondrial FoF1‐ATP synthase (ATP synthase) α‐subunit was identified as a protein that is upregulated in liver metastasis compared with the primary tumor. Immunohistochemical analyses confirmed a significant increase in the expression of ATP synthase α‐ and d‐subunits in synchronous liver metastasis compared with primary tumor and normal mucosa, respectively. ATP synthase α‐ and d‐subunits were overexpressed in 197 (78.5%) and 190 (75.7%), respectively, of the 251 colorectal cancers. The α‐ and d‐subunits were significantly associated with liver metastasis (P < 0.05) as well as low histological grade (P < 0.0001). The d‐subunit also correlated with venous invasion (P = 0.026) and distant metastasis (P = 0.032). In stage III cancers, d‐subunit expression was independently associated with poor survival (P = 0.017). Furthermore, transfection of small interfering RNA targeted to ATP synthase α‐ and d‐subunits resulted in decreased in vitro invasiveness of the human colon cancer cell line. Our overall findings demonstrate that increased ATP synthase is associated with liver metastasis of colorectal cancer. (Cancer Sci 2007; 98: 1184–1191)
With the recent advances in therapeutic modalities for colorectal cancer, the death rate due to this disease is decreasing in the USA.( 1 ) However, the 5‐year survival rate for stage IV colorectal cancer is still dismal compared with that of stage IIIc cancer (8.1 vs 44.3%, respectively).( 2 ) The most common site for metastasis of colorectal cancer is the liver. Synchronous liver metastases are observed in 10–25% of patients at the time of operation for primary colorectal cancer,( 3 ) but only 25% of these patients are candidates for resection.( 4 ) Metachronous involvement of the liver is observed in 40–70% of patients with progressive colorectal cancer.( 3 ) Moreover, the liver is the sole site of initial tumor recurrence in up to 30% of patients.( 3 ) Therefore, liver metastasis is not only a fundamental obstacle in the treatment of colorectal cancer, but also a major cause of mortality.
Metastasis occurs through a multistep cascade, including migration from the primary tumor, invasion to blood vessels or lymphatics, survival in the blood or lymphatic stream, invasion of distant tissues, and the establishment of metastatic nodules.( 5 ) Although several molecular markers for proteases (e.g. matrix metalloproteinase),( 6 ) angiogenesis (e.g. vascular endothelial growth factor [VEGF]),( 7 ) adhesion molecules (e.g. E‐cadherin, CD44)( 8 ) and antimetastatic molecules (e.g. nm23)( 9 ) are possibly related to metastasis, many different genes and multiple interactions of aberrantly expressed genes participate in tumor progression and metastasis. Further studies are necessary to fully clarify their roles in the mechanism of liver metastasis. cDNA microarrays have been applied to analyze the levels of groups of genes and determine the patterns of gene expression in different diseases, including colorectal cancer.( 10 , 11 ) Despite the power of genomic technology, this method has limitations. In particular, the mRNA level frequently does not represent the amount of active protein in a cell, the gene sequence does not describe post‐translational modifications essential for protein function and activity, and the study of genomes does not provide information on dynamic cellular processes.( 12 ) Global analysis of cellular proteins, termed proteomics, is currently a key area of research in the postgenome era,( 13 ) and has been actively applied to cancer research.( 14 , 15 , 16 , 17 , 18 )
We recently carried out two‐dimensional gel electrophoresis‐based comparative proteomics of normal colon mucosa, primary colon cancer tissue and corresponding metastatic tumor tissue in liver to identify the proteins associated with liver metastasis in colorectal cancer. From this proteome assessment, the mitochondrial FoF1‐ATP synthase (ATP synthase) α‐subunit was identified as a protein upregulated in tumor metastasized to liver. In the present report, we analyzed the relationship between ATP synthase and liver metastasis of primary colorectal cancer.
Materials and Methods
Human colorectal cancer tissues and cell lines. Fresh tissue samples (normal colon mucosa, colon cancer, normal liver and metastatic cancer in liver) were obtained from tumor and non‐neoplastic tissue of one sigmoid cancer case with synchronous liver metastasis for comparative proteomics. Necrotic exudate or stromal component was dissected, and the overall cellularity of normal epithelium or tumor was more than 75%. The patient, a 55‐year‐old woman, underwent anterior resection of sigmoid colon cancer with S5, S6 and S7 segmentectomy of synchronous liver metastasis. The primary cancer was moderately differentiated adenocarcinoma, 5.4 cm in diameter, and penetrated the visceral peritoneum (pT4) accompanied by regional lymph node metastasis in 14 out of 28 lymph nodes (pN2). Liver metastasis was observed at two sites, S6‐S7 and S5, and the metastatic tumor sizes were 1.4 × 1.2 and 0.7 × 0.6 cm, respectively. Although the proteomic analysis was carried out only in one case, we further investigated expression of the identified protein in a large number of clinical samples and carried out an in vitro validation experiment.
Immunohistochemical validation was carried out in two ways. Initially, protein expression was compared among normal colorectal mucosa, primary colorectal cancers, normal liver and synchronous liver metastatic tumors obtained from 67 colorectal cancer patients with synchronous liver metastasis surgically resected at the National Cancer Center, Korea (2001–2005). Second, correlations between protein expression and clinicopathological parameters were evaluated in 251 colorectal cancer cases, surgically resected, and collected at the National Cancer Center, Korea, in 2003. A review of clinical charts and pathological reports was used to obtain demographic data. The patients comprised 101 women and 150 men with a mean age of 58 years (range 25–86 years). The clinical outcomes of cancer patients were followed up from the date of operation until death or 31 October 2006. The mean follow‐up time was 32 months. Liver metastasis was identified in 57 patients. Forty‐one cases were synchronous metastasis, whereas 16 were metachronous metastasis with a mean metastasis duration of 16 months (range 13–26 months). Nine out of 41 cases with synchronous liver metastasis overlapped with the first immunohistochemical validation method. All cases were classified histologically according to World Health Organization criteria,( 19 ) and staged in keeping with the criteria of the AJCC cancer‐staging manual.( 20 ) Our experiments were carried out in accordance with the Declaration of Helsinki. Informed consent was obtained from all patients. The research protocol was approved by the Institutional Review Board at the National Cancer Center, Korea (NCCNCS‐04‐041).
The human colon cancer cell line SNU‐81, obtained from the Korean Cell Line Bank (Seoul, Korea), was used in small interfering RNA (siRNA) transfection and in vitro invasion assays.
Two‐dimensional gel electrophoresis‐based comparative proteomics. Two‐dimensional gel electrophoresis (2‐DE) analysis was carried out as described previously.( 18 ) Proteins were extracted from tumors (primary colon cancer and liver metastasis) and non‐neoplastic (normal colon mucosa and normal liver) tissues of the colon cancer patient with synchronous liver metastasis. Proteins (150 µg) were applied to 13‐cm immobilized pH 3–10 non‐linear gradient strips (Amersham, Uppsala, Sweden) and focused at 8000 V within 3 h. For second‐dimension separation, we used 12% polyacrylamide gels (chemicals from Serva, Heidelberg, Germany and Bio‐Rad, Hercules, CA, USA). 2‐DE gels were stained with Colloidal Coomassie Blue (Invitrogen, Carlsbad, CA, USA) for 24 h, and destained with deionized water.
Melanie 4 software (Swiss Institute of Bioinformatics, Geneva, Switzerland) was used for image analysis of 2‐DE gels. Proteins displaying abnormal expression were subjected to matrix‐assisted laser desorption ionization–mass spectroscopy (MALDI‐MS) analysis for identification.
MALDI‐MS analysis of 2‐DE protein spots was carried out as described previously.( 18 ) Briefly, pieces of gel containing protein spots of interest were excised, destained with 50% acetonitrile in 0.1 M ammonium bicarbonate, and dried in a SpeedVac evaporator (Savant, Farmingdale, NY, USA). The dried gel pieces were reswollen with 3 µL of 3 mM Tris‐HCl, pH 8.8, containing 50 ng trypsin (Promega, Madison, WI, USA) and 3 µL water was added after 15 min. An aliquot of 1 µL was applied to the dried matrix spot. The matrix consisted of 15 mg nitrocellulose (Bio‐Rad) and 20 mg α‐cyano 4 hydroxycinnamic acid (Sigma, St Louis, MO, USA) dissolved in 1 mL acetone:isopropanol (1:1, v/v). Matrix solution (0.5 µL) was applied to the sample. Next, samples were analyzed using Ultraflex TOF‐TOF (Bruker Daltonics, Leipzig, Germany) at a 20‐kV accelerating voltage. Peptide masses were matched with the theoretical peptide masses of proteins from all species in the SWISS‐PROT database.
Immunohistochemistry. All human tissues were fixed routinely in 10% buffered formalin and embedded in paraffin blocks. Core tissue biopsies (2 mm in diameter) were obtained from individual paraffin‐embedded colorectal cancers (donor blocks) and arranged in a new recipient paraffin block (tissue microarray block) using a trephine apparatus (Superbiochips Laboratories, Seoul, Korea). Each of the resulting tissue array blocks contained up to 60 specimens. Sections 4‐µm thick were subjected to immunohistochemical analyses. Because a single sample from each tumor is sufficient for distinguishing protein expression or molecular alterations related to clinical outcome,( 21 ) we analyzed one tissue core from the most cellular and representative portion in each case.
Immunostaining was carried out using the labeled streptavidin–biotin complex method. After antigen retrieval, polyclonal rabbit anti‐F1Fo‐ATP synthase (ATP synthase) α‐ or d‐subunit antibody (dilution 1:400; Santa Cruz Biotechnology, Santa Cruz, CA, USA) was applied. Staining data were evaluated semiquantitatively using a double scoring system by estimating both staining intensity and the percentage of stained tumor cells. In normal colon, staining of normal crypt epithelium was evaluated. Perinuclear expression of protein corresponding to perinuclear localization of mitochondria was identified. As a negative control, the tissue sections were incubated with Tris‐buffered saline (TBS) alone with omission of the primary antibody. The staining intensity was subclassified as follows: 1, weak; 2, moderate; 3, strong. The percentages of stained tumor cells were assigned the following scores: 0, <10%; 1, 10–25%; 2, 26–50%; 3, >50%. Immunoreactivity was scored from 0 to 9 by multiplying the staining intensity by the staining percentage value. The immunoreactive score results were estimated by two pathologists. When 10% of the cases were reevaluated blindly, interobserver and intraobserver agreement was more than 90%. For statistical analysis, immunoreactive scores of ≥6 were defined as ‘overexpression’ because the mean immunoreactive scores for ATP synthase α‐ and d‐subunit in 67 normal colorectal epithelia were 5.49 and 4.55, respectively.
siRNA synthesis and transfection. The following target sequences were used to generate siRNA (Qiagen, Chatsworth, CA, USA): validated siRNA against ATP synthase α‐subunit (catalogue no. SI02776991), 5′‐TAATAATTATACAGTTAAA‐3′ (nucleotides 607–625 of GenBank accession no. NM_006356) for ATP synthase d‐subunit, and 5′‐AATTCTCCGAACGTGTCACGT‐3′ for non‐silencing control. Synthetic siRNA duplexes were transfected into SNU‐81 via electroporation. Briefly, subconfluent monolayers of SNU‐81 cells were detached from culture dishes with trypsin treatment, washed with PBS, and adjusted to a concentration of 10 × 106 cells per mL of OPTI‐MEM I culture medium (Invitrogen). Next, 0.3 mL of the cell suspension (3 × 10⁶ cells) was mixed with siRNA (final concentration 5 µM) by gentle pipetting, transferred to a 0.4‐cm‐wide electroporation cuvette (Bio‐Rad), and subjected to an electric pulse at 0.9 mF and 170 V using a Gene Pulser (Bio‐Rad).
In vitro invasion assay. SNU‐81 cells were transfected with siRNA specific for the ATP synthase d‐subunit, and cell invasiveness was determined. An in vitro invasion assay was carried out using a kit (Chemicon, Temecula, CA, USA), according to the manufacturer's instructions. Briefly, the assay was carried out in an invasion chamber consisting of a 24‐well tissue culture plate with 12‐cell culture inserts. A cell suspension of SNU‐81 in serum‐free RPMI‐1640 medium (Invitrogen) containing 2 mg/mL sodium bicarbonate, 100 U/mL penicillin and 0.1 mg/mL streptomycin was added to the inserts. Each insert was placed in the lower chamber containing RPMI‐1640 medium + 10% bovine calf serum. After 72 and 96 h incubation in a cell culture incubator, invasiveness was evaluated by staining cells that migrated through the extracellular matrix layer and adhered to the polycarbonate membrane at the bottom of the insert. Under 200× magnification, the number of cells adhering to six different districts on the bottom of the insert were counted.
Statistical analysis. The paired t‐test was used to compare the immunoreactive scores of ATP synthase α and d among normal colon mucosa, primary colorectal cancer and synchronous liver metastasis. The χ2‐test was used to evaluate the relationship between ATP synthase α‐ and d‐subunit expression, and each clinicopathological parameter. Multivariate logistic regression analyses were then carried out to confirm the effect of α‐ and d‐subunit expression on liver metastasis. Overall or disease‐free survival was estimated using the Kaplan–Meier method with the log‐rank test, and multivariate analysis using the Cox proportional hazards regression model was carried out to assess the prognostic values of protein expression. A P‐value of less than 0.05 was considered statistically significant. All statistical analyses were carried out using SPSS software (SPSS, Chicago, IL, USA).
Results
Identification of FoF1‐ATP synthase a‐subunit as a candidate protein linked to metastasis of colon cancer to liver. A protein with a molecular size of 70 kDa and pI 9.0 was expressed at a higher level in tumor metastasized to liver compared to the primary tumor in colon (Fig. 1a). The spot was excised from the 2‐DE gel, digested with trypsin and subjected to MALDI‐MS analysis to determine peptide mass. A SWISS‐PROT database search identified the protein as the FoF1‐ATP synthase (ATP synthase) α‐subunit (Fig. 1b).
Figure 1.
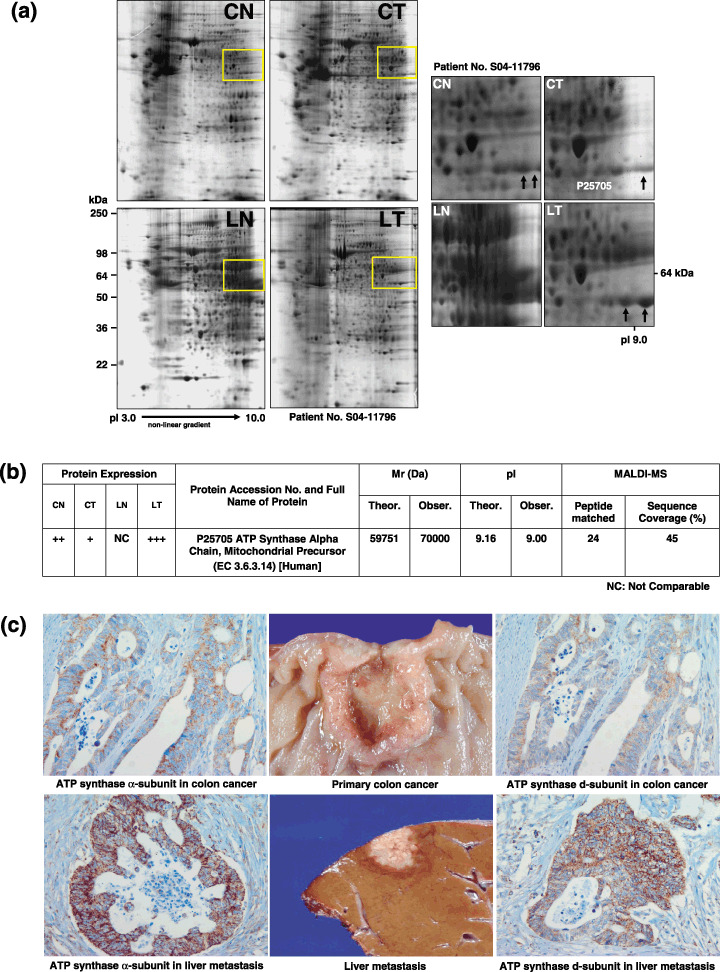
Identification of FoF1‐ATP synthase (ATP synthase) α‐subunit as a candidate protein linked to metastasis of colon cancer to liver. (a) Two‐dimensional gel electrophoresis of protein extracts from normal colon mucosa (CN), colon cancer (CT), normal liver (LN) and liver metastasis (LT). A protein spot with a molecular size of 70 kDa and pI 9.0 was expressed at a higher level in tumors metastasized to the liver compared to the primary tumor in colon. (b) Matrix‐assisted laser desorption ionization‐mass spectroscopy analysis. The protein was identified as ATP synthase α‐subunit (SWISS PROT No. P25750). Theoretical and approximate M r and pI values, as well as the number of matching and total peptides were calculated. (c) Immunohistochemical staining of colorectal cancer and corresponding liver metastasis tissues. ATP synthase α‐ and d‐subunits were strongly expressed in liver metastasis (immunoreactive score 9) compared to those in the corresponding primary colon cancer (immunoreactive score 6).
Corelationship between increased ATP synthase a‐ and d‐subunit expression and liver metastasis of primary colorectal cancer. Immunohistochemical staining of colorectal cancer and corresponding liver metastasis tissues revealed overexpression of ATP synthase α‐ and d‐subunits in metastasis compared to colorectal cancer (Fig. 1c). The mean immunoreactive scores for the ATP synthase α‐subunit in 67 normal colorectal mucosa, colorectal cancers, normal liver and corresponding liver metastases were 5.49 ± 2.04, 6.15 ± 2.73, 6.72 ± 2.55 and 7.26 ± 1.88, respectively. Notably, scores were significantly higher in liver metastases than normal colonic epithelium (P < 0.0001) or primary colorectal cancers (P = 0.001). For the ATP synthase d‐subunit, mean immunoreactive scores were 4.55 ± 2.11, 5.75 ± 2.58, 5.49 ± 2.34 and 6.09 ± 2.06, respectively, and markedly higher in colorectal cancers and liver metastases than normal colonic mucosa (P =0.002 and P < 0.0001, respectively). The scores of α‐ and d‐subunits were higher in normal hepatocytes than in normal colonic epithelial cells (P = 0.001 and P = 0.014, respectively).
ATP synthase α‐ and d‐subunits were highly expressed in 78.5% (197/251) and 75.7% (190/251) of colon cancers, respectively (Table 1). Overexpression of the ATP synthase α‐subunit in colon cancers correlated significantly with liver metastasis (P = 0.022), as well as low histological grade (P < 0.0001) (Table 1). Overexpression of ATP synthase d‐subunit was also associated with liver metastasis (P = 0.040), low histological grade (P < 0.0001), positive venous invasion (P = 0.026), and distant metastasis (P = 0.032) (Table 1). Multivariate logistic regression analysis showed that ATP synthase α‐subunit was significantly related to liver metastasis (odds ratio, 5.050; 95% confidence interval [CI] 1.136–22.440; P = 0.033) (Table 2).
Table 1.
Overexpression of ATP synthase α‐subunit (n = 197) and d‐subunit (n = 190) according to clinicopathological features in colorectal cancers
| Clinicopathological findings | n | ATP synthase α‐subunit | ATP synthase d‐subunit | ||
|---|---|---|---|---|---|
| Case no. | P‐value | Case no. | P‐value | ||
| Location | |||||
| Proximal | 74 | 58 | NS | 55 | NS |
| Distal | 177 | 139 | 135 | ||
| Histological grade | |||||
| Low | 221 | 181 | <0.0001 | 177 | <0.0001 |
| High | 30 | 16 | 13 | ||
| Lymphatic invasion | |||||
| Absent | 88 | 66 | NS | 65 | NS |
| Present | 163 | 131 | 125 | ||
| Venous invasion | |||||
| Absent | 155 | 118 | NS | 110 | 0.026 |
| Present | 96 | 79 | 80 | ||
| Depth of invasion | |||||
| pT1 + pT2 | 39 | 32 | NS | 27 | NS |
| pT3 + pT4 | 212 | 165 | 163 | ||
| Lymph node metastasis | |||||
| Absent | 106 | 83 | NS | 74 | 0.063 |
| Present | 145 | 114 | 116 | ||
| Distant metastasis | |||||
| Absent | 188 | 144 | NS | 136 | 0.032 |
| Present | 63 | 53 | 54 | ||
| Liver metastasis | |||||
| Absent | 194 | 146 | 0.022 | 141 | 0.040 |
| Present | 57 | 51 | 49 | ||
| Stage | |||||
| Stage I + II + III | 188 | 144 | NS | 136 | 0.032 |
| Stage IV | 63 | 53 | 54 | ||
| Recurrence † | |||||
| Absent | 166 | 127 | NS | 122 | NS |
| Present | 49 | 39 | 37 | ||
Recurrence in 215 cases underwent curative resection. NS, statistically not significant.
Table 2.
Multivariate logistic regression analysis of ATP synthase α‐subunit and d‐subunit expression for liver metastasis of colorectal cancer
| Parameter | P‐value | Odds ratio | 95% confidence interval |
|---|---|---|---|
| ATP synthase α‐subunit | 0.033 | 5.090 | 1.136–22.440 |
| ATP synthase d‐subunit | NS | ||
| Location | NS | ||
| Histological grade | NS | ||
| Lymphatic invasion | 0.001 | 34.404 | 4.264–277.557 |
| Venous invasion | <0.0001 | 22.558 | 8.045–63.253 |
| Depth of invasion | NS | ||
| Lymph node metastasis | NS |
NS, statistically not significant.
Association of ATP synthase d‐subunit overexpression with poor survival in stage III colorectal cancers. Kaplan–Meier survival analysis for ATP synthase α‐ or d‐subunit expression in entire cases showed no significant correlation between protein expression and disease‐free survival or between protein expression and overall survival of the patients. However, when a subgroup survival analysis according to each stage was carried out, ATP synthase d‐subunit expression was significantly associated with poor outcome in stage III cancers (Fig. 2). The 3‐year survival rate was 76% in stage III cancers with ATP synthase d‐subunit overexpression versus 95% in those without d‐subunit overexpression (P = 0.007). Multivariate survival analysis using a forward selection procedure of the Cox proportional hazard model for the clinicopathological parameters including sex, tumor location, gross type, histological grade, pT stage and venous or angiolymphatic invasion, and expression of ATP synthase α‐ or d‐subunits revealed that overexpression of d‐subunit expression only was independent of poor prognosis in patients of stage III (hazard ratio [HR], 0.177; 95% CI, 0.042–0.743; P = 0.017).
Figure 2.

Kaplan–Meier survival curves showing significantly worse overall survival for patients of stage III colorectal cancers with ATP synthase d‐subunit overexpression than those without d‐subunit overexpression (P = 0.007).
Decreased invasiveness of the human colon cancer cell line SNU‐81 induced by suppression of the ATP synthase a‐ and d‐subunits. Expression of the ATP synthase α‐ and d‐subunits was suppressed efficiently at 96 h after transfection with specific siRNA (Fig. 3a). At this time, ATP synthase α‐ and d‐subunit siRNA‐transfected cells displayed decreased invasiveness compared with those transfected with either non‐silencing control siRNA or PBS buffer (Fig. 3b,c).
Figure 3.
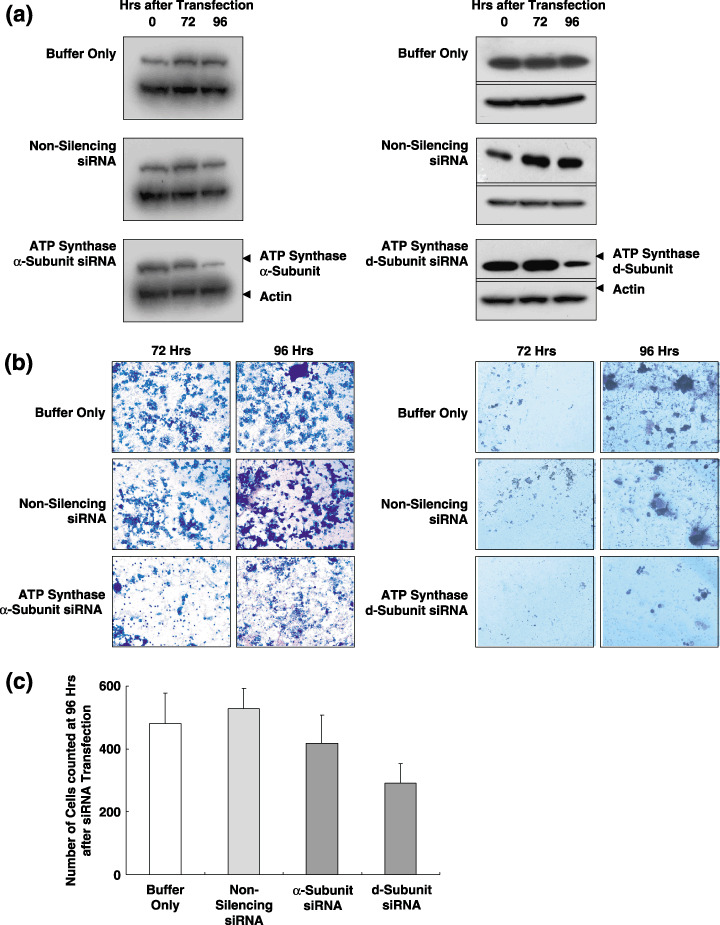
In vitro invasion assay of the human colon cancer cell line, SNU‐81 after suppression of the ATP synthase α‐ and d‐subunit. SNU‐81 cells were transfected with either small interfering RNA (siRNA) specific for ATP synthase α‐ and d‐subunit, non‐silencing control siRNA, or phosphate‐buffered saline (PBS) buffer only. (a) Expression of the ATP synthase α‐ and d‐subunits was efficiently suppressed at 96 h after transfection with ATP synthase d‐subunit siRNA. (b) At 9 h after transfection, ATP synthase α‐ and d‐subunit siRNA‐transfected cells showed decreased invasiveness compared with those transfected with either non‐silencing control siRNA or PBS.
Discussion
ATP synthase is a complex of 16 different subunits, with α3β3γδ and ∈ comprising the F1 component, and a, b, c, d, e, f, g, 8, oligomycin sensitivity‐conferring protein and coupling factor 6 comprising Fo and stator.( 22 , 23 ) Fo is a membranous domain, whereas F1 is a catalytic domain.( 22 , 23 ) In the presence of a proton gradient or membrane potential, the FoF1 complex synthesizes ATP (FoF1 ATP synthase) and is involved in oxidative phosphorylation.( 24 ) However, if no membrane potential or pH gradient exists, the F1 domain is isolated from Fo and participates in the hydrolysis of ATP (F1 ATPase).( 24 )
As the α‐subunit is one of the major components of the F1 complex of ATP synthase–ATPase, we examined whether its overexpression represents increased expression of all other subunits for augmenting ATP synthase function. We additionally evaluated the level of the d‐subunit, a major component of the Fo complex, in metastatic liver tumors. Interestingly, expression of the d‐subunit was similar to that of the α‐subunit (Fig. 1c, Table 1). Both subunits correlated significantly with histological grade (both P < 0.0001) and liver metastasis (both P < 0.05) (Table 1). Overexpression of the d‐subunit was also significantly correlated with venous invasion (P = 0.026), distant metastasis (P = 0.032) and advanced stage (stage IV; P = 0.032) (Table 1). Furthermore, it was related to poor prognosis in stage III cancers (P = 0.017). Although the statistical significance between two subunits and various clinicopathological findings appeared slightly different, immunostaining results clearly demonstrated that expression of subunits representing both the F1 and Fo complexes were upregulated in liver metastasis (Fig. 1c).
Because FoF1‐ATP synthase is a complex of multiple subunits, it is not possible to increase ATP synthase activity by transfecting genes corresponding to complete individual subunits. Therefore, we assessed the invasiveness of the human colon cancer cell line SNU‐81 in vitro by suppressing FoF1‐ATP synthase α‐ and d‐subunit expression (Fig. 3). A previous study showed that SNU‐81 is a good host for siRNA transfection, and that transfection of d‐subunit siRNA is very efficient, both in suppressing expression and FoF1‐ATP synthase activity.( 18 ) In combination with immunohistochemical findings, in vitro invasion assay results imply that disturbed function of ATP synthase by any of the dysregulated subunits of the complex causes a decrease in the invasive ability of human colon cancer cells.
The role of FoF1‐ATP synthase–F1‐ATPase in human cancer has been examined in recent studies.( 25 , 26 , 27 , 28 ) These studies demonstrated that expression of the β subunit of FoF1‐ATP synthase–F1‐ATPase is repressed in human tumor samples of liver, colon, kidney, lung, breast, gastric and esophageal cancer, compared to their corresponding normal tissues, whereas protein markers of glycolysis are upregulated in most human tumor samples.( 25 , 26 ) On the basis of these findings, it was hypothesized that the metabolic phenotype of tumor cells shifts from oxidative phosphorylation to glycolysis.( 25 , 26 ) However, these results were obtained from a limited number of normal or tumor samples. In addition, decreased expression of the β‐subunit in colon and lung cancers correlated with a poorer prognosis.( 25 , 27 ) These results were also reported in limited samples of early stage tumors, specifically, pT1 + pT2 lung adenocarcinomas and Duke's stage B2 + B3 colon adenocarcinomas.
Previous results from Cuezva and colleagues( 25 , 26 , 27 , 28 ) support the ‘Warburg hypothesis’.( 29 ) In 1926, Otto Warburg stated that ‘normal cells die if they glycolyse anaerobically, but aerobically, the glycolysing tumor cell not only continues to exist, but is even able to grow to an unlimited extent, turning to account the chemical energy of the glycolysis’.( 29 ) Cuezva and colleagues hypothesized that impaired oxidative phosphorylation in mitochondria hampered the efficient execution of apoptosis, based on the previous data that cells devoid of mitochondrial DNA, which are unable to perform oxidative phosphorylation, have a resistant apoptotic phenotype.( 28 , 30 , 31 ) A recent in vitro study by our laboratory also showed that downregulation of FoF1‐ATP synthase induces an increase in 5‐fluorouracil resistance.( 18 ) These findings may be inconsistent with our present findings. However, in the latest study by Isidoro et al. expression of the β‐subunit of F1‐ATPase in breast cancer was not significantly different from that in normal tissue.( 28 ) Moreover, higher expression of the β‐subunit in breast cancer was related to unfavorable outcome of these patients, concordant with our present data.( 28 ) They interpreted these discrepancies in several ways, one of which is the direct impact of the increased β‐subunit on cellular energy transduction, which may obscure the beneficial contribution to apoptotic potential resulting from the increase in mitochondrial oxidative phosphorylation.( 28 ) To accomplish the multistep cascade of metastasis, tumor cells may need an active supply of energy. Moreover, tumor cells with high levels of ATP or ATP synthase may be superior to those with low ATP or ATP synthase levels in terms of their energy source.
The role of FoF1‐ATP synthase–F1‐ATPase in cancer progression or metastasis is yet to be characterized in detail. Two comparative proteomic analyses from tumor tissue and non‐involved tissue samples demonstrated increased expression of subunit 6 and d‐subunit of FoF1‐ATP synthase in tumor samples of thyroid papillary carcinoma and lung adenocarcinoma, respectively.( 32 , 33 ) However, these studies did not evaluate the correlation between ATP synthase expression and clinicopathological parameters.( 32 , 33 ) Notably, increased expression of α‐subunit FoF1‐ATP synthase had been reported in a recurrent or metastatic melanoma cell line, compared to the primary melanoma cell line.( 34 ) Overexpression of the β‐subunit of F1‐ATPase was also demonstrated in lung and lymph node metastasis relative to primary tumor from a study using a xenograft model of Bcl‐xL‐expressing breast cancer cells.( 35 ) Moreover, a number of studies have focused on ATP or ATP synthase as a target for anticancer therapy, using animal models or cancer cell lines.( 36 , 37 , 38 )
The involvement of ATP synthase in metastasis as well as carcinogenesis is currently a topic of extensive research. A recent study demonstrated that angiostatin, a potent inhibitor of angiogenesis, binds and inhibits FoF1‐ATP synthase in endothelial cells, and is cytotoxic to tumor cells at low extracellular pH.( 39 )
Even our previous study clearly showed that one of the dysregulated components resulted in a decrease in ATP synthase activity;( 18 ) increased expression of a couple of subunits is not sufficient for the change in either ATP synthase activity or intracellular ATP content. Because apoptosis‐inducing factor already showed a good example of bifunctional activity as NADH oxidase involved in mitochondrial respiration and caspase‐independent apoptosis,( 40 ) dysregulated α‐ and d‐subunits may have to be considered not only in the aspect of ATP synthase activity but also in another unraveled role in metastasis. In conclusion, the exact molecular mechanism by which ATP synthase participates in liver metastasis of primary colon cancer remains to be established. However, our overall findings clearly demonstrate that an increase in ATP synthase is associated with liver metastasis of primary colorectal cancer, and that the protein plays an important role in liver metastasis.
Acknowledgments
This work was supported by a research grant from the National Cancer Center, Korea. We thank Dr Myeong Cherl Kook for kindly evaluating our immunohistochemical results.
References
- 1. Jemal A, Murray T, Ward E et al . Cancer statistics, 2005. CA Cancer J Clin 2005; 55: 10–30. [DOI] [PubMed] [Google Scholar]
- 2. O’Connell JB, Maggard MA, Ko CY. Colon cancer survival rates with the New American Joint Committee on Cancer sixth edition staging. J Natl Cancer Inst 2004; 96: 1420–5. [DOI] [PubMed] [Google Scholar]
- 3. Fortner JG, Silva JS, Golbey RB, Cox EB, Maclean BJ. Multivariate analysis of a personal series of 247 consecutive patients with liver metastases from colorectal cancer. I. Treatment by hepatic resection. Ann Surg 1984; 199: 306–16. [DOI] [PMC free article] [PubMed] [Google Scholar]
- 4. Adson MA. Resection of liver metastases – when is it worthwhile? World J Surg 1987; 11: 511–20. [DOI] [PubMed] [Google Scholar]
- 5. Fidler IJ. The pathogenesis of cancer metastasis: the ‘seed and soil’ hypothesis revisited. Nat Rev Cancer 2003; 3: 453–8. [DOI] [PubMed] [Google Scholar]
- 6. Curran S, Dundas SR, Buxton J, Leeman MF, Ramsay R, Murray GI. Matrix metalloproteinase/tissue inhibitors of matrix metalloproteinase phenotype identifies poor prognosis colorectal cancers. Clin Cancer Res 2004; 10: 8229–34. [DOI] [PubMed] [Google Scholar]
- 7. Tokunaga T, Oshika Y, Abe Y et al . Vascular endothelial growth factor (VEGF) mRNA isoform expression pattern is correlated with liver metastasis and poor prognosis in colon cancer. Br J Cancer 1998; 77: 998–1002. [DOI] [PMC free article] [PubMed] [Google Scholar]
- 8. Nanashima A, Yamaguchi H, Sawai T et al . Prognostic factors in hepatic metastases of colorectal carcinoma: immunohistochemical analysis of tumor biological factors. Dig Dis Sci 2001; 46: 1623–8. [DOI] [PubMed] [Google Scholar]
- 9. Berney CR, Yang JL, Fisher RJ, Russell PJ, Crowe PJ. Overexpression of nm23 protein assessed by color video image analysis in metastatic colorectal cancer: correlation with reduced patient survival. World J Surg 1998; 22: 484–90. [DOI] [PubMed] [Google Scholar]
- 10. Koehler A, Bataille F, Schmid C et al . Gene expression profiling of colorectal cancer and metastases divides tumours according to their clinicopathological stage. J Pathol 2004; 204: 65–74. [DOI] [PubMed] [Google Scholar]
- 11. Jansova E, Koutna I, Krontorad P et al . Comparative transcriptome maps: a new approach to the diagnosis of colorectal carcinoma patients using cDNA microarrays. Clin Genet 2006; 69: 218–27. [DOI] [PubMed] [Google Scholar]
- 12. Rodland KD. Proteomics and cancer diagnosis: the potential of mass spectrometry. Clin Biochem 2004; 37: 579–83. [DOI] [PubMed] [Google Scholar]
- 13. Chambers G, Lawrie L, Cash P, Murray GI. Proteomics: a new approach to the study of disease. J Pathol 2000; 192: 280–8. [DOI] [PubMed] [Google Scholar]
- 14. Lawrie LC, Curran S, McLeod HL, Fothergill JE, Murray GI. Application of laser capture microdissection and proteomics in colon cancer. Mol Pathol 2001; 54: 253–8. [DOI] [PMC free article] [PubMed] [Google Scholar]
- 15. Stulik J, Hernychova L, Porkertova S et al . Proteome study of colorectal carcinogenesis. Electrophoresis 2001; 22: 3019–25. [DOI] [PubMed] [Google Scholar]
- 16. Drew JE, Rucklidge GJ, Duncan G et al . A proteomics approach to identify changes in protein profiles in pre‐cancerous colon. Biochem Biophys Res Commun 2005; 330: 81–7. [DOI] [PubMed] [Google Scholar]
- 17. Ying‐Tao Z, Yi‐Ping G, Lu‐Sheng S, Yi‐Li W. Proteomic analysis of differentially expressed proteins between metastatic and non‐metastatic human colorectal carcinoma cell lines. Eur J Gastroenterol Hepatol 2005; 17: 725–32. [DOI] [PubMed] [Google Scholar]
- 18. Shin YK, Yoo BC, Chang HJ et al . Down‐regulation of mitochondrial F1Fo‐ATP synthase in human colon cancer cells with induced 5‐fluorouracil resistance. Cancer Res 2005; 65: 3162–70. [DOI] [PubMed] [Google Scholar]
- 19. Hamilton SR, Aaltonen LA eds. WHO Classification of Tumors; Pathology, Genetics of Tumors of the Digestive System, 1st edn. Lyon: IARC Press, 2000. [Google Scholar]
- 20. Greene FL, Page DL, Fleming ID et al ., eds. AJCC Cancer Staging Manual, 6th edn. New York: Springer‐Verlag, 2002. [Google Scholar]
- 21. Torhorst J, Bucher C, Kononen J et al . Tissue microarrays for rapid linking of molecular changes to clinical endpoints. Am J Pathol 2001; 159: 2249–56. [DOI] [PMC free article] [PubMed] [Google Scholar]
- 22. Collinson IR, Runswick MJ, Buchanan SK et al . Fo membrane domain of ATP synthase from bovine heart mitochondria: purification, subunit composition, and reconstitution with F1‐ATPase. Biochemistry 1994; 33: 7971–8. [DOI] [PubMed] [Google Scholar]
- 23. Walker JE, Fearnley IM, Gay NJ et al . Primary structure and subunit stoichiometry of F1‐ATPase from bovine mitochondria. J Mol Biol 1985; 184: 677–701. [DOI] [PubMed] [Google Scholar]
- 24. Champagne E, Martinez LO, Collet X, Barbaras R. Ecto‐F1Fo ATP synthase/F1 ATPase: metabolic and immunological functions. Curr Opin Lipidol 2006; 17: 279–84. [DOI] [PubMed] [Google Scholar]
- 25. Cuezva JM, Krajewska M, De Heredia ML et al . The bioenergetic signature of cancer: a marker of tumor progression. Cancer Res 2002; 62: 6674–81. [PubMed] [Google Scholar]
- 26. Isidoro A, Martinez M, Fernandez PL et al . Alteration of the bioenergetic phenotype of mitochondria is a hallmark of breast, gastric, lung and oesophageal cancer. Biochem J 2004; 378: 17–20. [DOI] [PMC free article] [PubMed] [Google Scholar]
- 27. Cuezva JM, Chen G, Alonso AM et al . The bioenergetic signature of lung adenocarcinomas is a molecular marker of cancer diagnosis and prognosis. Carcinogenesis 2004; 25: 1157–63. [DOI] [PubMed] [Google Scholar]
- 28. Isidoro A, Casado E, Redondo A et al . Breast carcinomas fulfill the Warburg hypothesis and provide metabolic markers of cancer prognosis. Carcinogenesis 2005; 26: 2095–104. [DOI] [PubMed] [Google Scholar]
- 29. Warburg O. über den Stoffwechsel der Tumoren . Berlin: Springer, 1926. Translated: The metabolism of tumors. London: Arnold Constable, 1930. [Google Scholar]
- 30. Kim JY, Kim YH, Chang I et al . Resistance of mitochondrial DNA‐deficient cells to TRAIL: role of Bax in TRAIL‐induced apoptosis. Oncogene 2002; 21: 3139–48. [DOI] [PubMed] [Google Scholar]
- 31. Park SY, Chang I, Kim JY et al . Resistance of mitochondrial DNA‐depleted cells against cell death: role of mitochondrial superoxide dismutase. J Biol Chem 2004; 279: 7512–20. [DOI] [PubMed] [Google Scholar]
- 32. Haugen DR, Fluge Ø, Reigstad LJ, Varhaug JE, Lillehaug JR. Increased expression of genes encoding mitochondrial proteins in papillary thyroid carcinomas. Thyroid 2003; 13: 613–20. [DOI] [PubMed] [Google Scholar]
- 33. Chen G, Gharib TG, Huang C et al. Proteomic analysis of lung adenocarcinoma: identification of a highly expressed set of proteins in tumors. Clin Cancer Res 2002; 8: 2298–305. [PubMed] [Google Scholar]
- 34. Katagata Y, Kondo S. Keratin expression and its significance in five cultured melanoma cell lines derived from primary, recurrent and metastasized melanomas. FEBS Lett 1997; 407: 25–31. [DOI] [PubMed] [Google Scholar]
- 35. España L, Martín B, Aragüés R et al. Bcl‐x(L)‐mediated changes in metabolic pathways of breast cancer cells: from survival in the blood stream to organ‐specific metastasis. Am J Pathol 2005; 167: 1125–37. [DOI] [PMC free article] [PubMed] [Google Scholar]
- 36. Geschwind JF, Ko YH, Torbenson MS, Magee C, Pedersen PL. Novel therapy for liver cancer: direct intraarterial injection of a potent inhibitor of ATP production. Cancer Res 2002; 62: 3909–13. [PubMed] [Google Scholar]
- 37. Ko YH, Smith BL, Wang Y et al . Advanced cancers: eradication in all cases using 3‐bromopyruvate therapy to deplete ATP. Biochem Biophys Res Commun 2004; 324: 269–75. [DOI] [PubMed] [Google Scholar]
- 38. Gong Y, Sohn H, Xue L, Firestone GL, Bjeldanes LF. 3,3′‐Diindolylmethane is a novel mitochondrial H(+)‐ATP synthase inhibitor that can induce p21 (Cip1/Waf1) expression by induction of oxidative stress in human breast cancer cells. Cancer Res 2006; 66: 4880–7. [DOI] [PubMed] [Google Scholar]
- 39. Chi SL, Pizzo SV. Angiostatin is directly cytotoxic to tumor cells at low extracellular pH: a mechanism dependent on cell surface‐associated ATP synthase. Cancer Res 2006; 66: 875–82. [DOI] [PubMed] [Google Scholar]
- 40. Delettre C, Yuste VJ, Moubarak RS, Bras M, Robert N, Susin SA. Identification and characterization of AIFsh2, a mitochondrial apoptosis‐inducing factor (AIF) isoform with NADH oxidase activity. J Biol Chem 2006; 281: 18507–18. [DOI] [PubMed] [Google Scholar]