

Abstract
Osteopontin (OPN) plays an important role in the development, invasion, and metastasis of malignancies. Recently, several studies have reported that OPN enhances chemoresistance in small‐cell lung cancer and breast cancer by blocking caspase‐9 and caspase‐3‐dependent cell apoptosis. The aim of this study was to assess the value of OPN and caspase‐3 for predicting tumor recurrence after curative resection in hepatocellular carcinoma (HCC) patients. We found that OPN expression increased concordantly with increasing metastatic potential in human HCC cell lines, whereas caspase‐3 expression declined. In a tumor tissue microarray immunohistochemical analysis, we found that patients with higher levels of OPN and lower levels of caspase‐3 had a significantly poorer prognosis than patients with lower OPN and higher caspase‐3 levels. The combination of OPN and caspase‐3 expression thus served as an effective prognosticator. These findings suggest that OPN alone or in combination with caspase‐3 may act as an independent indicator for HCC patients after curative resection.
(Cancer Sci 2010; 101: 1314–1319)
HCC is a major health problem in developing countries such as China, and its incidence is increasing in developed regions, including Japan, Western Europe, and the USA.( 1 , 2 ) Although hepatectomy is the best way to ensure long‐term survival for patients with HCC, the high rate of metastatic recurrence after operations has hindered further improvement of patient prognoses.( 3 , 4 ) The molecular mechanisms underlying the progression of HCC are less clear. Recent studies have sought to identify molecular markers predictive of metastasis as well as new therapeutic targets for HCC metastatic recurrence.
OPN plays an important role in the development, invasion, and metastasis of malignancies. Factors acting downstream of OPN interrupt the cell cycle, prevent apoptosis, and promote cell survival, all of which correlate with tumor progression.( 5 ) Overexpression of OPN has been observed in prostate,( 6 ) breast,( 7 ) and pancreatic cancer.( 8 ) Previous studies found that OPN enhanced chemoresistance in small‐cell lung cancer and breast cancer by blocking caspase‐9‐ and caspase‐3‐dependent cell apoptosis( 9 , 10 ) The role of OPN in HCC has also generated significant interest, especially with regard to its role as a prognostic factor.( 11 , 12 , 13 , 14 ) However, it is unclear how OPN affects HCC cell apoptosis. Caspases are crucial mediators of apoptosis; among them, caspase‐3 is a principal enzyme in the apoptotic cascade and is often used to detect apoptotic activity.( 15 ) In this study, we examined OPN and caspase‐3 expression in HCC cell lines and tumor TMA in 248 cases in order to investigate the predictive value of OPN and caspase‐3 for the prognosis of HCC patients.
Materials and Methods
Cell lines. MHCC97‐L and MHCC97‐H human HCC cell lines with low or high metastatic potential ( 16 , 17 ) established at our institute were used in these studies. Chang liver cells were obtained from the American Type Culture Collection (Manassas, VA, USAP. Cells were cultured in DMEM (Gibco BRL, Grand Island, NY, USA), high glucose medium with 10% FBS (Hyclone, Logan, UT, USA), 1% penicillin, and streptomycin in a humidified 37°C incubator supplied with 5% CO2 for 48 h, then cells were cultured in the medium with 5‐FU (Sigma, St. Louis, MO, USA) at 100 μg/mL for 24 h.( 18 )
Western blot analysis. The expression levels of OPN and caspase‐3 in cell lines were evaluated via western blot analysis. Total protein was extracted in lysis buffer for 45 min on ice. Equal amounts of protein were separated via sodium dodecyl sulfate–polyacrylamide gel electrophoresis and transferred onto polyvinylidene fluoride membranes. Primary antibodies against OPN (1:500; Santa Cruz Biotechnology, Santa Cruz, CA, USA) and caspase‐3 (1:5000; Abcam, Cambridge, UK) were used. A monoclonal antibody against β‐actin (1:1000; Santa Cruz Biotechnology) was used as an internal control. The bands were quantified using the Image J software (National Institutes of Health, Bethesda, MD, USA). The OPN/β‐actin and caspase‐3/β‐actin ratios were calculated for relative quantitation. Each experiment was repeated at least three times.
Immunofluorescence assay. The immunofluorescence assay protocols are described elsewhere( 19 ) (see Supporting Information for details). Primary antibodies against OPN (1:200; Santa Cruz Biotechnology) and caspase‐3 (1:100; Abcam) were used. Secondary antibodies were Cy3‐conjugated sheep antimouse IgG and FITC‐conjugated goat antirabbit IgG. A negative control (primary antibody omitted) was included in all assays.
Patient selection and clinical follow‐up. For the TMA studies, specimens of 248 cases were obtained from 750 consecutive patients with HCC who underwent curative resection at our institute by the same surgical team between 2003 and 2004. The criteria for curative resection have been described previously.( 20 , 21 ) The clinicopathologic characteristics of patients in the TMA are summarized in Table S1. Ethical approval for human subjects was obtained from the research ethics committee of Zhongshan Hospital; informed consent was obtained from each patient. The inclusion criteria for HCC patients included (i) a distinctive pathologic diagnosis of HCC; (ii) no prior anticancer treatment; and (iii) complete clinicopathologic and follow‐up data. Preoperative liver function was classified by the Child–Pugh score system. The BCLC staging system was applied to classify the disease stage.( 22 , 23 ) Tumor differentiation was graded by the Edmondson grading system.
Follow‐up was completed on 15 March 2009. The median follow‐up was 44 months (range, 2–75 months). The follow‐up procedures and treatment modalities after relapse were described in our previous studies.( 20 , 24 , 25 ) A diagnosis of recurrence was based on typical imaging appearance in computed tomography and/or magnetic resonance imaging scan and an elevated AFP level. OS was defined as the interval between the dates of surgery and death. TTR was defined as the time between the start of surgery and the first report of intrahepatic or distant recurrence (excluding patients who had died from non‐liver cancer causes before recurrence);( 26 ) for patients who had not experienced recurrence at the time of death or last follow‐up, TTR was calculated using the date of death or the last follow‐up.
TMA and immunohistochemistry. The TMA was constructed as previously described.( 25 ) Briefly, identical 1‐mm diameter cylinders from the center of the tumor were included from each case. Cylinders from the donor blocks were transferred to the recipient paraffin block at defined array positions. Consecutive 4‐μm sections were placed on 3‐aminopropyltriethoxysilane‐coated slides (in collaboration with Shanghai Biochip Company, Shanghai, China). The immunohistochemistry protocols are described elsewhere( 27 ) and in the supplementary material. Primary antibodies were mouse antihuman OPN (1:200; Santa Cruz Biotechnology) and rabbit antihuman caspase‐3 (1:100; Abcam). The components of the Envision‐plus detection system were applied (EnVision+/HRP/Mo; Dako, Carpinteria, CA, USA). Reaction products were visualized by incubation with 3, 3‐diaminobenzidine solution. Negative controls were treated identically but with the primary antibodies omitted.
Evaluation of immunohistochemical variables. Photographs of four representative fields were captured by the Leica QWin Plus version 3 software; identical settings were used for each photograph (see Supporting Information for details) under high‐power magnification (×200). The density of positive staining was evaluated using a Leica CCD camera DFC420 connected to a Leica DM IRE2 microscope (Leica Microsystems Imaging Solutions, Cambridge, UK) and a computer. The OPN and caspase‐3 densities were determined by Image‐Pro Plus version 5.0 software (Media Cybernetics, Bethesda, MD, USA) as previously described.( 27 ) Uniform settings were used for each antibody staining. The IOD of all the positive staining in each photograph was measured and the density of each antibody was calculated as the product of IOD/total area.
Statistical analyses. Statistical analyses were performed with SPSS 15.0 for Windows (SPSS, Chicago, IL, USA). The χ2‐test, Student’s t‐test, and one‐way anova were used for comparison between groups. Cumulative survival time was calculated by the Kaplan–Meier method and analyzed by the log‐rank test. Univariate and multivariate analyses were based on the Cox proportional hazard regression model. P < 0.05 was considered statistically significant. For all immunohistochemical markers, the cut‐off for definition of subgroups was the median value.
Results
Expression of OPN and caspase‐3 in HCC cell lines. To assess OPN and caspase‐3 expression in human HCC cell lines of varying metastatic potential, we performed both western blot analysis and immunofluorescence assays. We found that OPN expression levels correlated positively with the metastatic potential of the human HCC cell lines. High levels of OPN were detected in the cytoplasm of MHCC97‐H cells, moderate levels were detected in MHCC97‐L cells, and only a weak signal was detected in Changliver cells. In contrast, caspase‐3 expression correlated negatively with the metastatic potential of the tested cell lines (1, 2).
Figure 1.
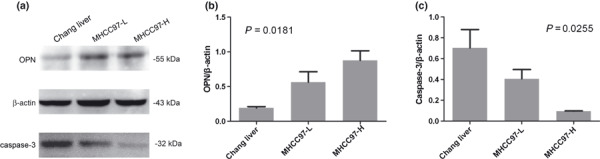
Detection of osteopontin (OPN) and caspase‐3 in human hepatocellular carcinoma (HCC) cell lines by western blot analysis (a). Relative quantitation is also shown. OPN expression increased with increasing metastatic potential in human HCC cell lines (b). Caspase‐3 decreased with increasing metastatic potential (c). A monoclonal antibody against β‐actin was used as an internal control.
Figure 2.
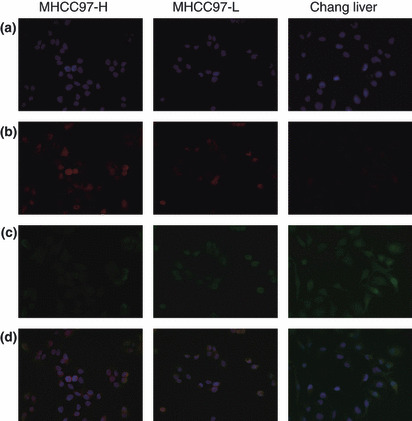
Double staining of osteopontin (OPN) and caspase‐3 by immunofluorescence: (a) DAPI staining. (b) OPN was highly enriched in the cytoplasm of MHCC97‐H cells, moderately so in MHCC97‐L cells, and weakly so in Chang liver cells. (c) Caspase‐3 expression increased as metastatic potential decreased in hepatocellular carcinoma (HCC) cell lines. (d) OPN and caspase‐3 expression in different cell lines (magnification, ×200).
OPN and caspase‐3 expression detected by TMA and immunohistochemical staining. Diffuse cytoplasmic staining for OPN and caspase‐3 protein was observed in most HCC cases (Fig. 3a–d). Higher OPN levels were detected in tissues from patients who had tumor recurrence within the follow‐up period (RG, n = 140) than in tissues from the other patients (NRG, n = 108) (P < 0.0001). Conversely, caspase‐3 density was significantly higher in NRG patients than in RG patients (P = 0.0227) (Fig. 3e). As shown in Table 1, lower caspase‐3 was associated with larger tumor size and advanced BCLC stage, whereas no significant association was found between OPN density and tumor size, vascular invasion, or BCLC stage.
Figure 3.

Expression of osteopontin (OPN) and caspase‐3 by immunohistochemistry in a tissue microarray (TMA) constructed from hepatocellular carcinoma (HCC) tumor samples. Representative intratumoral tissue sections with high‐ or low‐density OPN and caspase‐3 are shown. (a) High OPN staining; (b) low OPN staining; (c) high caspase‐3 expression; and (d) low caspase‐3 expression. OPN and caspase‐3 staining patterns were restricted to the cytoplasm with a focal or diffuse pattern; positive cells are stained brown (magnification, ×400). OPN and caspase‐3 densities were compared (Student’s t‐test) in the intratumoral tissues of patients without tumor recurrence (NRG, n = 108) or with tumor recurrence (RG, n = 140) (e).
Table 1.
Associations between OPN/caspase‐3 density as detected by immunohistochemical staining of tissue microarrays and clinicopathologic features of HCC patients (n = 248)
| Variables | Intratumoral OPN density, n | P‐values | Intratumoral caspase‐3 density, n | P‐values | ||
|---|---|---|---|---|---|---|
| High | Low | High | Low | |||
| Age (years) | ||||||
| ≤50 | 62 | 64 | 0.799 | 61 | 65 | 0.611 |
| >50 | 62 | 60 | 63 | 59 | ||
| Sex | ||||||
| Male | 111 | 106 | 0.337 | 112 | 105 | 0.179 |
| Female | 13 | 18 | 12 | 19 | ||
| Hepatitis history | ||||||
| Yes | 93 | 92 | 0.884 | 87 | 98 | 0.109 |
| No | 31 | 32 | 37 | 26 | ||
| HBsAg | ||||||
| Positive | 114 | 103 | 0.035 | 107 | 110 | 0.565 |
| Negative | 10 | 21 | 17 | 14 | ||
| Preoperative AFP (ng/mL) | ||||||
| ≤20 | 36 | 44 | 0.227 | 47 | 33 | 0.057 |
| >20 | 88 | 80 | 77 | 91 | ||
| Liver cirrhosis | ||||||
| Yes | 104 | 104 | 1 | 104 | 104 | 1 |
| No | 20 | 20 | 20 | 20 | ||
| ALT (U/L) | ||||||
| ≤40 | 55 | 63 | 0.309 | 58 | 60 | 0.799 |
| >40 | 69 | 61 | 66 | 64 | ||
| Tumor size (cm) | ||||||
| ≤5 | 64 | 63 | 0.899 | 75 | 52 | 0.003 |
| >5 | 60 | 61 | 49 | 72 | ||
| Tumor encapsulation | ||||||
| None | 62 | 63 | 0.899 | 55 | 70 | 0.057 |
| Complete | 62 | 61 | 69 | 54 | ||
| Vascular invasion | ||||||
| Yes | 56 | 51 | 0.521 | 49 | 58 | 0.249 |
| No | 68 | 73 | 75 | 66 | ||
| BCLC stage | ||||||
| 0 + A | 55 | 50 | 0.607 | 62 | 43 | 0.021 |
| B + C | 69 | 74 | 62 | 81 | ||
χ2‐tests were conducted for all analyses.
AFP, alpha‐fetoprotein; ALT, alanine aminotransferase; BCLC, Barcelona Clinic Liver Cancer staging system; HBsAg, hepatitis B surface antigen; HCC, hepatocellular carcinoma, OPN, osteopontin.
Prognostic value of OPN and caspase‐3 in HCC patients. At the time of the last follow‐up, 140 patients had experienced tumor recurrence and 122 patients had died, including 24 patients who died of liver failure without record of tumor recurrence. The 3‐ and 5‐year OS rates were 58.2% and 47.2%, respectively, and the 3‐ and 5‐year recurrence rates were 55.8% and 62.7%, respectively.
Patients with higher OPN levels had significantly shorter median OS time and TTR than the patients with lower OPN levels (OS time: 41 months vs not reached, P = 0.0103; TTR: 19 months vs 53 months, P = 0.0002) (Fig. 4a,b). However, caspase‐3 density was found to be associated with TTR (P = 0.0219) but not OS (P = 0.0902) (Fig. 4c,d).
Figure 4.
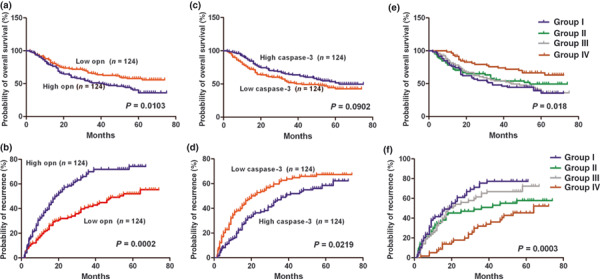
Kaplan–Meier curves of overall survival (OS) and time to recurrence (TTR) in hepatocellular carcinoma (HCC) patients with different intratumoral osteopontin (OPN) and caspase‐3 levels. (a) The patients with higher OPN levels had significantly poorer OS and shorter TTR than patients with lower OPN levels (b). (c) There were no significant differences in OS between patients with different caspase‐3 levels. (d) Caspase‐3 density was associated with TTR. (e) OS and (f) TTR of the four groups with different combinations of OPN and caspase‐3 expression levels.
The combined influence of OPN and caspase‐3 densities on the prognosis of HCC patients was also evaluated. Using the median number as a cut‐off, patients were classified into four groups: Group I, patients with high OPN and low caspase‐3 (n = 59); Group II, patients with low OPN and low caspase‐3 (n = 65); Group III, patients with high OPN and high caspase‐3 (n = 65); and Group IV, patients with low OPN and high caspase‐3 (n = 59). Significant differences in both OS (P = 0.018) and TTR (P = 0.0003) were found among the four groups (Fig. 4e,f). Both OS and TTR of the patients in Group IV were much longer than in Group I (OS: not reached vs 34 months, P = 0.018; TTR: 64 months vs 19 months, P = 0.0003). The 5‐year OS and HCC recurrence rates of Group I patients were 35.6% and 77.4%, respectively, compared with 66.4% and 45.4% for Group IV.
Using 12 months as the cut‐off value, all of the recurrences were divided into early recurrence and late recurrence.( 28 ) The early recurrence rate of Group I patients (with high OPN and low caspase‐3) was much higher than that of Group IV patients (with low OPN and high caspase‐3; 24 of 59 vs 4 of 59 patients, 40.68%vs 6.78%, P < 0.0001); however, no significant difference in the late recurrence rate was found between these two groups of patients (18 of 59 vs 20 of 59 patients, 30.5%vs 33.9%, P = 0.844). No significant difference in the early recurrence rate between Group II and Group III was found.
In a univariate analysis, AFP level, BCLC stage, vascular invasion, tumor size, and OPN density were found to be associated with the OS of HCC patients, while vascular invasion, OPN density, and caspase‐3 density were associated with TTR (Table 2). Multivariate analysis indicated that OPN density was an independent prognostic factor for both OS (P = 0.017) and recurrence (P = 0.00028), whereas caspase‐3 density was an independent predictor for recurrence (P = 0.032; Table 3). When OPN and caspase‐3 were combined, we found that the co‐index of OPN/caspase‐3 was an independent prognostic factor for both OS (P = 0.016) and TTR (P < 0.0001). Its predictive power for recurrence was superior to that of vascular invasion (P = 0.045) or OPN level alone (P = 0.00028) in the multivariate analysis (Table 3).
Table 2.
Univariate analyses of factors associated with overall survival and time to recurrence of HCC patients
| Variables | OS | TTR | ||
|---|---|---|---|---|
| Hazard ratio (95% CI) | P‐values | Hazard ratio (95% CI) | P‐values | |
| OPN (low vs high) | 1.262 (1.054–1.512) | 0.012 | 1.368 (1.155–1.62) | 0.00028 |
| Caspase‐3 (low vs high) | 0.738 (0.517–1.053) | 0.094 | 0.682 (0.489–0.951) | 0.024 |
| Sex (male vs female) | 0.918 (0.557–1.515) | 0.739 | 1.051 (0.648–1.705) | 0.84 |
| Age (>50 years vs≤50 years) | 0.929 (0.652–1.326) | 0.687 | 1.105 (0.793–1.54) | 0.554 |
| HBsAg (positive vs negative) | 0.838 (0.508–1.382) | 0.488 | 1.008 (0.614–1.653) | 0.976 |
| AFP (>20 ng/mL vs≤20 ng/mL) | 1.503 (1.004–2.25) | 0.048 | 1.308 (0.91–1.878) | 0.146 |
| ALT (>40 U/L vs≤40 U/L) | 0.992 (0.695–1.416) | 0.966 | 1.017 (0.729–1.417) | 0.922 |
| Tumor size (>5 cm vs≤5 cm) | 2.149 (1.494–3.09) | <0.0001 | 1.371 (0.984–1.912) | 0.062 |
| Tumor encapsulation (none vs complete) | 1.339 (0.936–1.914) | 0.11 | 1.33 (0.953–1.857) | 0.093 |
| Tumor differentiation (stages I–II vs III–IV) | 1.211 (0.794–1.848) | 0.373 | 1.093 (0.73–1.637) | 0.666 |
| Microvascular invasion (yes vs no) | 2.043 (1.43–2.92) | <0.0001 | 1.449 (1.038–2.023) | 0.03 |
| Liver cirrhosis (yes vs no) | 1.736 (0.976–3.086) | 0.06 | 1.325 (0.816–2.149) | 0.255 |
| Child–Pugh score (B vs A) | 0.805 (0.375–1.727) | 0.578 | 0.943 (0.48–1.854) | 0.866 |
| BCLC stage (0 + A vs B + C) | 2.139 (1.46–3.133) | <0.0001 | 1.272 (0.909–1.781) | 0.16 |
| Combination of OPN/caspase‐3 | ||||
| Overall | 0.021 | 0.00048 | ||
| IV vs I | 0.434 (0.251–0.753) | 0.003 | 0.347 (0.21–0.575) | <0.0001 |
Univariate analysis, Cox proportional hazards regression model. For OPN and caspase‐3, median values were used as cut‐off points for definition of subgroups (low expression and high expression groups). AFP, alpha‐fetoprotein; ALT, alanine aminotransferase; BCLC, Barcelona Clinic Liver Cancer staging system; CI, confidence interval; HBsAg, hepatitis B surface antigen; HCC, hepatocellular carcinoma; OPN, osteopontin; OS, overall survival; TTR, time to recurrence.
Table 3.
Multivariate analyses of factors associated with OS and TTR
| Variables | Hazard Ratio | 95% CI | P‐values |
|---|---|---|---|
| OS | |||
| OPN (low vs high) | 1.247 | 1.04–1.494 | 0.017 |
| AFP (>20 ng/mL vs≤20 ng/mL) | 1.295 | 0.855–1.962 | 0.223 |
| Tumor size (>5 cm vs≤5 cm) | 2.019 | 1.398–2.916 | 0.00018 |
| Microvascular invasion (yes vs no) | 1.735 | 1.197–2.516 | 0.004 |
| Combination of OPN/caspase‐3 | |||
| Overall | 0.045 | ||
| IV vs I | 0.505 | 0.29–0.879 | 0.016 |
| TTR | |||
| OPN (low vs high) | 1.369 | 1.156–1.622 | 0.00028 |
| Caspase‐3 (low vs high) | 0.694 | 0.497–0.969 | 0.032 |
| Microvascular invasion (yes vs no) | 1.408 | 1.007–1.968 | 0.045 |
| Combination of OPN/Caspase‐3 | |||
| Overall | 0.001 | ||
| IV vs I | 0.356 | 0.215–0.59 | <0.0001 |
Multivariate analysis, Cox proportional hazards regression model. For OPN and caspase‐3, median values were used as cut‐off points for definition of subgroups (low expression and high expression groups). Variables were adopted in multivariate analysis for their prognostic significance by univariate analysis; BCLC stage system was not assessed in multivariate analysis to avoid duplication of variables included in BCLC. AFP, alpha‐fetoprotein; BCLC, Barcelona Clinic Liver Cancer staging system; CI, confidence interval; OPN, osteopontin; OS, overall survival; TTR, time to recurrence.
Discussion
Many studies have recently shown that overexpression of OPN is associated with tumor invasion, progression, or metastasis in many kinds of human cancers. It was identified as the leading candidate for a marker of tumor progression.( 29 ) Caspase‐3 is a downstream effector cysteine protease in the apoptotic pathway. A recent experiment suggests that OPN suppresses caspase‐9‐ and caspase‐3‐dependent cell apoptosis.( 10 )
In our previous study on gene expression profiles associated with HCC metastasis, OPN was identified as one of the leading genes in a molecular prediction signature of 153 genes that could be used to predict the metastatic potential of HCC. Overexpression of OPN was found to be correlated with the metastatic potential of primary HCC and HCC‐derived cell lines in vitro, and an OPN‐neutralizing antibody efficiently blocked the invasion and metastasis of HCC cells both in vitro and in vivo. These results suggested that OPN might be a prognostic marker and a potential therapeutic target for HCC.( 13 ) Furthermore, the preoperative plasma OPN level could serve as an independent prognostic indicator for patients with HCC.( 12 , 30 )
In our in vitro experiments, we found that OPN expression correlated positively with metastatic potential in human HCC cell lines, similarly to our previous results.( 31 ) In contrast, caspase‐3 correlated negatively with metastatic potential in these human HCC cell lines. This inversion might be due to the ability of OPN to suppress caspase‐3‐dependent tumor cell apoptosis.( 9 , 10 ) These observations indicated that a co‐index of OPN and caspase‐3 levels might serve as a powerful novel prognosticator of HCC metastatic recurrence. Our TMA immunohistochemical assay supported this hypothesis, as the TMA results and clinical data showed that OPN had an adverse impact on patient outcomes. Patients with high OPN expression had significantly poorer OS and shorter TTR than patients with low OPN expression, whereas caspase‐3 density was associated with TTR. OPN levels alone or in combination with caspase‐3 density were determined to be an independent prognosticator of both OS and TTR. Patients with high OPN density and low caspase‐3 density had a higher probability of recurrence and death than patients with low OPN and high caspase‐3 levels. Moreover, according to univariate and multivariate Cox proportional hazards regression analyses, the predictive power of the co‐index was superior to that of OPN or caspase‐3 levels alone as well as other clinicopathological parameters like venous invasion, tumor size, and encapsulation. When we explored recurrence times, we found that more patients with high OPN and low caspase‐3 had an early recurrence than patients with low OPN and high caspase‐3. This result indicated that the OPN/caspase‐3 co‐index was a more accurate predictor of early metastatic recurrence after operation.
In summary, OPN/caspase‐3 expression is a promising independent predictor of recurrence and survival in HCC. While these proteins may one day be deemed suitable targets for adjuvant therapy, further studies are necessary to clarify the molecular mechanisms by which OPN regulates caspase‐3 expression and HCC tumor cell apoptosis.
Disclosure Statement
The authors have no conflict of interest.
Abbreviations
- 5‐FU
5‐Fluorouracil
- AFP
Alpha‐fetoprotein
- BCLC
Barcelona Clinic Liver Cancer staging system
- HCC
hepatocellular carcinoma
- IOD
integrated optical density
- OPN
osteopontin
- OS
overall survival
- RG
recurrence group
- TMA
tissue microarrays
- TTR
time to recurrence
Supporting information
Table S1. Clinicopathologic features of the hepatocellular carcinoma (HCC) patients.
Appendix S1. Supplementary material.
Please note: Wiley‐Blackwell are not responsible for the content or functionality of any supporting materials supplied by the authors. Any queries (other than missing material) should be directed to the corresponding author for the article.
Supporting info item
Supporting info item
Acknowledgments
The authors thank Dr Yue‐zhen Dai for her help with the English writing of the manuscript. We thank the Shanghai Biochip Co., Ltd., for helping in the construction of TMAs. This article was supported by grants from the National Key Projects for Infectious Disease of China (2008ZX10002‐021), Program of Shanghai Chief Scientist (08XD1400800), and the China National “863” Program (2006AA02Z473).
References
- 1. El‐Serag HB. Hepatocellular carcinoma: recent trends in the United States. Gastroenterology 2004; 127: S27–34. [DOI] [PubMed] [Google Scholar]
- 2. Jemal A, Siegel R, Ward E, Murray T, Xu J, Thun MJ. Cancer statistics, 2007. CA Cancer J Clin 2007; 57: 43–66. [DOI] [PubMed] [Google Scholar]
- 3. Tang ZY, Ye SL, Liu YK et al. A decade’s studies on metastasis of hepatocellular carcinoma. J Cancer Res Clin Oncol 2004; 130: 187–96. [DOI] [PubMed] [Google Scholar]
- 4. Yang Y, Nagano H, Ota H et al. Patterns and clinicopathologic features of extrahepatic recurrence of hepatocellular carcinoma after curative resection. Surgery 2007; 141: 196–202. [DOI] [PubMed] [Google Scholar]
- 5. El‐Tanani MK. Role of osteopontin in cellular signaling and metastatic phenotype. Front Biosci 2008; 13: 4276–84. [DOI] [PubMed] [Google Scholar]
- 6. Khodavirdi AC, Song Z, Yang S et al. Increased expression of osteopontin contributes to the progression of prostate cancer. Cancer Res 2006; 66: 883–8. [DOI] [PubMed] [Google Scholar]
- 7. Coppola D, Szabo M, Boulware D et al. Correlation of osteopontin protein expression and pathological stage across a wide variety of tumor histologies. Clin Cancer Res 2004; 10: 184–90. [DOI] [PubMed] [Google Scholar]
- 8. Sedivy R, Peters K, Kloppel G. Osteopontin expression in ductal adenocarcinomas and undifferentiated carcinomas of the pancreas. Virchows Arch 2005; 446: 41–5. [DOI] [PubMed] [Google Scholar]
- 9. Gu T, Ohashi R, Cui R et al. Osteopontin is involved in the development of acquired chemo‐resistance of cisplatin in small cell lung cancer. Lung Cancer 2009; 66: 176–83. [DOI] [PubMed] [Google Scholar]
- 10. Graessmann M, Berg B, Fuchs B, Klein A, Graessmann A. Chemotherapy resistance of mouse WAP‐SVT/t breast cancer cells is mediated by osteopontin, inhibiting apoptosis downstream of caspase‐3. Oncogene 2007; 26: 2840–50. [DOI] [PubMed] [Google Scholar]
- 11. Kim J, Ki SS, Lee SD et al. Elevated plasma osteopontin levels in patients with hepatocellular carcinoma. Am J Gastroenterol 2006; 101: 2051–9. [DOI] [PubMed] [Google Scholar]
- 12. Zhang H, Ye QH, Ren N et al. The prognostic significance of preoperative plasma levels of osteopontin in patients with hepatocellular carcinoma. J Cancer Res Clin Oncol 2006; 132: 709–17. [DOI] [PubMed] [Google Scholar]
- 13. Ye QH, Qin LX, Forgues M et al. Predicting hepatitis B virus‐positive metastatic hepatocellular carcinomas using gene expression profiling and supervised machine learning. Nat Med 2003; 9: 416–23. [DOI] [PubMed] [Google Scholar]
- 14. Pan HW, Ou YH, Peng SY et al. Overexpression of osteopontin is associated with intrahepatic metastasis, early recurrence, and poorer prognosis of surgically resected hepatocellular carcinoma. Cancer 2003; 98: 119–27. [DOI] [PubMed] [Google Scholar]
- 15. Ho PK, Hawkins CJ. Mammalian initiator apoptotic caspases. FEBS J 2005; 272: 5436–53. [DOI] [PubMed] [Google Scholar]
- 16. Cui JF, Liu YK, Zhang LJ et al. Identification of metastasis candidate proteins among HCC cell lines by comparative proteome and biological function analysis of S100A4 in metastasis in vitro. Proteomics 2006; 6: 5953–61. [DOI] [PubMed] [Google Scholar]
- 17. Wu X, Jia HL, Wang YF et al. HTPAP gene on chromosome 8p is a candidate metastasis suppressor for human hepatocellular carcinoma. Oncogene 2006; 25: 1832–40. [DOI] [PubMed] [Google Scholar]
- 18. Bu X, Jia F, Wang W, Guo X, Wu M, Wei L. Coupled down‐regulation of mTOR and telomerase activity during fluorouracil‐induced apoptosis of hepatocarcinoma cells. BMC Cancer 2007; 7: 208. [DOI] [PMC free article] [PubMed] [Google Scholar]
- 19. Johansson O, Liang Y, Heilborn JD, Marcusson JA. Langerhans cells in prurigo nodularis investigated by HLA‐DR and S‐100 immunofluorescence double staining. J Dermatol Sci 1998; 17: 24–32. [DOI] [PubMed] [Google Scholar]
- 20. Sun HC, Zhang W, Qin LX et al. Positive serum hepatitis B e antigen is associated with higher risk of early recurrence and poorer survival in patients after curative resection of hepatitis B‐related hepatocellular carcinoma. J Hepatol 2007; 47: 684–90. [DOI] [PubMed] [Google Scholar]
- 21. Shah SA, Cleary SP, Wei AC et al. Recurrence after liver resection for hepatocellular carcinoma: risk factors, treatment, and outcomes. Surgery 2007; 141: 330–9. [DOI] [PubMed] [Google Scholar]
- 22. Llovet JM, Fuster J, Bruix J. The Barcelona approach: diagnosis, staging, and treatment of hepatocellular carcinoma. Liver Transpl 2004; 10: S115–20. [DOI] [PubMed] [Google Scholar]
- 23. Marrero JA, Fontana RJ, Barrat A et al. Prognosis of hepatocellular carcinoma: comparison of 7 staging systems in an American cohort. Hepatology 2005; 41: 707–16. [DOI] [PubMed] [Google Scholar]
- 24. Qian YB, Zhang JB, Wu WZ et al. P48 is a predictive marker for outcome of postoperative interferon‐alpha treatment in patients with hepatitis B virus infection‐related hepatocellular carcinoma. Cancer 2006; 107: 1562–9. [DOI] [PubMed] [Google Scholar]
- 25. Gao Q, Qiu SJ, Fan J et al. Intratumoral balance of regulatory and cytotoxic T cells is associated with prognosis of hepatocellular carcinoma after resection. J Clin Oncol 2007; 25: 2586–93. [DOI] [PubMed] [Google Scholar]
- 26. Llovet JM, Di Bisceglie AM, Bruix J et al. Design and endpoints of clinical trials in hepatocellular carcinoma. J Natl Cancer Inst 2008; 100: 698–711. [DOI] [PubMed] [Google Scholar]
- 27. Zhu XD, Zhang JB, Zhuang PY et al. High expression of macrophage colony‐stimulating factor in peritumoral liver tissue is associated with poor survival after curative resection of hepatocellular carcinoma. J Clin Oncol 2008; 26: 2707–16. [DOI] [PubMed] [Google Scholar]
- 28. Poon RT, Fan ST, Ng IO, Lo CM, Liu CL, Wong J. Different risk factors and prognosis for early and late intrahepatic recurrence after resection of hepatocellular carcinoma. Cancer 2000; 89: 500–7. [PubMed] [Google Scholar]
- 29. Gotoh M, Sakamoto M, Kanetaka K, Chuuma M, Hirohashi S. Overexpression of osteopontin in hepatocellular carcinoma. Pathol Int 2002; 52: 19–24. [DOI] [PubMed] [Google Scholar]
- 30. Sun J, Xu HM, Zhou HJ et al. The prognostic significance of preoperative plasma levels of osteopontin in patients with TNM stage‐I of hepatocellular carcinoma. J Cancer Res Clin Oncol 2010; 136: 1–7. [DOI] [PubMed] [Google Scholar]
- 31. Sun BS, Dong QZ, Ye QH et al. Lentiviral‐mediated miRNA against osteopontin suppresses tumor growth and metastasis of human hepatocellular carcinoma. Hepatology 2008; 48: 1834–42. [DOI] [PubMed] [Google Scholar]
Associated Data
This section collects any data citations, data availability statements, or supplementary materials included in this article.
Supplementary Materials
Table S1. Clinicopathologic features of the hepatocellular carcinoma (HCC) patients.
Appendix S1. Supplementary material.
Please note: Wiley‐Blackwell are not responsible for the content or functionality of any supporting materials supplied by the authors. Any queries (other than missing material) should be directed to the corresponding author for the article.
Supporting info item
Supporting info item