

Abstract
Overexpression of enhancer of zeste homolog 2 (EZH2), an epigenetic repressor, occurs in various malignancies and is associated with poor prognosis; however, the functional role of EZH2 overexpression in cancer versus non‐cancerous tissue remains unclear. In this study, we found an inverse correlation between EZH2 and E‐cadherin gene expression in gastric cancer cells. Knockdown of EZH2 by short interfering RNA in gastric cancer cells resulted in a restoration of the E‐cadherin gene. We showed that the EZH2 complex existed with histone H3 and Lys27, which were methylated on E‐cadherin promoter regions in gastric cancer cells. The restoration of E‐cadherin was not involved in the change of the DNA methylation status in the E‐cadherin promoter region. Immunofluorescence staining confirmed the expression of E‐cadherin protein present in the cell membrane was restored after knockdown of EZH2, resulting in changing the cancer phenotype, such as its invasive capacity. In vivo, the relationship of inverse expression between EZH2 protein and E‐cadherin protein was observed at the individual cellular level in gastric cancer tissue. This study provides into the mechanisms underlying the functional role of EZH2 overexpression in gastric cancer cells and a new modality of regulation of E‐cadherin expression in silencing mechanisms of tumor suppressor genes. Our present study paves the way for exploring the blockade of EZH2 overexpression as a novel approach to treating cancer. (Cancer Sci 2008; 99: 738–746)
E‐cadherin is a transmembrane glycoprotein expressed on epithelial cells, responsible for calcium‐dependent homeotypical cell adhesion.( 1 ) It binds to several cytosolic proteins including α, β, and γ‐catenins, which are in turn linked to actins.( 2 , 3 ) Cell–cell and cell–matrix interactions are crucially involved in neoplastic transformation and metastasis.( 4 , 5 ) Defective cell adhesion might contribute to loss of contact inhibition of growth, an important early step in the neoplastic process. The importance of E‐cadherin in maintaining cell adhesion implies its dysfunction plays an important role in tumorigenesis, crossing normal tissue boundaries and metastasizing.( 6 , 7 )
Several possible genetic and epigenetic mechanisms have been proposed to inactivate E‐cadherin in gastric cancer. In gastric carcinogenesis, the critical role of E‐cadherin is underlined by the observation that familial gastric cancer is related to germline mutation of the E‐cadherin gene.( 8 ) Somatic mutations of the E‐cadherin gene were observed in approximately 33–50% of gastric carcinoma of the diffuse histological type, whereas no somatic mutation was observed in gastric carcinoma of the intestinal histological type.( 9 ) In contrast, the promoter CpG hypermethylation was found in 79% and 55% of the diffuse and intestinal histological types, respectively.( 9 , 10 ) Thus, hypermethylation of the promoter CpG was found to be the second hit in abrogating E‐cadherin expression, according to the well‐known two‐hit inactivation mechanism proposed by Knudson. 11 As well, loss of heterozygosity (LOH) was frequently observed in the diffuse‐type carcinoma.( 12 , 13 , 14 , 15 ) Moreover, the –160C/A polymorphism has a direct effect on transcriptional regulation of the CDH1 gene that encodes E‐cadherin protein.( 16 ) These findings show E‐cadherin to be an important putative tumor suppressor gene in gastric carcinogenesis. However, the associations between genetic and epigenetic alterations of CDH1 gene, including genetic mutations, LOH, genetic polymorphism, promoter hypermethylation, and the reduction of E‐cadherin protein, are still unclear. A recent investigation describes somatic mutation to be extremely low and the relationship between LOH and hypermethylation inversely related, with any two combinations of these three genetic and epigenetic factors failing to fulfill the classical two‐hit hypothesis of E‐cadherin inactivation in gastric cancer.( 17 ) In fact, it has been reported that the distribution of the methyl‐CpG island differed significantly among cell lines in which CDH1 transcription is repressed. Furthermore, the promoter region was almost methylation‐free in a cell line with gene silencing. Meanwhile, histone H3 Lys9 was methylated in all cell lines with silenced CDH1, suggesting histone modification, including histone H3 Lys9, plays a pivotal role in transcriptional silencing of CDH1.( 18 ) These findings prompted us to investigate other mechanisms, including histone modification, that might operate gene silencing at the transcriptional level and be required to inactivate E‐cadherin in gastric cancer, in addition to DNA hypermethylation in the promoter region.
The enhancer of zeste homolog (EZH2) gene is a human homolog of the Drosophila Polycomb group gene, enhancer of Zeste [E(z)].( 19 ) EZH2, which contains a SET domain, has intrinsic histone methyltransferase activity that catalyzes the addition of methyl groups to histone H3 at lysines 27 and 9, with a strong preference for K27.( 20 , 21 , 22 , 23 ) Methylated H3K27 serves as an anchorage mark for the recruitment of additional Polycomb group proteins including EED and SUZ12, which complex and contribute to form a repressive chromatin state.( 24 ) Moreover, there is increasing evidence that overexpression of EZH2 occurs in a variety of human malignancies including hematologic malignancies, prostate carcinoma, and breast carcinoma.( 25 , 26 , 27 , 28 ) Recently, it was reported that changes in the level of EZH2, as a chromatin remodeling protein, directly coordinate with DNA methylation to silence some specific genes including MYT1, WNT1, KCNA1, and CNR1.( 29 ) EZH2 and DNA methyltransferases are key epigenetic regulators involved in transcriptional repression function through a common mechanistic pathway to silence gene expression. However, at present, the underlying function of elevated EZH2 in cancer cells compared to normal cells is unknown.
Materials and Methods
Cell culture. Twelve human gastric cancer cell lines, MKN1, MKN7, MKN28, and MKN45 (purchased from Riken), TMK1 (kindly provided by Dr Wataru Yasui, Hiroshima University Graduate School of Biomedical Sciences), HSC43, HSC44PE, HSC57, HSC58, HSC59, and HSC60 (kindly provided by Dr Kazuyoshi Yanagihara, National Cancer Center Research Institute), and AGS (kindly provided by Dr Takeshi Azuma, Kobe University Graduate School of Medicine), five human breast cancer cell lines (BT549, MCF‐7, MDA‐MB‐231, MDA‐MB‐435, and T47D, purchased from American Type Culture Collection [ATCC]), and three human prostate cancer cell lines (LNCap, PC3, and CWR22, purchased from ATCC) were maintained in RPMI‐1640 supplemented with 10% heat‐inactivated fetal bovine serum and 1% glutamine in an atmosphere of 5% CO2 at 37°C.
Tissue specimen for RNA extraction. A total of 22 gastric cancer samples (International Union Against Cancer [UICC] tumor–node–metasasis [TNM] classification stage I, 12; stage II, 2; stage III, 6; and stage IV, 2; 10 intestinal‐type and 12 diffuse‐type adenocarcinomas) and corresponding non‐neoplastic gastric mucosa were studied. There were 12 male and 10 female patients (mean age 62 years; range 41–83 years). All the samples were obtained by surgical resection at the National Cancer Hospital, East, were frozen immediately in liquid nitrogen, then stored at –80°C until examination. The histology of each frozen sample was confirmed by microscopic analysis using the frozen section before RNA extraction. None of these patients received preoperative treatment, such as radiation or chemotherapy. All patients agreed to enrolment in the study and each gave informed consent. The institutional review board of the National Cancer Center approved all protocols on the patients’ agreement. All clinicopathological data, according to the TNM classification (UICC), were obtained from the clinical and pathological records.
RNA isolation and real‐time reverse transcription–polymerase chain reaction (RT‐PCR). Total RNA from different cell lines was isolated with TRIzol reagent (Invitrogen) and reverse transcribed to cDNA with ExScript RT Reagent (TaKaRa). Real‐time RT‐PCR was carried out with specific primers for EZH2 and E‐cadherin using Smart Cycler (Cepheid, Sunnyvale, CA). The expression of glyceraldehyde‐3‐phosphate dehydrogenase (GAPDH) was used to normalize for variance. Real‐time monitoring of PCR products was carried out with fluorescence of SYBR Green I (TaKaRa). Expression levels of specific genes were represented as ratios to that of GAPDH from the same master reaction. PCR primer pairs (5′ to 3′) used for each gene were as follows: EZH2, CCCTGACCTCTGTCTTACTTGTGGA and ACGTCAGATGGTGCCAGCAATA; E‐cadherin, GGATTGCAAATTCCTGCCATTC and AACGTTGTCCCGGGTGTCA; GAPDH, GCACCGTCAAGGCTGAGAAC and ATGGTGGTGAAGACGCCAGT.
Chromatin immunoprecipitation (ChIP) assay. In the present study, the ChIP assay was carried out as previously described.( 30 ) The PCR conditions for E‐cadherin gene promoter was applied with primer pair (5′ to 3′) as follows: AGAGGGTCACCGCGTCTATG and CTCACAGGTGCTTTGCAGTT.( 18 ) Five micrograms of each antibody was used in this assay, including EZH2 and dimethyl H3 (Lys9) purchased from Abcam, and trimethyl H3 (Lys27) purchased from Upstate Biotechnology. The specificity of the EZH2 antibody used for ChIP assay was confirmed by Western blot to observe the decreasing of EZH2 protein after transfection of two kinds of EZH2 short interfering RNA (siRNA) in advance (data not shown). Individual ChIP assays were repeated at least twice to confirm the reproducibility of the PCR‐based experiment. Preliminary PCR reactions were carried out to determine the optimal PCR conditions to assure linear amplification of DNA. PCR products were electrophoresed on a 6% polyacrylamide gel, stained with ethidium bromide, and photographed. To evaluate the level of EZH2 and histone methylation (K9 and K27) in each immunoprecipitation, the ratio was determined by quantifying the intensities of the PCR product in immunoprecipitated DNA versus input DNA (total chromatin) amplified by PCR in a linear range. The ratio was quantified using the DNA 1000 assay with the Agilent 2100 bioanalyzer and DNA chips for electrophoresis (Agilent Technologies).
Analysis of methylation status of genomic DNA. Bisulfite treatment of DNA for methylation assay was carried out as previously described.( 31 ) Methylation of E‐cadherin was determined by methylation‐specific polymerase chain reaction (MSP). Briefly, 2 µL of bisulfite‐treated DNA was used as a PCR template using primer sets specific for methylated and unmethylated alleles. The three pairs of MSP primers (MSP1, MSP2, and MSP3) for E‐cadherin used in this study were described previously.( 31 , 32 , 33 ) PCR products from methylated and unmethylated reactions were electrophoresed on 6% polyacrylamide gels and visualized by ethidium bromide staining.
The methylation status of E‐cadherin was also determined by combined bisulfite restriction analysis (COBRA), as previously described.( 34 ) After amplification, the PCR products were digested with restriction enzymes including SnaBI and TaqI for at least 12 h, electrophoresed on 6% polyacrylamide gels and visualized by ethidium bromide staining.
Next, sodium bisulfite‐modified DNA was amplified using the E‐cadherin sequencing primers.( 35 ) PCR products were cloned into the TA cloning vector pCR4 (Invitrogen), and individual clones were sequenced (Applied Biosystems automated sequencing).
RNA interference. Two different 21‐nucleotide duplex siRNAs for EZH2, or negative control siRNA, were synthesized by Ambion (EZH2; siRNA ID #107417 and #214022). Twenty‐four hours after plating, the cells were transfected with EZH2 siRNA or control siRNA using DharmaFECT transfection reagent (Dharmacon), according to the manufacturer's instructions. At various time points after transfection, the cells were harvested and subjected to several assays including real‐time PCR and Western blot analysis.
Western blot analysis. Cells were lyzed with whole cell lysis buffer (50 mM HEPES, 150 mM NaCl, 1.5 mM MgCl2, 0.5 mM ethylenediaminetetraacetic acid, 10% glycerol, 1% Triton X‐100, 10 mM NaF, 1 mM dithiothreitol, and 1 mM phenylmethylsulfonyl fluoride) and were alternately frozen and thawed three times in –80°C to rupture the cell membranes. Samples were incubated for 30 min on ice to lyse the nuclei and then centrifuged at 8900g The protein concentration of each sample was determined by a standard Bradford assay. Equal amounts of protein (20 µg) of each sample cell line were subjected to Western blot analysis. Probing antibodies included EZH2 (1:1000), E‐cadherin (1:2500), β‐catenin (1:500) (all supplied by BD Transduction Laboratories), and β‐actin (1:50; Santa Cruz Biotechnology).
Immunofluorescence. Cells grown on coverslips were fixed in 3% paraformaldehyde in phosphate‐buffered saline and processed for immunofluorescence. Rabbit antibody against EZH2 (1:125) (Zymed Laboratories), mouse antibodies against E‐cadherin (1:1000; BD Transduction Laboratories), and β‐catenin (1:1000; BD Transduction Laboratories) were used. Donkey secondary antibody was antirabbit IgG‐Alexa Fluor 488 and goat secondary antibody was antimouse IgG‐Alexa Fluor 546 (Molecular Probes). Cells were observed with a Zeiss LSM5 PASCAL and nuclear contour ratios were then computed.
Cell invasion assay. The cell invasion assay used a QCM Cell Invasion Assay (Chemicon) with an insert containing an 8 µm pore size membrane coated with a thin layer of ECMatrix (extracellular matrix). For the cell invasion of the gastric cancer cell line, MKN1 cells were transfected with EZH2 siRNA or control siRNA 48 h before cell suspension to the insert. The gastric cancer cells were loaded into a chamber coated with ECMatrix at the density of 5.0 × 10⁵ cells/mL in a volume of 0.3 mL serum‐free media. The plate with cells was incubated for 48 h at 37°C in a tissue culture incubator. Invading cells on the lower membrane surface were stained and the membrane was then photographed. The invading cells were quantified by dissolving stained cells in 10% acetic acid, then transferred to a 96‐well plate for colorimetric reading of the optical density at 560 nm.
Cell proliferation assay. MKN1 cells were transfected with EZH2 siRNA or control siRNA 48 h before starting the cell proliferation assay. Then cells were set at a density of 1.0 × 10⁵ per dish and subsequently incubated at 37°C in a tissue culture incubator. At 72, 96, 120, and 144 h after transfection, the cell number was counted to make a cell growth curve.
Immunohistochemistry. One‐hundred‐and‐fourteen gastric cancer specimens of intestinal‐type adenocarcinoma were collected for the immunohistochemical analysis. To exclude the possibility of genetic change including mutation and LOH on the E‐cadherin gene, the histology of all specimens was intestinal‐type adenocarcinoma. The patients were 97 males and 17 females (mean age 65 years; range 37–87 years), and the stage of tumors were classified according to the TNM classification (stage I, 101; stage II, 8; stage III, 4; and stage IV, 1).
Immunohistochemistry for EZH2 (1:25), E‐cadherin (1:1000), and β‐catenin (1:100) (all supplied by BD Transduction Laboratories) was carried out on formalin‐fixed, paraffin‐embedded tissue sections using steam heat‐induced or microwave‐induced epitope retrieval and the Dako Envision detection system. For EZH2, cases were scored as low (0–50% positive cells), and high (>51% positive cells); for E‐cadherin, cases were scored as negative and membranous. Appropriate positive and negative controls were carried out.
Results
EZH2 mRNA expression in gastric cancer cells. We investigated EZH2 mRNA expression in 12 gastric cancer cell lines and compared it to that of several prostate and breast cancer cell lines (Fig. 1a). The expression levels of EZH2 mRNA of gastric cancer cell lines were similar to those of prostate and breast cancer cell lines. Western blot analysis showed the expression of EZH2 protein in 12 gastric cancer cell lines (Fig. 1b). E‐cadherin mRNA expression was confirmed by real‐time RT‐PCR (Fig. 1c). The MKN1 cell line was mainly used for further analyses in vitro as these cells did not express E‐cadherin mRNA, as reported previously.( 36 )
Figure 1.
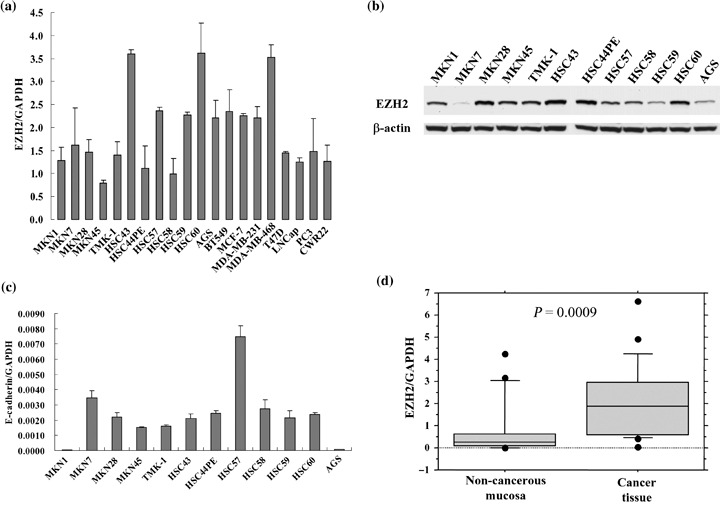
Profiling of enhancer of zeste homolog 2 (EZH2) mRNA expression in gastric cancer cell lines, gastric cancer tissue, and non‐cancerous mucosa. (a) EZH2 mRNA from cancer cells including gastric, prostate, and breast cancer cell lines was determined by quantitative real‐time reverse transcription–polymerase chain reaction (RT‐PCR). After normalizing with glyceraldehyde‐3‐phosphate dehydrogenase (GAPDH), the ratio of each cell line (mean ± SD) carried out in duplicate from two different experiments, was calculated based on the standard curve. (b) Western blot analysis showed expression of EZH2 protein in 12 gastric cancer cell lines. (c) The level of E‐cadherin mRNA expression in 12 gastric cancer cell lines was confirmed by quantitative real‐time RT‐PCR. (d) EZH2 mRNA from 22 pairs of gastric cancer and non‐cancerous gastric mucosa was determined by quantitative real‐time RT‐PCR. The values from each tissue sample were calculated as above. The significant difference between gastric cancer tissue and non‐cancerous mucosa was determined by Mann–Whitney U‐test.
We also found significantly high expression of EZH2 mRNA in surgically resected human gastric cancer tissue compared to corresponding non‐cancerous mucosa (P = 0.0009; Fig. 1d).
Inhibitory effect of EZH2 on E‐cadherin gene expression. To test whether EZH2 is a negative modulator of E‐cadherin gene expression in gastric cancer cells, EZH2 was suppressed with siRNA in the MKN1 gastric cancer cell line, in which E‐cadherin is silenced.( 36 ) RT‐PCR showed significantly decreased levels of EZH2 mRNA in MKN1 cells within 48–72 h and 96 h after transfection with EZH2 siRNA. The prominent decreased EZH2 protein level in MKN1 cells was observed 96 h after transfection with Western blotting (data not shown), and under such conditions the elevated level of E‐cadherin mRNA was detected in MKN1 cells (Fig. 2a). Real‐time RT‐PCR was carried out to quantify the restored expression level of E‐cadherin mRNA after knockdown of EZH2. E‐cadherin mRNA was elevated approximately five‐fold after EZH2 knockdown in MKN1 cells (Fig. 2b). Cell treatment with 5‐aza‐2′‐deoxycytidine and/or trichostatin A was carried out. TSA alone could restore E‐cadherin mRNA in MKN1 cells, the restored E‐cadherin mRNA level was a little higher than the effect of EZH2 siRNA transfection (Supplementary Materials Fig. S1). To show the direct interaction of EZH2 complex with the promoter region of the E‐cadherin gene, ChIP assay was carried out using the same MKN1 cells. ChIP assay revealed the binding of EZH2 to the E‐cadherin promoter region in control MKN1 cells (Fig. 2c). The amount of the EZH2 recruited to the promoter region of E‐cadherin inversely correlated with E‐cadherin mRNA expression level in MKN1 cells. E‐cadherin promoter‐binding trimethyl H3‐Lys27 was significantly reduced in MKN1 cells transfected with EZH2 siRNA. The decrease of trimethyl H3‐Lys27 was inversely correlated with the re‐expression of the E‐cadherin gene. Furthermore, the lower decreasing level of dimethylation of H3‐Lys9 than that of H3‐Lys27 trimethylation was detected in the MKN1 cells transfected with EZH2 siRNA, compared to the MKN1 cells transfected with control siRNA, suggesting that the status of H3‐Lys9 might also be involved in modulating E‐cadherin gene promoter activity by EZH2. Individual ChIP assays were repeated at least twice to confirm the reproducibility of the PCR‐based experiment. The results of ChIP assays were validated to make a diagram for each antibody (Fig. 2c). The level of EZH2 bound to the E‐cadherin promoter, and the levels of H3‐Lys27 trimethylation and H3‐Lys9 dimethylation in the E‐cadherin promoter were significantly decreased after knockdown of EZH2 (student's t‐test, P < 0.05). Taken together, we concluded that E‐cadherin gene silencing in gastric cancer cells can be mediated by the elevated level of EZH2, thus resulting in H3‐Lys27 hypermethylation.
Figure 2.
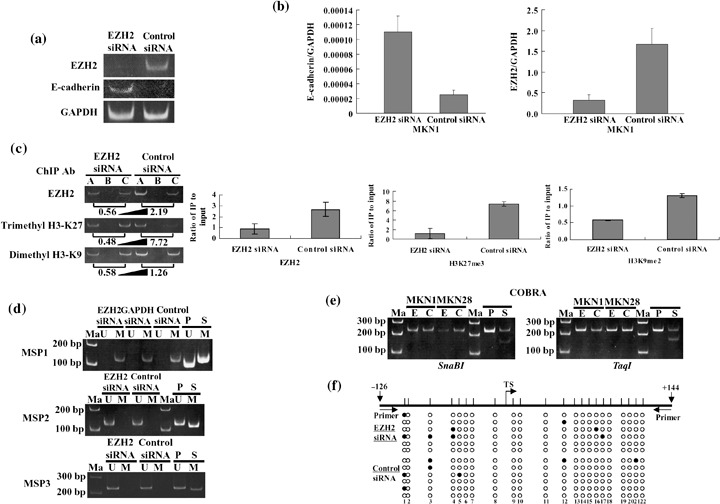
Restoration of E‐cadherin mRNA in MKN1 gastric cancer cell line after knockdown of enhancer of zeste homolog 2 (EZH2) accompanied by chromatin remodeling without DNA methylation in the promoter region of the E‐cadherin gene. (a) Restoration of E‐cadherin mRNA analyzed by reverse transcription–polymerase chain reaction (RT‐PCR) in MKN1 cells was visualized with 6% polyacrylamide gel electrophoresis. GAPDH, glyceraldehyde‐3‐phosphate dehydrogenase; siRNA, short interfering RNA. (b) The restored expression level of E‐cadherin mRNA was quantified by real‐time RT‐PCR. (c) Chromatin immunoprecipitation (ChIP) assay was carried out using DNA–protein complex isolated from MKN1 cells transfected with EZH2 siRNA for 96 h and immunoprecipitated (IP) with various antibodies. The PCR product of each IP DNA and input DNA was visualized with 6% polyacrylamide gel electrophoresis. The number under each gel is the ratio of IP DNA versus input DNA quantified. A, antibody; B, no antibody; C, input. Individual ChIP assays were repeated at least twice to confirm the reproducibility of the PCR‐based experiment. The results of ChIP assays are shown as a diagram for each antibody and statistical analyses (student's t‐test) were carried out (H3K27me3; H3‐Lys‐27 trimethylation, H3K9me2; H3‐Lys‐9 dimethylation). (d) Methylation‐specific polymerase chain reaction analyses from the DNA of MKN1 cells transfected with EZH2 siRNA (e) or negative control siRNA (c), using primer sets that specifically amplify either unmethylated (U) or methylated (M). Control templates from human genomic placenta DNA, treated with SssI methylase (S) or untreated (P), are shown. Ma, 100 bp DNA ladder marker. (e) Combined bisulfite restriction analysis (COBRA) from the DNA of MKN1 and MKN28 cells transfected with EZH2 siRNA (E) or negative control siRNA (C), using primer sets for the E‐cadherin gene. MKN28 was a positive control for E‐cadherin expression. PCR products were digested with specific restriction enzymes including SnaBI or TaqI. (f) Bisulfite sequencing of the E‐cadherin CpG island. Top, map of the CpG island. Twenty‐two individual CpG dinucleotides are indicated as vertical lines. Primer, location of bisulfite sequencing primers. Numbers indicate positions relative to transcription start. TS, transcriptional start. Bottom, each circle indicates a CpG site in the primary sequence, and each line of circles represents analysis of a single cloned allele. Black circles, methylated CpG sites; white circles, unmethylated CpG sites.
Next, we examined whether the status of DNA methylation in the E‐cadherin promoter region changed after knockdown of EZH2 and resulted in the restoration of E‐cadherin gene expression. The status of DNA methylation in the E‐cadherin promoter region did not change by MSP analysis, using three primer sets (Fig. 2d). COBRA in the promoter region of the E‐cadherin gene using two kinds of methylation‐sensitive enzyme was carried out to examine whether the status of DNA methylation in the E‐cadherin promoter region changed after knockdown of EZH2 (Fig. 2e). The CpG sites in the E‐cadherin promoter region in COBRA did not show hypermethylated status before or after transfection with EZH2 siRNA in MKN1 cells. MKN28 was a positive control for expression of E‐cadherin.( 36 ) The status of DNA methylation in the E‐cadherin promoter region about more than five loci of CpG in MKN1 cells did not show any change before or after knockdown of EZH2. To further investigate the status of DNA methylation in the E‐cadherin promoter region and to examine the relationship between the methylation density and E‐cadherin expression after knockdown of EZH2, genomic bisulfite sequencing was carried out on MKN1 cells after transfection with EZH2 siRNA or control siRNA. Both cells showed some isolated‐methylated CpG sites and did not hypermethylated status in the promoter region of the E‐cadherin gene (Fig. 2f).
That is, in the present study, the DNA methylation status of the promoter region did not coincide with the transcriptional level of the E‐cadherin gene as previously reported.( 18 ) This suggests histone modification through EZH2, in addition to DNA hypermethylation in the promoter region, might also play a role in the regulation of E‐cadherin expression in MKN1 cells.
Knockdown of EZH2 induced E‐cadherin protein expression in gastric cancer cells. To determine if EZH2 down‐regulates E‐cadherin protein and loses the homeotypical cell adhesion, we analyzed whether the decrease in EZH2 protein levels restores E‐cadherin protein using immunofluorescence. Following the knockdown of EZH2 by siRNA transfection, E‐cadherin protein in the MKN1 cells, which has no gross genetic alterations on the β‐catenin gene,( 36 ) was significantly upregulated in Western blot analysis (Fig. 3a). Additionally, immunofluorescence staining confirmed the expression of E‐cadherin protein present in the cell membrane was restored (Fig. 3b). The pattern of β‐catenin was also found to be altered following EZH2 knockdown, with the general nuclear and cytoplasmic staining of the non‐transfected cells being replaced with a tight membranous pattern in those cells that showed no EZH2 expression by knockdown with siRNA (Fig. 3b). This suggests EZH2 overexpression downregulates E‐cadherin, resulting in a change in the localization of E‐cadherin and β‐catenin from their usual membrane‐bound location. In other words, it is suggested that downregulation of E‐cadherin by EZH2 overexpression translocates β‐catenin to the nucleus from its usual membrane‐bound location.
Figure 3.
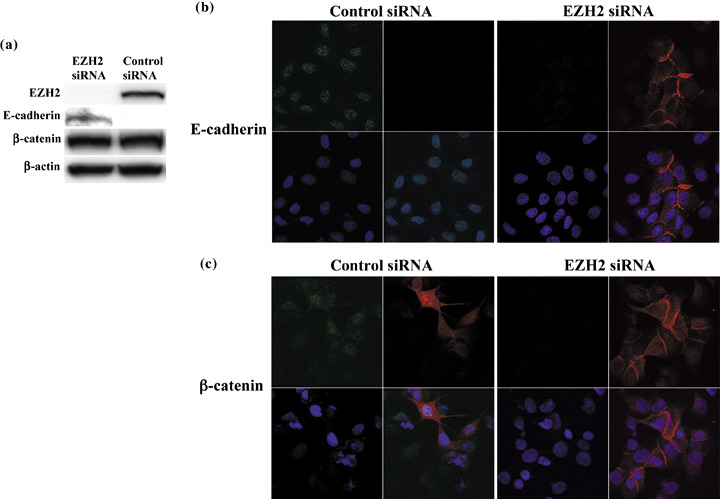
Knockdown of enhancer of zeste homolog 2 (EZH2) restores E‐cadherin expression and induces the membranous translocation of β‐catenin from the nucleus. (a) The re‐expression of E‐cadherin was also detected by Western blot analysis, without changing β‐catenin expression after EZH2 knockdown. (b) Human gastric cancer MKN1 cells transfected with EZH2 short interfering RNA (siRNA) show the restoration and membranous distribution of E‐cadherin (E‐cadherin, red; EZH2, green). (c) MKN1 cells transfected with EZH2 siRNA showed the translocation of β‐catenin from the nucleus to the membrane (β‐catenin, red; EZH2, green).
Invasive capacity decreased by EZH2 knockdown. Loss of E‐cadherin is thought to be critically involved in the processes of tumor cell invasion and metastasis. Because EZH2 downregulates E‐cadherin expression, we tested the effects of EZH2 on gastric cancer cell invasion. We used a cell invasion assay to examine the invasive potential of EZH2 siRNA‐treated cells. EZH2 siRNA‐treated cells showed a lower level of penetration through the polycarbonate membrane compared to control cells. The value of fluorescence from the invaded gastric cancer cells significantly decreased by approximately 0.7‐fold compared to control cells (student's t‐test, P < 0.05) (Fig. 4a). The differing invasive capacity between the cells with knockdown of EZH2 and control cells appears to be small, however, the results were reproducible in gastric cancer cells.
Figure 4.
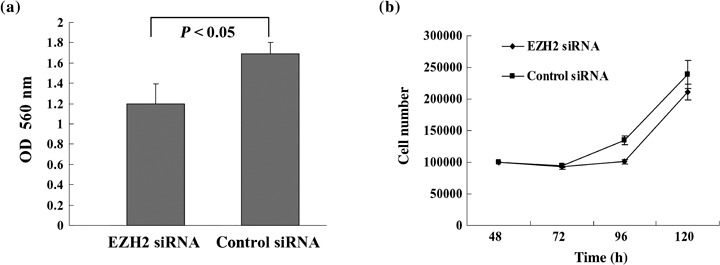
Effect of E‐cadherin restored by the knockdown of enhancer of zeste homolog 2 (EZH2) on the invasive capacity of human gastric cancer MKN1 cells. (a) The invading cells were quantitated by dissolving stained cells with colorimetric reading of the optical density (OD) at 560 nm. (b) Forty‐eight hours after transfection with EZH2 short interfering RNA (siRNA) or control siRNA, cells were re‐seeded in new dishes at a concentration of 1.0 × 10⁵ cells, then enumerated. Bars, SD; points, mean of three independent experiments.
We examined the growth inhibitory effect of EZH2 siRNA in the MKN1 gastric cancer cell line. Forty‐eight hours after transfection with EZH2 siRNA or control siRNA, the cells were re‐seeded in new plates and observed for cell growth. As shown in Fig. 4(b), the cell growth started 24 h after re‐seeding (at the point of 72 h after transfection). Because of the transient effect of siRNA for EZH2 in MKN1 cells, there was no significant difference in cell growth between the EZH2 siRNA‐treated cells and the control cells (Fig. 4b). However, knockdown of EZH2 caused slight growth arrest at 96 h. Previous reports showed that depletion of EZH2 results in growth arrest in breast and prostate cancer cells.( 27 , 28 ) These results suggest EZH2 could play a critical role in invasive capacity by mediating both inhibition of growth arrest and loss of functional cell adhesion in gastric cancer cells.
EZH2 overexpression correlates with loss of E‐cadherin in gastric adenocarcinoma tissue. As EZH2 overexpression correlates with loss of E‐cadherin in the MKN1 gastric cancer cell line, whether such a correlation exists in gastric cancer tissue was determined to support the correlation in a clinicopathologically relevant context by immunohistochemical staining (Fig. 5a–c). To assess the existence of the silencing pathway of E‐cadherin by EZH2 in vivo, except the silencing pathway by way of point mutations in the E‐cadherin gene, only gastric adenocarcinomas with an intestinal phenotype, widely reported not to have any point mutations in the E‐cadherin gene, were used.( 9 ) Indeed, EZH2 overexpression was associated with loss of E‐cadherin. Tumors with no discernible or low EZH2 expression were predominantly associated with the membranous expression of E‐cadherin protein (97.9%), whereas half of the tumors with high EZH2 expression had a reduction in E‐cadherin expression (50.7%). In contrast, loss of E‐cadherin expression was seen in only 2.1% of tumors with low or no discernible EZH2 expression. The correlation between EZH2 and E‐cadherin expression is statistically significant (χ2‐test; P < 0.0001) (Fig. 5d). These results could indicate that the above observed effects are not limited to cultured cells, but also extend to the in vivo situation.
Figure 5.
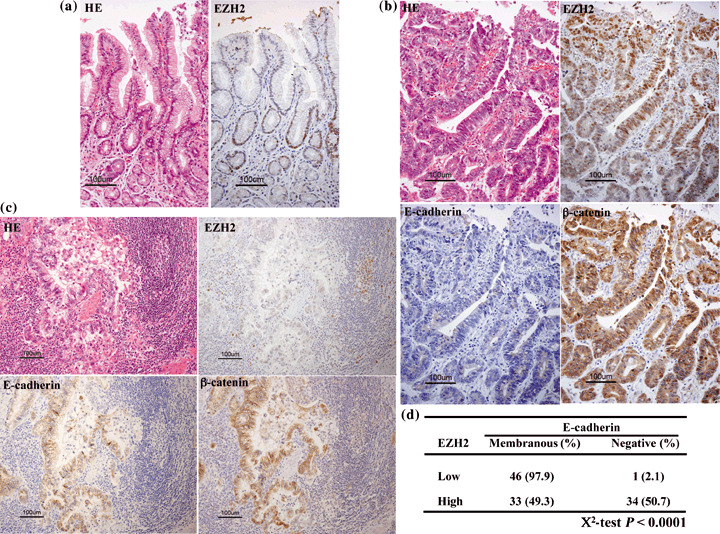
Correlation between enhancer of zeste homolog 2 (EZH2) expression, expression of E‐cadherin, and the localization of β‐catenin in gastric cancer tissues. The expression of these proteins was evaluated by immunohistochemistry using 114 human gastric adenocarcinomas. (a) EZH2 is normally expressed in the neck region, the proliferative zone for gastric mucosa. HE, hematoylin–eosin. (b) High expression of EZH2 correlated with loss of E‐cadherin expression and nuclear and cytoplasmic localization of β‐catenin. (c) No expression of EZH2 correlated with membranous localization of E‐cadherin or β‐catenin. Lymphoblasts served as appropriate positive controls for EZH2. (d) The relationship between EZH2 expression and negative or membranous localization of E‐cadherin expression in 114 gastric cancer tissues (χ2‐test, P < 0.0001). Bar, 100 µm (a–c).
Discussion
Although human EZH2–EED complex has been shown to be histone methyltransferase,( 37 ) its substrate specificity remains unclear. For example, it has been proposed by some that EZH2 methylates the only Lys27 in histone H3,( 21 , 23 ) although others indicated that EZH2 can also methylate the Lys9 in histone H3.( 20 , 22 ) Histone H3 methylation at Lys9 was previously shown to be linked to DNA methylation;( 38 , 39 , 40 ) however, the relationship between histone H3 methylation at K27 (H3‐meK27) and DNA methylation is still unclear. In a recent report, removal of histone H3 methylation at Lys27 in an ovarian cancer cell line by overexpressing a dominant negative histone transgene incapable of being methylated (due to an Arg‐for‐Lys mutation, referred to as H3‐K27R cells), silenced several tumor suppressor genes in ovarian cancer, including hMLH1 and RASSF1, and were upregulated compared with the parental cells.( 41 ) The RASSF1 promoter was bound by methyl CpG‐binding protein‐2 in the parental cells, however, neither H3‐trimethyl‐K27 nor CpG‐binding protein‐2 was detected in the H3‐K27R cells, suggesting the RASSF1 promoter is regulated by methylation of H3‐K27.( 41 ) Furthermore, the hypermethylation status at an upstream CpG island in the promoter of the RASSF1 gene was shown to be similar between H3‐K27R and parental cells, suggesting that the chromatin environment is more permissive for increased transcription.( 41 ) In the present study, decreased H3‐trimethyl‐K27 protein was observed in gastric cancer cells after EZH2 siRNA transfection, as previously reported.( 29 ) Furthermore, our present results showed that restoration of the E‐cadherin gene was accompanied with histone modification, including histone H3 methylation, and not with the changing of DNA methylation status in the promoter region, similar to the above‐mentioned RASSF1 results.( 41 ) Our results also suggest a chromatin environment, including histone methylation, is a key regulator for silencing tumor suppressor genes. For the promoter of the E‐cadherin gene, it has been reported that histone H3 Lys9 was methylated in all silenced cell lines, even in the cell line where the CpG island was methylation‐free.( 18 ) This suggests that not only DNA methylation, but also multiple pathways for the formation of inactive chromatin, regulate E‐cadherin gene transcription. Although histone H3 Lys9 methylation is known to be linked to DNA methylation, the above fact suggests the presence of other chromatin modifiers. Our results also showed that EZH2 could be a candidate of chromatin modifiers for the E‐cadherin gene.
Overexpression of EZH2 was observed in epithelial cell‐derived tumors including prostate, breast, endometrium, and bladder carcinomas with a relationship with aggressiveness and poor outcome.( 27 , 41 , 42 , 43 , 44 ) Recently, it has been found that overexpression of EZH2 in breast epithelial cells represses genes, including RAD51, that function in the homologous recombination pathway of DNA repair, the dysregulation of which might cause aneuploidy and malignant transformation.( 45 ) In the present study, we showed that EZH2 downregulated E‐cadherin expression, causing upregulation of the invasive capacity of gastric cancer cells. In vivo, the inverse relationship of expression between EZH2 protein and E‐cadherin protein was observed at the level of individual cells in gastric cancer tissues immunohistochemically. From these results it is postulated the EZH2 protein upregulation caused transcriptional repression of tumor suppressor genes, necessary for maintaining cell homeostasis in the neoplastic processes. Further study to explore the mechanism of EZH2 overexpression in gastric mucosa will be necessary by analyzing clinicopathological details, especially inflammatory factors (e.g., background gastritis, Helicobacter pylori infection, or Epstein–Barr virus infection).
In this study, we found an inverse correlation between EZH2 and E‐cadherin gene expression in gastric cancer cells. Knockdown of EZH2 by siRNA in gastric cancer cells resulted in a restoration of the E‐cadherin gene. These data prompted us to investigate the mechanism behind EZH2 modulation of E‐cadherin in gastric cancer cells. We showed that the EZH2 complex existed with histone H3 and Lys27, both methylated on E‐cadherin promoter regions in gastric cancer cells. The restoration of E‐cadherin was not involved in the change of DNA methylation status in the E‐cadherin promoter region. Simultaneously, we showed that restoration of E‐cadherin after knockdown of EZH2 changes the localization of β‐catenin from nucleus to membrane in gastric cancer cells, resulting in the downregulation of the invasive capacity of gastric cancer cells. In vivo, we found an inverse correlation between EZH2 and E‐cadherin protein in gastric cancer tissue by immunohistochemical analysis. Recently, high expression of EZH2 by immunohistochemical staining was reported to be correlated with poor prognosis in gastric cancer.( 46 ) The outcome of this study provides an underlying mechanism of the functional role of EZH2 overexpression in gastric cancer cells and a new modality of regulation of E‐cadherin expression in silencing mechanisms of tumor suppressor genes.
This is the first report showing the functional significance of EZH2 overexpression in gastric cancer cells both in vitro and in vivo. Our present study paves the way for exploring the blockade of EZH2 overexpression as a novel approach for the treatment of gastric cancer.
Supporting information
Fig. S1. Restoration of E‐cadherin expression in human gastric cancer cell line MKN1 after treatment with 5‐aza‐2′‐deoxycytidine (5‐aza‐dC), trichostatin A (TSA), or a combination of 5‐aza‐dC and TSA. E‐cadherin mRNA expression was evaluated by quantitative real‐time reverse transcription–polymerase chain reaction. The concentrations of 5‐aza‐dC and TSA were 1 µM. A + T, combination of 5‐aza‐dC and TSA; vehicle, no treatment control.
Please note: Blackwell Publishing are not responsible for the content or functionality of any supplementary materials supplied by the authors. Any queries (other than missing material) should be directed to the corresponding author for the article.
Supporting info item
Acknowledgments
The authors wish to thank Dr Wataru Yasui, Dr Kazuyoshi Yanagihara, and Dr Takeshi Azuma for kindly providing the gastric cancer cell lines. We wish to thank Miss Mai Okumoto for her technical assistance. We also thank Dr Katsuya Tsuchihara for his critical review of this article. This work was supported by a grant to S.F from the Ministry of Education, Culture, Sports, Science, and Technology, Japan (19590417).
References
- 1. Takeichi M. Cadherins: a molecular family important in selective cell–cell adhesion. Annu Rev Biochem 1990; 59: 237–52. [DOI] [PubMed] [Google Scholar]
- 2. Takeichi M. Cadherin cell adhesion receptors as a morphogenetic regulator. Science 1991; 251: 1451–5. [DOI] [PubMed] [Google Scholar]
- 3. Grunwald GB. The structural and functional analysis of cadherin calcium‐dependent cell adhesion molecules. Curr Opin Cell Biol 1993; 5: 797–805. [DOI] [PubMed] [Google Scholar]
- 4. Hirohashi S. Inactivation of the E‐cadherin‐mediated cell adhesion system in human cancers. Am J Pathol 1998; 153: 333–9. [DOI] [PMC free article] [PubMed] [Google Scholar]
- 5. Pignatelli M, Vessey CJ. Adhesion molecules: novel molecular tools in tumor pathology. Hum Pathol 1994; 25: 849–56. [DOI] [PubMed] [Google Scholar]
- 6. Hashimoto M, Niwa O, Nitta Y, Takeichi M, Yokoro K. Unstable expression of E‐cadherin adhesion molecules in metastatic ovarian tumor cells. Jpn J Cancer Res 1989; 80: 459–63. [DOI] [PMC free article] [PubMed] [Google Scholar]
- 7. Bussemakers MJ, Van Moorselaar RJ, Giroldi LA et al . Decreased expression of E‐cadherin in the progression of rat prostatic cancer. Cancer Res 1992; 52: 2916–22. [PubMed] [Google Scholar]
- 8. Guilford P, Hopkins J, Harraway J et al . E‐cadherin germline mutations in familial gastric cancer. Nature 1998; 392: 402–5. [DOI] [PubMed] [Google Scholar]
- 9. Ushijima T, Sasako M. Focus on gastric cancer. Cancer Cell 2004; 5: 121–5. [DOI] [PubMed] [Google Scholar]
- 10. Yoshiura K, Kanai Y, Ochiai A et al . Silencing of the E‐cadherin invasion‐suppressor gene by CpG methylation in human carcinomas. Proc Natl Acad Sci USA 1995; 92: 7416–9. [DOI] [PMC free article] [PubMed] [Google Scholar]
- 11. Kudson AG. Antioncogenes and human cancer. Proc Natl Acad Sci USA 1993; 90: 10914–21. [DOI] [PMC free article] [PubMed] [Google Scholar]
- 12. Becker KF, Atkinson MJ, Reich U et al . E‐cadherin gene mutations provide clues to diffuse type gastric carcinomas. Cancer Res 1994; 54: 3845–52. [PubMed] [Google Scholar]
- 13. Machado JC, Soares P, Carneiro F et al . E‐cadherin gene mutations provide a genetic basis for the phenotypic divergence of mixed gastric carcinomas. Lab Invest 1999; 79: 459–65. [PubMed] [Google Scholar]
- 14. Machado JC, Oliveira C, Carvalho R et al . E‐cadherin gene (CDH1) promoter methylation as the second hit in sporadic diffuse gastric carcinoma. Oncogene 2001; 20: 1525–8. [DOI] [PubMed] [Google Scholar]
- 15. Ascano JJ, Frierson H Jr, Moskaluk CA et al . Inactivation of the E‐cadherin gene in sporadic diffuse‐type gastric cancer. Mod Pathol 2001; 14: 942–9. [DOI] [PubMed] [Google Scholar]
- 16. Li LC, Chui RM, Sasaki M et al . A single nucleotide polymorphism in the E‐cadherin gene promoter alters transcriptional activities. Cancer Res 2000; 60: 873–6. [PubMed] [Google Scholar]
- 17. Liu YC, Shen CY, Wu HS et al . Mechanisms inactivating the gene for E‐cadherin in sporadic gastric carcinomas. World J Gastroenterol 2006; 12: 2168–73. [DOI] [PMC free article] [PubMed] [Google Scholar]
- 18. Koizume S, Tachibana K, Sekiya T, Hirohashi S, Shiraishi M. Heterogeneity in the modification and involvement of chromatin components of the CpG island of the silenced human CDH1 gene in cancer cells. Nucleic Acids Res 2002; 30: 4770–80. [DOI] [PMC free article] [PubMed] [Google Scholar]
- 19. Laible G, Wolf A, Dorn R et al . Mammalian homologues of the polycomb‐group gene enhancer of zeste mediate gene silencing in Drosophila heterochromatin and at S. cerevisiae telomeres. EMBO J 1997; 16: 3219–32. [DOI] [PMC free article] [PubMed] [Google Scholar]
- 20. Kuzmichev A, Nishioka K, Erdjument‐Bromage H, Tempst P, Reinberg D. Histone methyltransferase activity associated with a human multiprotein complex containing the Enhancer of Zeste protein. Genes Dev 2002; 16: 2893–905. [DOI] [PMC free article] [PubMed] [Google Scholar]
- 21. Cao R, Wang L, Wang H et al . Role of histone H3 lysine 27 methylation in Polycomb‐group silencing. Science 2002; 298: 1039–43. [DOI] [PubMed] [Google Scholar]
- 22. Czermin B, Melfi R, McCabe D et al . Drosophila enhancer of Zeste/ESC complexes have a histone H3 methyltransferase activity that marks chromosomal Polycomb sites. Cell 2002; 111: 185–96. [DOI] [PubMed] [Google Scholar]
- 23. Muller J, Hart CM, Francis NJ et al . Histone methyltransferase activity of a Drosophila Polycomb group repressor complex. Cell 2002; 111: 197–208. [DOI] [PubMed] [Google Scholar]
- 24. Cao R, Zhang Y. SUZ12 is required for both the histone methyltransferase activity and the silencing function of the EED–EZH2 complex. Mol Cell 2004; 15: 57–67. [DOI] [PubMed] [Google Scholar]
- 25. Van Kemenade FJ, Raaphorst FM, Blokzijl T et al . Coexpression of BMI‐1 and EZH2 polycomb‐group proteins is associated with cycling cells and degree of malignancy in B‐cell non‐Hodgkin lymphoma. Blood 2001; 97: 3896–901. [DOI] [PubMed] [Google Scholar]
- 26. Raaphorst FM, Van Kemenade FJ, Blokzijl T et al . Coexpression of BMI‐1 and EZH2 polycomb group genes in Reed–Sternberg cells of Hodgkin's disease. Am J Pathol 2000; 157: 709–15. [DOI] [PMC free article] [PubMed] [Google Scholar]
- 27. Varambally S, Dhanasekaran SM, Zhou M et al . The polycomb group protein EZH2 is involved in progression of prostate cancer. Nature 2002; 419: 624–9. [DOI] [PubMed] [Google Scholar]
- 28. Kleer CG, Cao Q, Varambally S et al . EZH2 is a marker of aggressive breast cancer and promotes neoplastic transformation of breast epithelial cells. Proc Natl Acad Sci USA 2003; 100: 11606–11. [DOI] [PMC free article] [PubMed] [Google Scholar]
- 29. Vire E, Brenner C, Deplus R et al . The Polycomb group protein EZH2 directly controls DNA methylation. Nature 2006; 439: 871–4. [DOI] [PubMed] [Google Scholar]
- 30. Fujii S, Luo RZ, Yuan J et al . Reactivation of the silenced and imprinted alleles of ARHI is associated with increased histone H3 acetylation and decreased histone H3 lysine 9 methylation. Hum Mol Genet 2003; 12: 1791–800. [DOI] [PubMed] [Google Scholar]
- 31. Herman JG, Graff JR, Myohanen S, Nelkin BD, Baylin SB. Methylation‐specific PCR: a novel PCR assay for methylation status of CpG islands. Proc Natl Acad Sci USA 1996; 93: 9821–6. [DOI] [PMC free article] [PubMed] [Google Scholar]
- 32. House MG, Guo M, Iacobuzio‐Donahue C, Herman JG. Molecular progression of promoter methylation in intraductal papillary mucinous neoplasms (IPMN) of the pancreas. Carcinogenesis 2003; 24: 193–8. [DOI] [PubMed] [Google Scholar]
- 33. Tamura G, Yin J, Wang S et al . E‐cadherin gene promoter hypermethylation in primary human gastric carcinomas. J Natl Cancer Inst 2000; 92: 569–73. [DOI] [PubMed] [Google Scholar]
- 34. Suzuki H, Itoh F, Toyota M et al . Distinct methylation pattern and microsatellite instability in sporadic gastric cancer. Int J Cancer 1999; 83: 309–13. [DOI] [PubMed] [Google Scholar]
- 35. Corn PG, Smith BD, Ruckdeschel ES, Douglas D, Baylin SB, Herman JG. E‐cadherin expression is silenced by 5′‐CpG island methylation in acute leukemia. Clin Cancer Res 2000; 6: 4243–8. [PubMed] [Google Scholar]
- 36. Yokozaki H. Molecular characteristics of eight gastric cancer cell lines established in Japan (Review). Pathol Int 2000; 50: 767–77. [DOI] [PubMed] [Google Scholar]
- 37. Cao R, Zhang Y. The functions of E(Z)/EZH2‐mediated methylation of lysine 27 in histone H3 (Review). Curr Opin Genet Dev 2004; 14: 155–64. [DOI] [PubMed] [Google Scholar]
- 38. Lehnertz B, Ueda Y, Derijck AA et al . Suv39h‐mediated histone H3 lysine 9 methylation directs DNA methylation to major satellite repeats at pericentric heterochromatin. Curr Biol 2003; 13: 1192–200. [DOI] [PubMed] [Google Scholar]
- 39. Tamaru H, Selker EU. A histone H3 methyltransferase controls DNA methylation in Neurospora crassa . Nature 2001; 414: 277–83. [DOI] [PubMed] [Google Scholar]
- 40. Xin Z, Tachibana M, Guggiari M et al . Role of histone methyltransferase G9a in CpG methylation of the Prader–Willi syndrome imprinting center. J Biol Chem 2003; 278: 14996–5000. [DOI] [PubMed] [Google Scholar]
- 41. Abbosh PH, Montgomery JS, Starkey JA et al . Dominant‐negative histone H3 lysine 27 mutant derepresses silenced tumor suppressor genes and reverses the drug‐resistant phenotype in cancer cells. Cancer Res 2006; 66: 5582–91. [DOI] [PubMed] [Google Scholar]
- 42. Collett K, Eide GE, Arnes J et al . Expression of enhancer of zeste homologue 2 is significantly associated with increased tumor cell proliferation and is a marker of aggressive breast cancer. Clin Cancer Res 2006; 12: 1168–74. [DOI] [PubMed] [Google Scholar]
- 43. Bachmann IM, Halvorsen OJ, Collett K et al . EZH2 expression is associated with high proliferation rate and aggressive tumor subgroups in cutaneous melanoma and cancers of the endometrium, prostate, and breast. J Clin Oncol 2006; 24: 268–73. [DOI] [PubMed] [Google Scholar]
- 44. Raman JD, Mongan NP, Tickoo SK et al . Increased expression of the polycomb group gene, EZH2, in transitional cell carcinoma of the bladder. Clin Cancer Res 2005; 11: 8570–6. [DOI] [PubMed] [Google Scholar]
- 45. Zeidler M, Varambally S, Cao Q et al . The Polycomb group protein EZH2 impairs DNA repair in breast epithelial cells. Neoplasia 2005; 7: 1011–9. [DOI] [PMC free article] [PubMed] [Google Scholar]
- 46. Matsukawa Y, Semba S, Kato H, Ito A, Yanagihara K, Yokozaki H. Expression of the enhancer of zeste homolog 2 is correlated with poor prognosis in human gastric cancer. Cancer Sci 2006; 97: 484–91. [DOI] [PMC free article] [PubMed] [Google Scholar]
Associated Data
This section collects any data citations, data availability statements, or supplementary materials included in this article.
Supplementary Materials
Fig. S1. Restoration of E‐cadherin expression in human gastric cancer cell line MKN1 after treatment with 5‐aza‐2′‐deoxycytidine (5‐aza‐dC), trichostatin A (TSA), or a combination of 5‐aza‐dC and TSA. E‐cadherin mRNA expression was evaluated by quantitative real‐time reverse transcription–polymerase chain reaction. The concentrations of 5‐aza‐dC and TSA were 1 µM. A + T, combination of 5‐aza‐dC and TSA; vehicle, no treatment control.
Please note: Blackwell Publishing are not responsible for the content or functionality of any supplementary materials supplied by the authors. Any queries (other than missing material) should be directed to the corresponding author for the article.
Supporting info item