Abstract
Primary effusion lymphoma (PEL) is a refractory malignancy caused by human herpes virus 8 (HHV‐8) in immunocompromised individuals. The tumor cells of PEL are characterized by constitutive NF‐κB activation. Dehydroxymethylepoxyquinomicin (DHMEQ) is a new NF‐κB inhibitor and is effective on various tumor cells with constitutively activated NF‐κB. Thus, in search for a new therapeutic modality of PEL, we examined the effect of DHMEQ on PEL cells. We confirmed constitutive activation of NF‐κB with subcomponents of p50 and p65 in PEL cell lines. DHMEQ quickly and transiently abrogated NF‐κB activation and reduced the cell viability in dose‐ and time‐dependent manners, inducing apoptosis through activation of both mitochondrial and membrane pathways. Array analysis revealed that DHMEQ down‐regulated expression levels of NF‐κB target genes, such as interleukin‐6 (IL6), Myc, chemokine (C‐C motif) receptor 5 (CCR5) and NF‐κB1, whereas it up‐regulated expression levels of some genes involved in apoptosis, and cell cycle arrest. DHMEQ did not reactivate HHV‐8 lytic genes, indicating that NF‐κB inhibition by DHMEQ did not induce virus replication. DHEMQ rescued CB‐17 SCID mice xenografted with PEL cells, reducing the gross appearance of effusion. Thus, DHMEQ transiently abrogated the NF‐κB activation, irreversibly triggering the apoptosis cascade without HHV‐8 reactivation. In addition, DHMEQ could rescue the PEL‐xenograft mice. Therefore, we suggest DHMEQ as a promising candidate for molecular target therapy of the PEL. (Cancer Sci 2009; 100: 737–746)
Primary effusion lymphoma (PEL) is a non‐Hodgkin B‐cell lymphoma usually associated with immunocompromised patients such as those with aquired immune defficiency syndrome (AIDS).( 1 , 2 ) Despite extensive use of highly active antiretroviral treatment (HAART) and improvement of chemotherapy management in human immunodeficiency virus (HIV)‐infected patients, the prognosis of patients with HIV‐related PEL remains poor. The median survival does not exceed 6 months even in the most recent series.( 3 ) The tumor cells have an intermediate immunophenotype but B‐cell genotyping shows clonal rearrangements of immunoglobulin genes.( 4 )
Human herpes virus 8 (HHV‐8) is essential for the development of PEL that is universally associated with HHV‐8. Most of the PELs are also infected with Epstein–Barr virus (EBV) and the combination of the two viruses might promote full transformation. Tumor cells in PELs are latently infected by HHV‐8 and express latent proteins, while a few cells undergo lytic replication. HHV‐8 encodes numerous proteins homologous to critical cell cycle regulatory and apoptosis proteins, cellular receptors and their ligands. However, because of their unique properties they can escape normal regulatory pathways and hence behave differently from their cellular counterparts. Among these genes, v‐cyclin, LANA, and v‐IRF1 interfere with the cell cycle deregulation, while v‐FLIP prevents apoptosis.( 5 ) PELs have constitutively active nuclear factor (NF)‐κB, due to v‐FLIP expression, which is essential for their survival.( 6 , 7 , 8 , 9 , 10 ) In addition to v‐FLIP, HHV‐8 proteins K1, K15, and the viral G protein‐coupled receptor (v‐GPCR) induce NF‐κB activity, thereby supporting the central role of NF‐κB signaling in HHV‐8 pathogenesis.( 5 )
NF‐κB has been implicated in inflammation, cell proliferation, differentiation, apoptosis and cell survival. NF‐κB is a ubiquitously expressed family of five proteins; p65 (RelA), p50, p52, c‐Rel and RelB. Different combinations of these NF‐κB subunits are considered to specify target genes under different conditions.( 11 , 12 )
Dehydroxymethylepoxyquinomicin (DHMEQ) is an NF‐κB inhibitor, based on the structure of antibiotic epoxyquinomicin C.( 13 ) DHMEQ inhibits the tumor necrosis factor (TNF)‐α‐induced NF‐κB binding activity but not the phosphorylation or degradation of I‐κB. DHMEQ inhibited the TNF‐α‐induced nuclear accumulation of p65. Thus, DHMEQ is a unique inhibitor of NF‐κB that acts at the level of the nuclear translocation.( 14 ) DHMEQ has been reported to be effective on various hematologic and solid malignancies with constitutively active NF‐κB.( 15 , 16 , 17 , 18 , 19 , 20 , 21 )
Therefore, in search for a new modality of PEL therapy based on the idea of molecular targeting, we examined effects of DHMEQ on PEL cells in vitro and in vivo. Our data demonstrated that DHMEQ could abrogate the NF‐κB activation transiently and initiate the apoptosis cascade irreversibly without activation of HHV‐8 replication. In addition, DHMEQ rescued the PEL xenograft mice. Taken together, we suggest DHMEQ as a promising candidate for molecular target therapy of the PEL.
Materials and Methods
Cell culture. PEL cell lines used for experiments are BCBL1, TY1 and BC1 infected with HHV‐8.( 22 , 23 ) BC1 was also infected by EBV. Jurkat and K562 cells were obtained from the Japanese Cancer Research Resources Bank (Tokyo, Japan). These cell lines were cultured in RPMI 1640 medium (Gibco, Carlsbad, CA, USA) supplemented with 10% fetal bovine serum (FBS) (Bio West, Miami, FL, USA) and antibiotics (penicillin/streptomycin, Gibco), except for BC1 and TY1 cells that were cultured with 20% FBS.
Electrophoretic mobility shift assays (EMSAs) and supershift analysis. For detecting NF‐κB binding, we used an NF‐κB consensus oligonucleotide (Promega Corporation, Madison, WI, USA).( 24 ) Nuclear extracts were prepared basically as described.( 23 ) DNA‐protein complexes were analyzed as previously described.( 25 ) The supershift analysis was performed as described previously, using antibodies against p65, p50, p52, c‐Rel, and Rel‐B (all from Santa Cruz Biotechnology, Santa Cruz, CA, USA), or a control mouse immunoglobulin G.( 26 )
Assessment of cell viability and apoptosis. Cell viability was determined by color reaction with WST‐8. Cell Counting Kit‐8 (Dojindo, Kumamoto, Japan), and Annexin V reactivity was examined by Annexin V using Apopcyto Annexin V‐Azami‐Green Apoptosis detection kit (MBL, Nagoya, Japan) according to the manufacture's protocols. Terminal deoxynucleotidyl transferase‐mediated dUTP nick‐end labeling (TUNEL) assay was performed using DeadEnd Fluorometric TUNEL System (Promega Corporation) kit and protocols. The results for both tests were analyzed using FACSCalibur machine and CellQuest software (BD Biosciences, San Jose, CA, US). Cell cycle analysis was done as described previously,( 15 ) at 6 h after DHMEQ treatment. The resulting DNA histograms were interpreted using the FlowJo (Tree Star Inc., Ashland, OR, US) combined with the Watson Pragmatic model.
Caspase activity detection. Activation of caspases‐3, ‐8, and ‐9 were assessed by Carboxyfluorescein FLICA Apoptosis Detection Kit (Immunochemistry Technologies, Bloomington, MN, USA) according to the manufacturer's instructions. Cleavage of the caspases was confirmed by detection of cleaved products by immunoblot analysis using antibodies specific to cleaved products of caspase 3 and 9, or reactive to both cleaved and uncleaved caspase‐8. The antibodies used are: cleaved caspase‐3 (Asp175) antibody, caspase‐8 (1C12) mouse mAb, and cleaved caspase‐9 (Asp330) antibody (human‐specific; all form Cell Signaling Technology, Beverly, MA, USA). Immunoblotting analysis was done basically as described previously.( 18 )
Microarray experiment. Total RNA was extracted from BC1 and BCBL1 cells treated with or without DHMEQ (10 µg/mL) for 6 h, using Trizol. Whole Human Genome Oligo Microarray Kit (Agilent Technologies, Santa Clara, CA, USA) was used to evaluate the gene expression in PEL cell lines according to the manufacturer's protocols. Whole data analyses were conducted using the software GeneSpring (Agilent Technologies). First, Student t‐tests were performed in order to extract genes with expression levels significantly different between samples with and without DHMEQ treatment (P < 0.01). Secondly, gene ontology analyses were performed on that group of genes in BC1 in order to categorize the selected genes at the significant levels of P < 0.01.
Reverse transcription–polymerase chain reaction (RT‐PCR) and real‐time RT‐PCR. Total RNA was extracted from the cells using the ISOGEN Kit (Wako Chemical Industry, Osaka, Japan). First‐strand cDNAs were synthesized using 2 µg of the total RNA and 500 ng Oligo (dT)12–18 using SuperScriptTM II RT (Invitrogen Japan, Tokyo, Japan). RT‐PCR was done for 25 cycles by Gene Taq enzyme (Wako Chemical Industries) with 10 pmoles of HHV‐8 gene‐specific primers. PCR products were analyzed by agarose gel electrophoresis and ethidium bromide staining. The primers for ORFK13 (v‐FLIP), ORF72 (v‐cyclin), ORF73 (LANA), ORF50 (Rta), ORFK9 (v‐IRF) and ORF74 (v‐GPCR) are the same as those used in the previous reports.( 27 , 28 , 29 )
For the real‐time RT‐PCR, cDNAs were synthesized by PrimeScript RT Reagent Kit (TAKARA Bio Inc., Shiga, Japan). PCR was performed with a SYBR Premix ExTaq (TAKARA Bio Inc.) and the primer sets are listed in Table 1. Reactions were performed with a Thermal Cycler Dice Real Time System (TAKARA Bio Inc.) and analyzed using the manufacturer's software. For quantification, the expression levels of six genes were normalized with that of GAPDH gene.
Table 1.
Primers used in the real time quantitative reverse transcription–polymerase chain reaction
| Gene | Sequence of oligonucleotide | |
|---|---|---|
| DDIT3 | sense | 5′‐GCCAAAATCAGAGCTGGAAC‐3′ |
| antisense | 5′‐TCTTGCAGGTCCTCATACCA‐3′ | |
| DEDD2 | sense | 5′‐GCAGTCAAGCAGTTCTGCAA‐3′ |
| antisense | 5′‐CACAGGTCACTTTGCCTTCA‐3′ | |
| p21 | sense | 5′‐GCAGACCAGCATGACAG‐3′ |
| antisense | 5′‐TAGGGCTTCCTCTTGGA‐3′ | |
| IL6 | sense | 5′‐GGTACATCCTCGACGGCATCT‐3′ |
| antisense | 5′‐GTGCCTCTTTGCTGCTTTCAC‐3′ | |
| BIRC3 | sense | 5′‐CAGCCCGCTTTAAAACATTC‐3′ |
| antisense | 5′‐ACCCATGGATCATCTCCAG‐3′ | |
| MYC | sense | 5′‐GCCACGTCTCCACACATCAG‐3′ |
| antisense | 5′‐TCTTGGCAGCAGGATAGTCCTT‐3′ |
In vivo therapeutic effect of DHMEQ. Twenty male CB17 SCID mice were obtained from CLEA Japan Company. Mice at 5 weeks old were injected with 4 × 10⁶ TY1 cells intraperitoneally. In the treatment group, DHMEQ dissolved in 0.5% carboxymethyl cellulose (CMC) (Sigma, St. Louis, MO, USA) solution was administered into the intraperitoneal region at a dose of 8 mg/kg, beginning 1 day before the inoculation and 3 times a week thereafter for 1 month. In the control group, mice were treated with dimethyl sulfoxide (DMSO) dissolved in 0.5% CMC solution by the same procedure. Mice were observed for 3 months and survival curves were calculated by Kaplan and Meier's method. The statistical significance was examined by Cox‐Mantel test. A P‐value < 0.05 was considered to be statistically significant.
Results
NF‐κB activation was abrogated in PEL cell lines by DHMEQ. NF‐κB is constitutively activated in primary PEL cells and cell lines derived from them.( 9 , 30 ) Thus, we first confirmed NF‐κB activation by EMSA and analyzed its subcomponents by supershift assays, using TY1, BCBL1 and BC1 cell lines. The results confirmed constitutive activation of NF‐κB in BCBL1 and BC1 cell lines as previously reported,( 9 , 30 ) and NF‐κB activation was first confirmed in TY1 in this experiment. Supershift analyses showed that NF‐κB bands were composed of p50, p65 and RelB in all cell lines, indicating constitutive activation of both canonical and non‐canonical pathways. Furthermore, it was clearly demonstrated that the major NF‐κB binding signals are composed of two bands, the lower one containing p50 and upper one p65 (Fig. 1A).
Figure 1.
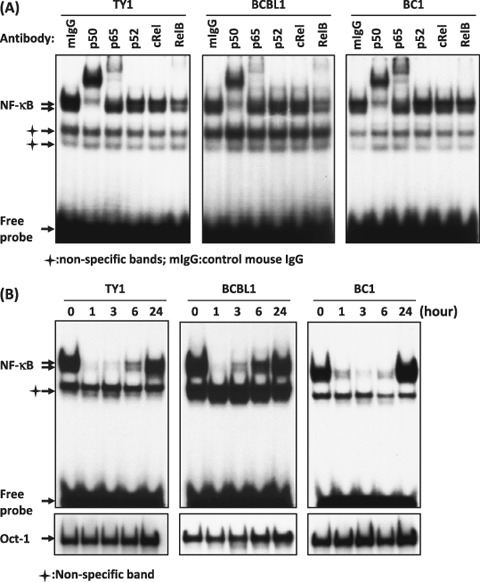
Dehydroxymethylepoxyquinomicin (DHMEQ) inhibited constitutive NF‐κB binding activity in primary effusion lymphoma (PEL) cell lines. (A) Sub‐components of NF‐κB activity in PEL cell lines. Nuclear extracts (1 µg) of cells were subjected to supershift analysis with indicated antibodies. (B) Effect of DHMEQ on NF‐κB binding activity. PEL cell lines (TY1, BCBL1 and BC1) were treated with DHMEQ (10 µg/mL) for indicated hours. Nuclear extracts were examined for NF‐κB binding activity by electrophoretic mobility shift analysis (EMSA) with a radio‐labeled NF‐κB‐specific probe. Lower panels: results of Oct –1 probe as controls.
We next tested the effects of DHMEQ treatment of these cells. Results of EMSA demonstrated loss of DNA binding of NF‐κB after 1–3 h. However, all cell lines showed significant recovery of NF‐κB activities after short periods. TY1 and BCBL1 cells lost NF‐κB binding activity at 1 h; however, recovery was evident at 3 or 6 h with almost full recovery at 24 h. BC1 cells recovered almost the initial level of NF‐κB activity after 24 h (Fig. 1B). These results indicated that DHMEQ could transiently inhibit NF‐κB activity in PEL cell lines with partial or full recovery of the activities in 1 day. In other lymphoid cell lines, recovery of NF‐κB activity after DHMEQ treatment was not observed in 1 day,( 16 , 17 , 18 ) although a weak binding of NF‐κB could be detected sometimes at later time points (unpublished observation). Thus, relatively quick recovery of NF‐κB activity appears to be a unique feature of PEL cell lines.
DHMEQ reduced cell viability in PEL cell lines. Next we examined the cell viability after 3 days incubation with different concentrations of DHMEQ (2.5, 5, 7.5 and 10 µg/mL). The results demonstrated a dose‐dependent decrease in the cell viability for all PEL cell lines, but not for a control cell line, K562, without NF‐κB activation. Peripheral blood mononuclear cells (PBMCs) and primary B‐cells were shown to be resistant to DHMEQ treatment,( 15 , 16 , 26 ) and most B‐cell lines without HHV‐8 or EBV were sensitive to DHMEQ when they have activated NF‐κB.( 16 , 17 ) The decrease in the cell viability was also time‐dependent as we measured the cell viability at 24, 48, and 72 h after DHMEQ (10 µg/mL) treatment (Fig. 2). Thus, DHMEQ decreased the PEL cell viability in a dose‐ and time‐dependent manner.
Figure 2.
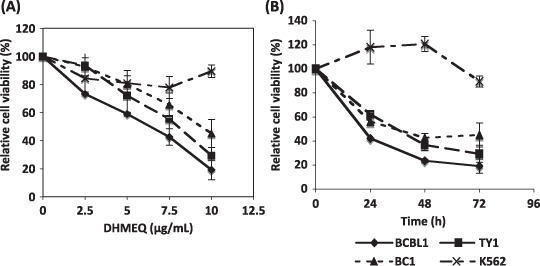
Dehydroxymethylepoxyquinomicin (DHMEQ) reduced viability of primary effusion lymphoma (PEL) cells. PEL cell lines and K562 cells were treated with indicated concentrations of DHMEQ for 72 h (A) or were treated for the indicated hours with 10 µg/mL of DHMEQ (B). K562 cell line, without NF‐κB activation, was used as a control. The cell viability was determined by WST‐8 (Dojindo). The mean percentages of triplicate experiments compared with untreated cells are shown with standard deviation (SD).
DHMEQ induced apoptosis in PEL cell lines. After 24 h of DHMEQ treatment (10 µg/mL), Annexin V reactivity was examined. Propidium iodide (PI) staining was included to discriminate the necrotic cells from apoptotic ones. Flow cytometry demonstrated a significant shift of the cell population toward Annexin V‐positive areas in all cell lines, although some of the cells shifted toward PI‐single positive areas (Fig. 3A). Summarized results are shown in Table 2, where results of three triplicate independent experiments are presented with the mean and SD. Furthermore, TUNEL assay demonstrated DNA fragmentation in all cell lines at 48 h (Fig. 3B). These results provided evidence for apoptosis induction by DHMEQ treatment in PEL cell lines.
Figure 3.
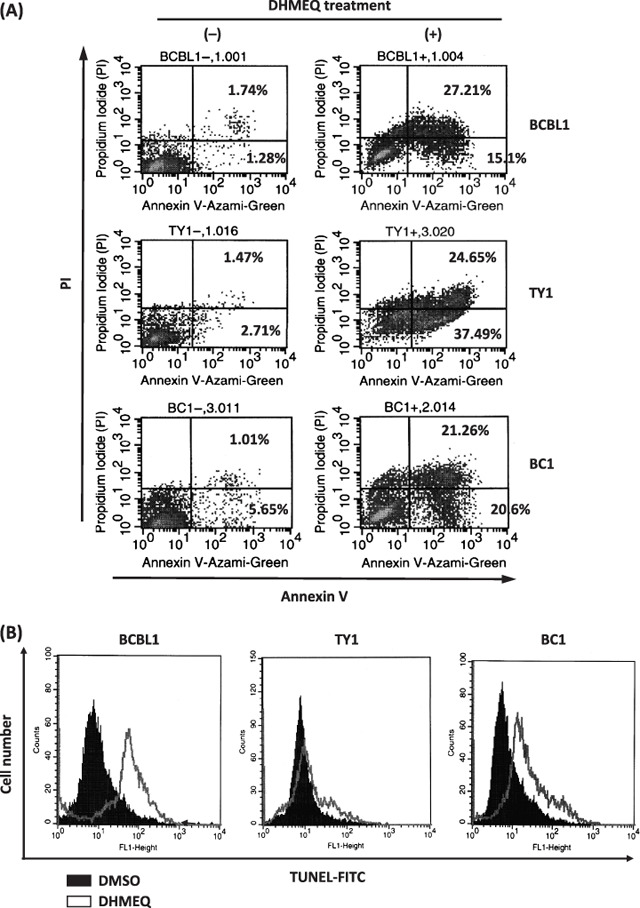
Dehydroxymethylepoxyquinomicin (DHMEQ) induced apoptosis in primary effusion lymphoma (PEL) cell lines. (A) Annexin V reactivity in PEL cell lines after DHMEQ treatment. A representative result of three triplicate independent experiments is presented. PEL cell lines were treated with or without DHMEQ (10 µg/mL) for 24 h, and binding of Annexin V and intercalation of propidium iodide (PI) were analyzed by flow cytometry. (B) DNA fragmentation in the PEL cell lines after DHMEQ treatment. Terminal deoxynucleotidyl transferase‐mediated dUTP nick‐end labeling (TUNEL) assay was done for PEL cell lines after 48 h incubation with or without DHMEQ (10 µg/mL).
Table 2.
Quantitative results of staining primary effusion lymphoma (PEL) cell lines with Annexin V and propidium iodide (PI)
| DHMEQ | BCBL1 (%) | TY1 (%) | BC1 (%) | |
|---|---|---|---|---|
| UL | (–) | 0.71 ± 0.14 | 1.96 ± 1.07 | 0.55 ± 0.09 |
| (+) | 7.13 ± 3.82 | 6.06 ± 0.50 | 5.04 ± 1.60 | |
| UR | (–) | 1.94 ± 0.57 | 2.84 ± 1.92 | 1.96 ± 1.02 |
| (+) | 45.92 ± 17.04 | 37.89 ± 15.36 | 38.53 ± 20.95 | |
| LL | (–) | 95.37 ± 0.29 | 90.91 ± 4.07 | 93.10 ± 2.13 |
| (+) | 34.70 ± 11.14 | 33.62 ± 0.82 | 43.58 ± 12.14 | |
| LR | (–) | 1.96 ± 0.45 | 4.28 ± 1.61 | 4.37 ± 2.20 |
| (+) | 12.34 ± 2.97 | 22.41 ± 14.32 | 12.83 ± 9.69 |
PEL cells incubated with or without dehydroxymethylepoxyquinomicin (DHMEQ) (10 µg/mL) for 24 h and stained with Annexing V and PI. Then, analyzed with flow cytometry. Upper left (UL), upper right (UR), lower left (LL) and lower right (LR) quadrants are responsible for PI positive only, PI and AnnexinV positive, PI and Annexin V negative, Annexin V positive only cell populations, respectively. Results are mean value ± SD of 3 triplicate independent experiments.
DHMEQ activated both membrane and mitochondrial caspase pathways. Apoptosis can be induced via membrane and/or mitochondrial stimuli, each of which has their own specific pro‐caspases to become active after receiving stimuli. Carboxyfluorescein FLICA Apoptosis Detection Kit revealed cleaved products of caspases‐3, ‐8, and ‐9 at the same time after 6 h of DHMEQ treatment (Fig. 4A). Immunoblot analyses clearly demonstrated production of cleaved products of caspase‐3, ‐8 and ‐9 at the same time after 6 h of DHMEQ treatment (Fig. 4B).
Figure 4.
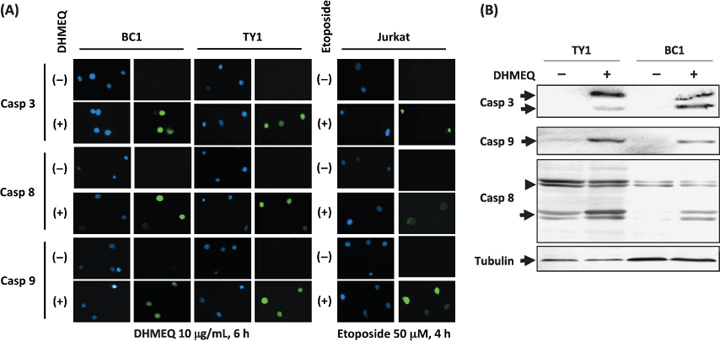
Both membrane and mitochondrial caspase pathways were activated by dehydroxymethylepoxyquinomicin (DHMEQ) treatment of primary effusion lymphoma (PEL) cells. (A) Cleaved products of caspases were detected after DHMEQ treatment (10 µg/mL) for 6 h. Caspase 3, responsible for the common pathway, caspase 8, as an indicator for the membrane pathway, and caspase 9 as an indicator for the mitochondrial pathway. Jurkat cell line treated with etoposide 50 µM for 4 h served as a control. DNAs were stained by Hoechst 33258 (blue fluorescence). Green fluorescence indicated cleaved products of caspases bound to FLICA peptides. (B) Immunoblot analysis of caspase cleavage. TY1 and BC1 cells were treated with 10 µg/mL of DHMEQ for 6 h. Samples of 30 µg of whole cell lysates were examined. Positions of cleaved forms of caspase 3 and 9 are indicated on the left of the upper two panels (arrows). In the third panel, uncleaved and cleaved forms of caspase 8 are indicated on the left (arrowhead: uncleaved). An immunoblot of α‐tubulin served as a control (bottom panel).
Taken together, the results suggested that both caspase pathways became active in the PEL cell lines as a result of incubation with DHMEQ for 6 h.
DHMEQ modulated NF‐κB target genes, apoptotic and cell cycle regulating genes. Whole human genome expression analysis was done to obtain a comprehensive view of DHMEQ effect on PEL cell lines, and to confirm the efficient targeting of the NF‐κB pathway. DHMEQ down‐ or up‐regulated expression levels of 72 and 71 genes, respectively, in BC1 and BCBL1 cell lines (Fig. 5A). Down‐regulation was observed in NF‐κB target genes, such as IL6, Myc, CCR5, BCL‐xL, cIAP2 and NF‐κB1. Bcl‐xL, c‐IAP2, and NF‐κB1 are also anti‐apoptotic genes. Other anti‐apoptotic genes, such as Birc5 and IGF1R, were down‐regulated. However, some anti‐apoptotic genes including SSP1, VEGF, MIF and BAG3 were up‐regulated. Some of pro‐apoptotic genes such as DEDD2, CDKN1A and APOE were up‐regulated, whereas TNFSF10 was down‐regulated. Most of the genes involved in cell cycle arrest were up‐regulated, the examples of which were CDKN1A, CDKN1B, PPP1R15 A and DDIT3 (Supporting Information).
Figure 5.
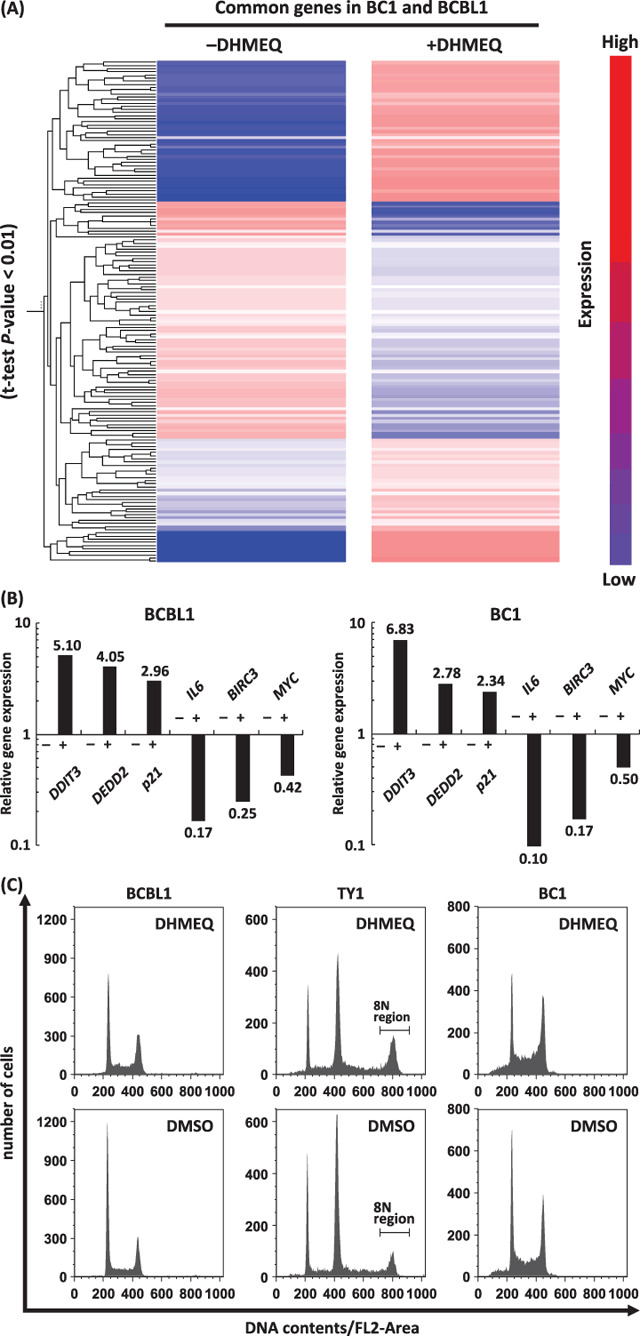
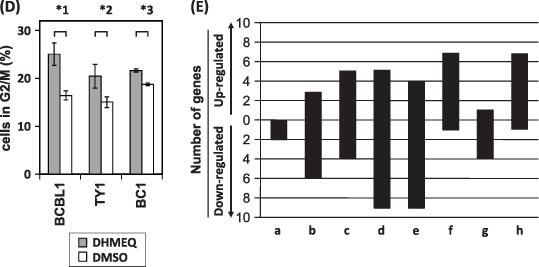
Dehydroxymethylepoxyquinomicin (DHMEQ) modulated genes responsible for proliferation, cell cycle, pro‐ and anti‐apoptosis. Whole Human Genome Oligo Microarray Kit (Agilent Technologies) was used to evaluate the gene expression in BC1 and BCBL1 with or without DHMEQ (10 µg/mL), 6 h. (A) The result of cluster analysis showed significant changes in expression levels between ±DHMEQ in both cell lines (t‐test, P‐value < 0.01). (B) Results of real‐time reverse‐transcription–polymerase chain reaction for validation of the array data. Up‐ or down‐regulation of selected genes was confirmed in both cell lines tested. (C) Effects on cell cycle regulation. Representative results of flow cytometry after 6 h of DHMEQ are presented. TY1 cells appear to be a mixture of 2 N and 4 N populations. (D) Percentages of cells in G2/M phase. In TY1 cells, the percentage of the 8 N region was considered to represent a significant part of the cells at G2/M, and was used for comparison. Differences were statistically significant (*1, P < 0.05, *2, P < 0.05, *3, P < 0.001) (E) Gene ontology analysis on BC1 genes of which expression levels were significantly changed by addition of DHMEQ (t‐test, P‐value < 0.01). The graph shows numbers of the genes in following selected categories: a, negative regulators of NF‐κB import into nucleus; b, IκB kinase and NF‐κB cascade; c, positive regulators of apoptosis; d, negative regulators of apoptosis; e, DNA repair; f, cell cycle arrest: g, cell cycle checkpoint; h, regulators of cyclin dependent protein kinase activity. Positive and negative areas represent the number of up‐regulated genes, and those of down‐regulated genes, respectively.
For validation of above results, we performed real‐time RT‐PCR analysis. For this purpose, we selected three up‐regulated and three down‐regulated genes. The results provided evidence that validate the results of expression array analysis, showing up‐ or down‐regulation of the selected genes (Fig. 5B). Furthermore, the levels of up‐ or down‐regulation appeared to well correlate with those obtained by the expression array analysis described above.
Since the genes involved in cell cycle arrest were induced by DHMEQ, we next examined effects of DHMEQ treatment on the cell cycle regulating using three cell lines. The results showed significant accumulation of the cells in G2/M phase at 6 h of treatment (Fig. 5C,D).
Gene ontology analysis on the genes the expression levels of which were significantly altered by the addition of DHMEQ in BC1 cells (P‐value < 0.01) revealed that the majority of the genes in the following categories were down‐regulated: (i) negative regulators of NF‐κB import to the nucleus; (ii) IκB kinase and NF‐κB cascade; (iii) negative regulators of apoptosis; (iv) DNA repair; and (v) cell cycle checkpoint. In contrast, the majority of the genes in the following categories were up‐regulated: (i) positive regulators of apoptosis; (ii) cell cycle arrest; and (iii) regulators of cyclin‐dependent protein kinase activity (Fig. 5E).
Taken together, we observed a trend toward induction of pro‐apoptotic and cell cycle arrest genes, concomitant with suppression of NF‐κB target, anti‐apoptotic and DNA repair genes.
DHMEQ did not induce HHV‐8 reactivation. Semi‐quantitative RT‐PCR was done to examine changes in the viral gene expression after the DHMEQ treatment. Some viral genes known as ‘lytic genes’ were selected as well as those with important viral functions. The results demonstrated low or undetectable levels of lytic gene expression without significant changes until 14 h of treatment, suggesting that NF‐κB inhibition by DHMEQ treatment did not lead to viral production in these cells (Fig. 6). Expression levels of v‐FLIP, v‐cyclin, and LANA were slightly up‐regulated after 3–6 h of DHMEQ treatment, returning to the basal levels after 14 h. It is worthy of note that v‐FLIP, a potent viral activator of NF‐κB pathway, showed almost constant levels of expression irrespective of DHMEQ treatment. Taken together, we could not obtain evidence for induction of virus proliferation that was previously reported as an effect of NF‐κB inhibition in PEL cell lines.( 31 )
Figure 6.
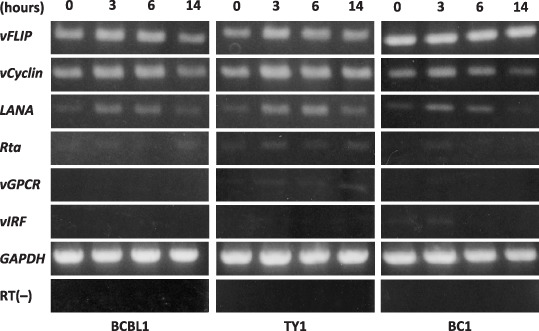
Viral gene expression after dehydroxymethylepoxyquinomicin (DHMEQ) treatment showed no transition from latent to lytic phase. Viral gene expression after DHMEQ treatment (10 µg/mL) at different time points was examined by semiquantitative reverse‐transcription–polymerase chain reaction. Two micrograms of total RNA were used to prepare cDNA using oligo(dT)12–18 primer. GAPDH and RT(–) served as controls.
DHMEQ showed a potent inhibitory effect on the growth of PEL cells in SCID mice. We next examined whether DHMEQ treatment could be effective against xenografted tumors in a SCID mice model. TY1 cells were injected intraperitoneally into the SCID mice and DHMEQ or vehicle alone was administered according to the protocol described in the Materials and Methods section. The gross appearance of the mice with or without DHMEQ treatment was significantly different, showing abdominal distention in vehicle‐treated mice, whereas DHMEQ‐treated mice were apparently normal in body shape. The body weights of the DHMEQ‐treated mice were much less than those of vehicle‐treated mice after 1 month, although the difference was not statistically significant (Fig. 7A,B). DHMEQ treatment rescued 8/10 xenografted mice at the point of 3 months, whereas only 3/10 survived in the vehicle‐treated control group. The results are similar to those of our previous experiments in animal models of adult T‐cell leukemia (ATL).( 32 , 33 ) Statistical analysis showed a significant increase in the survival rate in the mice treated with DHMEQ compared with the control (Cox‐Mantel test; P < 0.05, Fig. 7C). These results demonstrated that DHMEQ was effective against PEL cells in vivo, which provided supportive evidence for possible clinical application.
Figure 7.
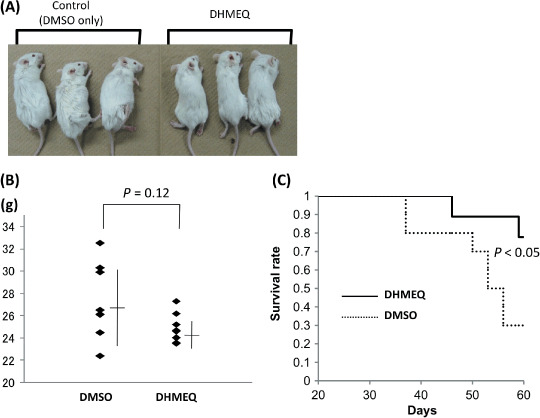
Dehydroxymethylepoxyquinomicin (DHMEQ) rescued primary effusion lymphoma (PEL) xenografted mice. Mice at 5 weeks old were injected with 4 × 10⁶ TY 1 cells intraperitoneally. DHMEQ (8 mg/kg) in 0.5% CMC was administered three times a week intraperitoneally for 1 month. Dimethyl sulfoxide in 0.5% CMC was administered to the control group. (A) Gross appearances of the mice. (B) A graph showing weights of mice with mean values. (C) Survival curves of mice with or without DHMEQ treatment.
Discussion
The present work demonstrated that DHMEQ transiently abrogated the NF‐κB activation in PEL cell lines with significant recovery of NF‐κB activity after 24 h. Apoptotic cell death was observed in a few days without reactivation of HHV‐8. Furthermore, DHMEQ rescued PEL‐xenografted SCID mice preventing formation of tumors and effusions. Thus, we suggest DHMEQ as a promising candidate for molecular targeted therapy of the PEL.
NF‐κB activity recovered significantly after 24 h of DHMEQ‐treated PEL cell lines, which was not observed in other lymphoid cell lines we have so far tested,( 16 , 17 , 18 ) although low levels of NF‐κB recovery were observed after 24 h or later (unpublished observation). Thus, the rapid and significant recovery of NF‐κB activity can be considered as a characteristic of PEL cell lines. Transient NF‐κB inhibition can be an advantage for DHMEQ compared with other NF‐κB inhibitors, since persistent inhibition of the NF‐κB pathway may lead to adverse effects on innate and acquired immune systems where NF‐κB plays a pivotal role. The mechanism for recovery of the NF‐κB activity remains to be studied. It may be due to degradation of DHEMQ within the cells and/or persistence of the NF‐κB activating stimuli that can overcome the effects of DHMEQ. No information is available at present as to the half‐life of DHMEQ in the cell. On the other hand, persistence of high levels of NF‐κB activating signals may be explained by v‐FLIP, a well‐known viral stimulator of the NF‐κB pathway,( 7 , 34 , 35 ) that was expressed at stable levels irrespective of DHMEQ treatment (Fig. 6).
Another benefit of DHMEQ may reside in targeting the translocation of p65 into nuclei. Generally, target specificity of kinase inhibitors is not strict. For example, Bay11‐7083 has non‐specific activities on other kinases along with tyrosine phosphorylation of a protein of unknown origin.( 36 ) Furthermore, Bay11‐7085 does not inhibit translocation of p65 into nuclei, and shows non‐specific inhibition of binding of other transcription factors to its binding sequences.( 37 ) On the other hand, DHMEQ treatment results in disappearance of p65 and p50 in the nuclei of cell lines of Hodgkin‐Reed‐Sternberg (H‐RS) cells and ATL, not affecting binding of other transcription factors such as AP‐1 and Oct1 in EMSA.( 15 , 16 ) Taken together, the specific activity of DHMEQ appears to be an advantage over other NF‐κB inhibitors with respect to avoiding adverse effects.
The apoptosis cascade was triggered with transient abrogation of NF‐κB by DHMEQ treatment. Furthermore, subsequent recovery of NF‐κB activity could not rescue the DHMEQ‐treated PEL cells, suggesting that DHMEQ triggered irreversible activation of the apoptosis cascade. These observations are in line with those discussed in the context of ‘oncogene addiction’ and ‘oncogenic shock’.( 38 , 39 , 40 ) Sharma et al. proposed a model referred to as ‘oncogenic shock’ to account for the observed apoptotic outcome resulting from the acute inactivation of oncoproteins in addicted cancer cells. According to this model, proapoptotic as well as prosurvival signals are both outputs emanating from the same addicting oncoprotein, and the differential decay rates associated with these two broad classes of signals following oncoprotein inactivation, leads to a signal imbalance that contributes to cell death.( 39 , 40 ) The results of our gene ontology analyses demonstrated that more anti‐apoptotic genes are down‐regulated at 6 h compared with pro‐apoptotic genes (Fig. 5B), which suggest a condition after acute inactivation of the oncoprotein, where rapid attenuation of oncoprotein‐generated prosurvival signals is associated with lingering pro‐apoptotic signals.
The pathway analysis of apoptosis revealed activation of both membrane and mitochondrial pathways, which is evidenced by detection of cleaved products of caspases‐8 and ‐9 at the same time. Previously we reported the same results using human T‐cell leukemia virus type I‐transformed cells and cell lines of H‐RS cells and multiple myeloma.( 15 , 16 , 18 ) Since links between the receptor and the mitochondrial pathways exist at different levels, upon death receptor triggering, activation of caspase‐8 may result in cleavage of Bid, a Bcl‐2 family protein with a BH3 domain only, which in turn translocates to mitochondria to release cytochrome c thereby initiating a mitochondrial amplification loop.( 41 , 42 ) In addition, cleavage of caspase‐6 downstream of mitochondria may feed back to the receptor pathway by cleaving caspase‐8.( 43 ) Thus, the data can be interpreted in either context, leaving the exact mechanism of DHMEQ‐induced apoptosis remaining to be studied.
DHMEQ did not induce transition from the latent to lytic phase of HHV‐8 (Fig. 6). There are controversies as to whether inhibition of NF‐κB leads to replication of HHV‐8,( 31 ) or not.( 10 ) Another investigator suggested that NF‐κB is necessary for HHV‐8 replication.( 44 ) However, we did not find any significant differences in the expression of known lytic genes after NF‐κB inhibition (Fig. 6). Thus, our results did not support the idea that DHMEQ administration may increase the risk for viral replication. Furthermore, the latent viral genes such as LANA, v‐FLIP, or v‐cyclin did not show significant changes in the levels of gene expression. RNA interference results showed that v‐FLIP is essential for the survival of PEL cells.( 8 ) Our data indicated that NF‐κB activation, not v‐FLIP itself, was essential for survival of PEL cells, since apoptosis was induced in the presence of stable levels of v‐FLIP expression.
Inhibition of NF‐κB causes profound effects on cellular gene expression by direct and indirect mechanisms. The results of expression array analysis confirmed down‐regulation of many NF‐κB target genes, which was mostly in accordance with previously reported results of NF‐κB inhibition by Bay11‐7082 in EBV‐infected lymphoblastoid cell lines.( 45 ) Although the suppressions of IL6 and cIAP2 were observed previously by using Bay11‐7082 on a PEL cell line,( 10 ) we could not find significant suppression in c‐FLIP, cIAP1, TRAF2 or IκBα as they reported. Instead, we found Bcl‐xL, Myc, CCR5, NF‐κB1 and FAS among the down‐regulated genes. These differences could be due to different agents used, with different specificity of activities. Suppression of other anti‐apoptotic or cell cycle progression genes could be mediated by the functions of other genes, which were modulated by NF‐κB inhibition. The result of gene ontology biological process analysis of the genes with significant changes in expression levels were reasonable because it showed a trend toward induction of pro‐apoptotic and cell cycle arrest genes, concomitant with suppression of IκB kinases, anti‐apoptotic and DNA repair genes. The results appear to represent the expression profile corresponding to ‘oncogenic shock’.( 39 , 40 )
In vivo experiments showed that PEL xenografted mice without treatment tended to be heavier, both in appearance and weight. Although we could not find statistical significances between the two groups, the mean value of the body weight was higher in the control group, which was explained by the fact that untreated mice developed tumors and effusion in body cavities. Besides, the treated group apparently did not have either effusions or tumors. The survival rate was significantly better in the treated group, indicating that DHMEQ could rescue the PEL‐xenografted mice.
In summary, the present work demonstrated that DHMEQ could abrogate NF‐κB activation transiently and initiated the apoptosis cascade irreversibly without activation of HHV‐8 replication. In addition, DHMEQ rescued the xenografted mice. Therefore, our data provided proof of the concept that DHMEQ can be a promising candidate for molecular target therapy of the PEL.
Supporting information
List of up‐regulated genes after DHMEQ (10 µg/mL for 6 h) treatment in BC1 and BCBL1 calculated by GeneSpring software (T‐test, P‐value < 0.01).
Please note: Wiley‐Blackwell are not responsible for the content or functionality of any supporting materials supplied by the authors. Any queries (other than missing material) should be directed to the corresponding author for the article.
Supporting info item
Acknowledgments
This work was supported in part by Grants‐in‐Aid for Scientific Research from the Ministry of Education, Culture, Sports, Science and Technology, and by a Research Grant from the Ministry of Health, Labour and Welfare, Japan.
References
- 1. Nador R, Cesarman E, Chadburn A et al . Primary effusion lymphoma: a distinct clinopathologic entity associated with the Kaposi's sarcoma associated herpes virus. Blood 1996; 88: 645–56. [PubMed] [Google Scholar]
- 2. Klepfish A, Sarid R, Shtalrid M et al . Primary effusion lymphoma (PEL) in HIV‐negative patients – a distinct clinical entity. Leuk Lymphoma 2001; 41: 439–43. [DOI] [PubMed] [Google Scholar]
- 3. Boulanger E, Gérard L, Gabarre J et al . Prognostic factors and outcome of human herpesvirus 8 – associated primary effusion lymphoma in patients with aids. J Clin Oncol 2005; 23: 4372–80. [DOI] [PubMed] [Google Scholar]
- 4. Hengge UR, Ruzicka T, Tyring SK et al . Update on Kaposi's sarcoma and other HHV8 associated diseases. Part 2: pathogenesis, Castleman's disease, and pleural effusion lymphoma. Lancet Infect Dis 2002; 2: 344–52. [DOI] [PubMed] [Google Scholar]
- 5. Jarviluoma A, Ojala PM. Cell signaling pathways engaged by KSHV. Biochim Biophys Acta 2006; 1766: 140–58. [DOI] [PubMed] [Google Scholar]
- 6. Sun Q, Matta H, Chaudhary PM. The human herpes virus 8‐encoded viral FLICE inhibitory protein protects against growth factor withdrawal‐induced apoptosis via NF‐kappa B activation. Blood 2003; 101: 1956–61. [DOI] [PubMed] [Google Scholar]
- 7. Chaudhary PM, Jasmin A, Eby MT et al . Modulation of the NF‐kappa B pathway by virally encoded death effector domains‐containing proteins. Oncogene 1999; 18: 5738–46. [DOI] [PubMed] [Google Scholar]
- 8. Guasparri I, Keller SA, Cesarman E. KSHV vFLIP is essential for the survival of infected lymphoma cells. J Exp Med 2004; 199: 993–1003. [DOI] [PMC free article] [PubMed] [Google Scholar] [Retracted]
- 9. Keller SA, Schattner EJ, Cesarman E. Inhibition of NF‐kappaB induces apoptosis of KSHV‐infected primary effusion lymphoma cells. Blood 2000; 96: 2537–42. [PubMed] [Google Scholar]
- 10. Keller SA, Hernandez‐Hopkins D, Vider J et al . NF‐κB is essential for progression of KSHV‐ and EBV‐infected lymphomas in vivo. Blood 2006; 107: 3295–302. [DOI] [PMC free article] [PubMed] [Google Scholar]
- 11. Chen LF, Greene WC. Shaping the nuclear action of NF‐kappaB. Nat Rev Mol Cell Biol 2004; 5: 392–401. [DOI] [PubMed] [Google Scholar]
- 12. Chen LF, Greene WC. Regulation of distinct biological activities of the NF‐kappaB transcription factor complex by acetylation. J Mol Med 2003; 81: 549–57. [DOI] [PubMed] [Google Scholar]
- 13. Matsumoto N, Ariga A, To‐e S et al . Synthesis of NF‐kappaB activation inhibitors derived from epoxyquinomicin C. Bioorg Med Chem Lett 2000; 10: 865–9. [DOI] [PubMed] [Google Scholar]
- 14. Umezawa K, Chaicharoenpong C. Molecular design and biological activities of NF‐kappaB inhibitors. Mol Cells 2002; 14: 163–7. [PubMed] [Google Scholar]
- 15. Watanabe M, Ohsugi T, Shoda M et al . Dual targeting of transformed and untransformed HTLV‐1‐infected T cells by DHMEQ, a potent and selective inhibitor of NF‐kappaB, as a strategy for chemoprevention and therapy of adult T‐cell leukemia. Blood 2005; 106: 2462–71. [DOI] [PubMed] [Google Scholar]
- 16. Watanabe M, Dewan Md. Z , Taira M et al . IκBα independent induction of NF‐κB and its inhibition by DHMEQ in Hodgkin‐Reed‐Sternberg cells. Lab Invest 2007; 87: 372–82. [DOI] [PubMed] [Google Scholar]
- 17. Horie R, Watanabe M, Okamura T et al . DHMEQ, a new NF‐kappaB inhibitor, induces apoptosis and enhances fludarabine effects on chronic lymphocytic leukemia cells. Leukemia 2006; 20: 800–6. [DOI] [PubMed] [Google Scholar]
- 18. Watanabe M, Dewan Md Z, Okamura T et al . A novel NF‐kappaB inhibitor DHMEQ selectively targets constitutive NF‐kappaB activity and induces apoptosis of multiple myeloma cells in vitro and in vivo . Int J Cancer 2005; 114: 32–8. [DOI] [PubMed] [Google Scholar]
- 19. Nishimura D, Ishikawa H, Matsumoto K et al . DHMEQ, a novel NF‐kappaB inhibitor, induces apoptosis and cell‐cycle arrest in human hepatoma cells. Int J Oncol 2006; 29: 713–9. [PubMed] [Google Scholar]
- 20. Matsumoto G, Muta M, Umezawa K et al . Enhancement of the caspase‐independent apoptotic sensitivity of pancreatic cancer cells by DHMEQ, an NF‐kappaB inhibitor. Int J Oncol 2005; 27: 1247–55. [PubMed] [Google Scholar]
- 21. Matsumoto G, Namekawa J, Muta M et al . Targeting of nuclear factor kappaB pathways by dehydroxymethylepoxyquinomicin, a novel inhibitor of breast carcinomas: antitumor and antiangiogenic potential in vivo . Clin Cancer Res 2005; 11: 1287–93. [PubMed] [Google Scholar]
- 22. Drexler HG, Uphoff CC, Gaidano G, Carbone A. Lymphoma cell lines: in vitro models for the study of HHV‐8+ primary effusion lymphomas (body cavity‐based lymphomas). Leukemia 1998; 12: 1507–17. [DOI] [PubMed] [Google Scholar]
- 23. Katano H, Hoshino Y, Morishita Y et al . Establishing and characterizing a CD30‐positive cell line harboring HHV‐8 from a primary effusion lymphoma. J Med Virol 1999; 58: 394–401. [PubMed] [Google Scholar]
- 24. Lenardo MJ, Baltimore D. NF‐kappaB: A pleiotropic mediator inducible and tissue‐specific gene control. Cell 1989; 58: 227–9. [DOI] [PubMed] [Google Scholar]
- 25. Andrews NC, Faller DV. A rapid micropreparation technique for extraction of DNA‐binding proteins from limiting numbers of mammalian cells. Nucl Acids Res 1991; 19: 2499. [DOI] [PMC free article] [PubMed] [Google Scholar]
- 26. Miyake A, Dewan MdZ, Ishida T et al . Induction of apoptosis in Epstein‐Barr virus‐infected B‐lymphocytes by the NF‐κB inhibitor DHMEQ. Microbes Infect 2008; 10: 748–56. [DOI] [PubMed] [Google Scholar]
- 27. Krishnan HH, Naranatt PP, Smith MS et al . Concurrent expression of latent and a limited number of lytic genes with immune modulation and antiapoptotic function by Kaposi's sarcoma‐associated herpesvirus early during infection of primary endothelial and fibroblast cells and subsequent decline of lytic gene expression. J Virol 2004; 78: 3601–20. [DOI] [PMC free article] [PubMed] [Google Scholar]
- 28. Yoo SM, Zhou FC, YeFC et al . Early and sustained expression of latent and host modulating genes in coordinated transcriptional program of KSHV productive primary infection of human primary endothelial cells. Virology 2005; 343: 47–64. [DOI] [PMC free article] [PubMed] [Google Scholar]
- 29. O'Donovan M, Silva I, Uhlmann V et al . Expression profile of human herpesvirus 8 (HHV‐8) in pyothorax associated lymphoma and in effusion lymphoma. Mol Pathol 2001; 54: 80–5. [DOI] [PMC free article] [PubMed] [Google Scholar]
- 30. Ghosh SK, Wood C, Boise LH et al . Potentiation of TRAIL‐induced apoptosis in primary effusion lymphoma through azidothymidine‐mediated inhibition of NF‐kappaB. Blood 2003; 101: 2321–7. [DOI] [PubMed] [Google Scholar]
- 31. Brown HJ, Song MJ, Deng H et al . NF‐kappaB inhibits gammaherpesvirus lytic replication. J Virol 2003; 77: 8532–40. [DOI] [PMC free article] [PubMed] [Google Scholar]
- 32. Ohsugi T, Horie R, Kumasaka T et al . In vivo antitumor activity of the NF‐kB inhibitor dehydroxymethylepoxyquinomicin in a mouse model of adult T‐cell leukemia. Carcinogenesis 2005; 26: 1382–8. [DOI] [PubMed] [Google Scholar]
- 33. Ohsugi T, Kumasaka T, Ishida A et al . In vitro and in vivo antitumor activity of the NF‐κB inhibitor DHMEQ in the human T‐cell leukemia virus type 1‐transformed cell line, HUT‐102. Leuk Res 2006; 30: 90–7. [DOI] [PubMed] [Google Scholar]
- 34. Liu L, Eby MT, Rathore N et al . The human herpes virus 8‐encoded viral FLICE inhibitory protein physically associates with and persistently activates the IkappaB kinase complex. J Biol Chem 2002; 277: 13745–51. [DOI] [PubMed] [Google Scholar]
- 35. Field N, Low W, Daniels M et al . KSHV vFLIP binds to IKK‐gamma to activate IKK. J Cell Sci 2003; 116: 3721–8. [DOI] [PubMed] [Google Scholar]
- 36. Pierce JW, Schoeenleber R, Jesmok G et al . Novel inhibitors of cytokine‐induced IkappaB‐alpha phosphorylation and endothelial cell adhesion molecule expression show anti‐inflammatory effects in vivo . J Biol Chem 1997; 272: 21096–103. [DOI] [PubMed] [Google Scholar]
- 37. Berger N, Bassat HB, Klein BY, Laskov R. Cytotoxicity of NF‐κB inhibitors Bay 11‐7085 and caffeic acid phenethyl ester to Ramos and other human B‐lymphoma cell lines. Exp Hemaol 2007; 35: 1495–509. [DOI] [PubMed] [Google Scholar]
- 38. Weinstein IB. Disorders in cell circuitry during multi‐stage carcinogenesis. Caricinogenesis 2000; 21: 857–64. [DOI] [PubMed] [Google Scholar]
- 39. Sharma SV, Fischbach MA, Haber DA, Settleman J. ‘Oncogene shock’ explaining oncogene addiction through differential signal activation. Clin Cancer Res 2006; 12 (14 Suppl.): 4392s–95s. [DOI] [PubMed] [Google Scholar]
- 40. Sharma SV, Settleman J. Oncogene addiction: setting the stage for molecularly targeted cancer therapy. Genes Dev 2007; 21: 3214–31. [DOI] [PubMed] [Google Scholar]
- 41. Nieminen AI, Partanen JI, Klefstrom J. c‐Myc blazing a trail of death: coupling of the mitochondrial and death receptor apoptosis pathways by c‐Myc. Cell Cycle 2007; 6: 2464–72. [DOI] [PubMed] [Google Scholar]
- 42. Cory S, Adams JM. The Bcl2 family: regulators of the cellular life‐or‐death switch. Nat Rev Cancer 2002; 2: 647–56. [DOI] [PubMed] [Google Scholar]
- 43. Cowling V, Downward J. Caspase‐6 is the direct activator of caspase‐8 in the cytochrome c‐induced apoptosis pathway: absolute requirement for removal of caspase‐6 prodomain. Cell Death Differ 2002; 9: 1046–56. [DOI] [PubMed] [Google Scholar]
- 44. Sgarbanti M, Arguello M, Tenover BR et al . A requirement for NF‐kappaB induction in the production of replication‐component HHV‐8 virions. Oncogene 2004; 23: 5770–80. [DOI] [PubMed] [Google Scholar]
- 45. Cahir‐McFarland ED, Carter K, Rosenwald A et al . Role of NF‐kappa B in cell survival and transcription of latent membrane protein 1‐expressing or Epstein‐Barr virus latency III‐infected cells. J Virol 2004; 78: 4108–19. [DOI] [PMC free article] [PubMed] [Google Scholar]
Associated Data
This section collects any data citations, data availability statements, or supplementary materials included in this article.
Supplementary Materials
List of up‐regulated genes after DHMEQ (10 µg/mL for 6 h) treatment in BC1 and BCBL1 calculated by GeneSpring software (T‐test, P‐value < 0.01).
Please note: Wiley‐Blackwell are not responsible for the content or functionality of any supporting materials supplied by the authors. Any queries (other than missing material) should be directed to the corresponding author for the article.
Supporting info item


