

Abstract
(Cancer Sci 2010; 101: 686–692)
The lymphatic endothelial cell (LEC) is an interactive surface for cancer cells. This article aims to explore cancer cell‐induced changes of LEC, and study the tumor–lymphatic endothelium interaction. Here, LECs were co‐cultured with highly and poorly metastatic tongue cancer cells. The differences in biologic behaviors and gene expression profiles between them were examined. The results showed that LECs induced by highly metastatic cancer cells displayed abnormal biologic behaviors, and could secrete chemokines to promote the migration of cancer cells. Therefore, biologic properties and functional status of LECs in oral tongue squamous cell carcinoma (OTSCC) might be a positive factor in lymphatic dissemination.
The lymphatic system plays multiple roles in biologic processes, such as tissue homeostasis, supplemental circulation, and immune surveillance.( 1 , 2 ) However, lymphatic vessels also act as conduits for metastatic tumor cells to escape from the primary tumor in most carcinomas.( 3 ) Lymphatic spread is much more important in oral tongue squamous cell carcinoma (OTSCC) than in other cancers, because they preferentially metastasize to roughly 400 lymph nodes in the cervical region, and lymph node metastasis is the strongest prognostic factor for survival of OTSCC patients.( 4 , 5 )
Until now, the details of the process and molecular mechanisms of lymphatic metastasis have been unclear. Several reports on OTSCC showed that intratumoral and peritumoral lymphatic vessels were closely related to lymphatic metastasis, for they provided additional conduits for the dissemination of cancer cells.( 6 , 7 , 8 ) Although lymphatic vessels constitute the most important channel of lymphatic spread, the lymphatic endothelium provides an interactive surface for cancer cells, and the ability of cancer cells to interact with the lymphatic endothelial cells (LECs) is a key step in their invasion of the lymphatic system. Recent studies demonstrated that tumor‐derived LECs had a remarkable degree of phenotypic plasticity.( 9 ) Our previous study also showed that oral tongue cancer‐induced LECs were more proliferative and had enhanced ability to organize capillary‐like structures.( 10 ) However, it is unclear whether altered LEC properties are consequences of the increased metastatic potential of tongue cancer cells, and whether these specific phenotypes contribute to the lymphatic dissemination of OTSCC.
Tca8113 and LNMTca8113 cells had different potential of metastasis via lymphatic vessels. It was previously demonstrated that lymphangiogenesis in tumors derived from LNMTca8113 cells was promoted compared with that from Tca8113 cells. Moreover, it was confirmed that the number of micro‐lymphatic branches in LNMTca8113 conditioned medium (CM) increased more rapidly than that in Tca8113 CM when induced lymphangioma were cultured in tumor conditioned medium (TCM) (accepted by Journal of West China Stamotology).
In order to explore cancer cell‐induced changes of LEC, and study the tumor–lymphatic endothelium interaction, LECs were co‐cultured with Tca8113 and LNMTca8113 cells in vitro. Some functional assays of LNMTca8113‐stimulated LECs (LNMLECs) and Tca8113‐stimulated LECs (TLECs) were also performed. To further understand the molecular mechanism of biologic behaviors of LNMLECs, we used whole‐genome cDNA microarrays to reveal the differential gene expression profiles of LNMLECs and TLECs. Moreover, the expression of certain chemokines from LECs was assayed by real‐time PCR and ELISA. Our results indicated that tongue cancer cells with higher potential of metastasis induced changes in LECs phenotypes and properties, and these specific alterations to LECs had positive influences on the lymphatic dissemination of tongue cancer cells.
Materials and Methods
Cell culture and preparation of TCM. The tongue cancer cell line was donated by the Ninth People’s Hospital of Shanghai, Shanghai Traffic University. The LNMTca8113 cell line was previously established by in vivo selection in a nude mice model, which had a higher potential of lymphatic metastasis than its parental Tca8113 cell line (metastasis rate, 36.36% and 75.00% respectively).( 11 ) Two cancer cell lines were maintained in RPMI‐1640 medium (Gibco, Carlsbad, CA, USA) supplemented with 5% FBS (Gibco) and penicillin (100 U/mL) and streptomycin (100 mg/mL) (Gibco). TCM was prepared by incubating Tca8113 or LNMTca8113 cells (2 × 10⁵/mL) in serum/endothelial cell growth supplement (ECGS)‐free endothelial cell medium (ECM) for 24 h. The medium was then removed, centrifuged (2000 g , 10 min), supplemented with 5% FBS, filter sterilized, and stored frozen at −80°C prior to use.
Human lymphatic endothelial cells (HLECs) were purchased from Sciencell Research Laboratories and maintained in ECM (Sciencell, San Diego, CA, USA) at 37°C in a humidified atmosphere of 5% CO2. Complete ECM consisted of 500 mL basal medium, 25 mL FBS, 5 mL ECGS, and 5 mL penicillin/streptomycin solution. The cells were used in the following experiments after three passages. The tumor‐LECs co‐culture system was established by plating 1 × 10⁶ tumor cells onto polyester filter inserts (0.4‐μm pore size; Corning, Corning, NY, USA). Tumor cells were incubated for 16 h at 37°C in a humidified atmosphere of 5% CO2 until attachment to the filters. The filters were then transferred to the confluent endothelial cell monolayer established on six‐well dishes, and incubated at 37°C in a humidified atmosphere of 5% CO2 for 3–5 days in 2 mL fresh ECGS‐free ECM.
Cell proliferation. LECs were resuspended in complete ECM and seeded at a concentration of 3 × 10⁴/mL onto 5 μg/cm2 fibronectin (Fn; Roche, Manheim, Germany)‐coated six‐well plates (1.5 mL/well). Cells were cultured at 37°C in a humidified atmosphere of 5% CO2 for 16 h and the medium was changed with Tca8113 CM and LNMTca8113 CM, respectively. After 48 h, 1 μCi of (3H)thymidine (ICN; 60 Ci/mM) was added into the medium, and cells were incubated for another 5 h. Then cells were harvested by 0.25% trypsin (Gibco). Incorporated radioactivity was determined by liquid scintillation counting according to the protocol’s recommendation.( 12 ) The experiments were repeated in six independent LEC cultures.
Lymphatic vessel tube formation assay. Two mL LEC suspension (2 × 10⁴/mL) was seeded in a well of a Fn‐coated six‐well plate at 37°C in a humidified atmosphere of 5% CO2. Following cell attachment, LECs were washed twice and cultured separately with Tca8113 CM and LNMTca8113 CM for 24 h. Lymphatic endothelial tube formation was observed under inverted phase‐contrast microscopy (Olympus, Osaka, Japan), and image analysis was performed with the MicroImage analysis system (Olympus). The experiments were repeated in six independent LEC cultures. The length of the tubules was assessed in five high pot field (HPF) per well by two independent observers and any disagreement was resolved by discussion and re‐evaluation of the wells. Results were expressed in μm as the mean total cell cord length ± SD per field.
Determination of apoptosis. Sub‐confluent LECs were co‐cultured with Tca8113 and LNMTca8113 cells, respectively, in ECGS‐free ECM for 24 h. The cells were then trypsinized, collected by centrifugation, and stained with fluorescein‐conjugated Annexin V and propidium iodide (BD Biosciences, San Jose, CA, USA) following the manufacturer’s instructions. After staining, cell apoptosis was determined by Annexin V‐PI staining using a FACSCalibur (BD Biosciences). Positive Annexin V‐stained cells were counted as apoptotic cells. Apoptosis assays were repeated in six independent LEC cultures.
Microarray and hybridization processing of expression data. Human Genome U133 Plus 2.0 GeneChip arrays were purchased from Affymetrix (Santa Clara, CA, USA). Total RNA of LNMLECs and TLECs was extracted using TRIzol reagent (Invitrogen, Carlsbad, CA, USA) and purified using the RNeasy mini‐kit (Qiagen, Valencia, CA, USA). According to the protocol supplied by the Affymetrix, cDNA was transcripted from 8 μg total RNA, using T7 Oligo dT‐primed polymerization with SuperScript II reverse transcriptase (Affymetrix one‐cycle cDNA Synthesis Kit). Biotinylated cRNA was fragmented to an average size of approximately 35–200 bp nucleotides. The quality of labeled cRNA was confirmed via test chips. Fifteen‐μg labeled cRNA was hybridized to the microarrays for 16 h at 42°C using the Affimetrix Hybridization Oven 640 (Affymetrix). After hybridization, slides were washed and scanned using the GeneArray 3000 Microarray Scanner (Affymetrix). The scanned array images were processed with GeneChip Operating Software (GCOS) (Affymetrix). Fluorescence intensities on scanned images were quantified, corrected for background noise, and normalized. Prior to performing data comparisons, we scaled the data with “All Probe Sets” and “Target Signal” at 100. With the application of the permutation‐based method, significance analysis of microarrays (SAM) to the signal data identified differentially expressed transcripts. Next, the gene list obtained from a class comparison between them was filtered to exclude genes expressing at low levels and to ensure a 2‐fold or higher change of expression between the two groups. After differentially expressed genes were selected, similarity metrics among genes were calculated on the basis of expression ratio measurements across LNMLECs and TLECs. Gene clustering was performed using an unsupervised hierarchical cluster analysis.( 13 , 14 )
Real‐time RT‐PCR analysis. According to the SLR (signal log ratio) and functional annotation of these genes in Entrez Gene, some molecules closely associated with cell migration were chosen for further validation using qRT‐PCR. Total RNA was extracted from cultured cells with the RNeasy Micro Kit (Qiagen) according to the manufacturer’s instructions. First‐strand cDNA was prepared from total RNA by reverse transcriptase (RevertAid First Strand cDNA Synthesis Kit; BI Fermentas, Opelstr, Germany) using oligo(dT) primers and qPCR was performed using SYBR Green I (Invitrogen) in a FTC2000 PCR detection system (Funglyn, Toronto, Canada). All reactions were performed in triplicate. Melting curve analyses were performed to ensure the specificity of qRT‐PCR. Primer sets used to test the expression of these candidate genes are listed in Table 1. Data analysis was performed using the 2−ΔΔCt method described previously, where GAPDH was used as the reference gene.( 15 )
Table 1.
Names of genes and primer sequences for the SYBR‐green‐based real‐time RT‐PCR
| Genes | Forward primers | Reverse primers |
|---|---|---|
| CXCL1 | CAAACCGAAGTCATAGCCACAC | GTTATTTTTATCACTGTTCAGCAT |
| CXCL2 | CAAACCGAAGTCATAGCCACAC | CAGTTGGATTTGCCATTTTTCAG |
| CXCL3 | CAAACCGAAGTCATAGCCACAC | GTGCTCCCCTTGTTCAGT |
| CXCL5 | TGAGAGAGCTGCGTTGCGT | GGAGGCTACCACTTCCACCTT |
| CXCL6 | TGACAGAGCTGCGTTGCAC | GGAGGCTACCACTTCCACCTT |
| CCL2 | CTCAGCCAGATGCAATCAAT | CACTTGCTGCTGGTGATTCT |
| CCL7 | GCTCAGCCAGTTGGGATTA | CAGTTTGGTCTTGAAGATTACAG |
| CCL20 | CGAATCAGAAGCAGCAAGCAA | GCATTGATGTCACAGCCTTCAT |
| GAPDH | CCTCAAGATCATCAGCAAT | CCATCCACAGTCTTCTGGGT |
CCL, chemokine [C–C motif] ligand; CXCL, Chemokine [oC–X–C motif] ligand.
Chemokine enzyme‐linked immunosorbent assay (ELISA). Sub‐confluent LECs were co‐cultured with Tca8113 and LNMTca8113 cells respectively for 4 days, then washed with serum and ECGS‐free ECM supplemented with 1% penicillin and streptomycin. Cells were then incubated in serum and ECGS‐free medium for 24 h, and the CM from each well was collected and stored at −80°C until use. The level of vascular endothelial growth factor (VEGF), VEGF‐C, VEGF‐D, Chemokine [oC–X–C motif] ligand CXCL1, CXCL5, CXCL6, chemokine [C–C motif] ligand CCL2, CCL7, and CCL20 in cell culture supernatants was determined with the Quantikine human sandwich ELISA kit (all from R&D Systems, Minneapolis, MN, USA), according to the protocol supplied by the manufacturer. The level of each chemokine and growth factor was assayed in three independent wells.
Western blot analyses. Tca8113 cells were grown to 80% confluence, and homogenized in lysis buffer consisting of 0.125 M Tris‐Cl (pH 6.8), 2% SDS, 2.5%‐mercaptoethanol, and 10% glycerol. Ten μg of protein per sample was loaded onto the SDS–polyacrylamide gel, subjected to electrophoresis, and transferred onto nitrocellulose membranes (Bio‐Rad Laboratories, Hercules, CA, USA) After blocking of the membrane in 5% skim milk in Tris‐buffered saline containing 0.1% Tween 20 for 1 h, membranes were cut and strips were incubated overnight at 4°C with the following Abs separately: mouse anti‐interleukin (IL)‐8RA, ‐IL‐8RB, or goat anti‐CCR1, ‐CCR2, ‐CCR4, ‐CCR6 (200 μg/mL, final dilution 1:200 each; Santa Cruz Biotechnology, Santa Cruz, CA, USA). Membranes were washed thrice before incubation with recommended secondary antibodies (Santa Cruz Biotechnology) for 1 h at room temperature. Protein bands were visualized by chemiluminescence (Amersham, Buckinghamshire, UK).( 16 )
Fluorescence‐based migration assay. Cancer cell migration was assessed using the Chemotaxis Cell Migration Assays kit (Millipore, Billerica, MA, USA) following the manufacturer’s instructions. Briefly, TLEC CM, LNMLEC CM, and LNMLEC CM supplemented with neutralizing antibodies including CXCL1 (15 μg/mL), CXCL1/2/3 (1 μg/mL), CXCL5 (1 μg/mL), CXCL6 (4 μg/mL), CCL2 (4.5 μg/mL), CCL7 (60 μg/mL), and CCL20 (1 μg/mL) (all from R&D Systems), were added to the lower chamber of a 96‐well plate. Tca8113 cells were harvested by 0.5 mM EDTA and re‐suspended at 2 × 10⁵ cells/mL in serum and ECGS‐free ECM. A total of 2 × 10⁴ cells was added into the upper chamber and allowed to migrate through the membrane with 8‐μm pores for 24 h at 37°C and 5% CO2 atmosphere. Cells that migrated through the membrane were detached and labeled with CyQuant GR Dye, and fluorescence was measured using a fluorescent plate reader with an excitation wavelength of 480 nm and an emission wavelength of 520 nm. Additionally, CXC Chemokine receptor 2 (CXCR2) expressed on the surface of Tca8113 cells was blocked with CXCR2 neutralizing antibodies (5 μg/mL). After the blocking, the migration of Tca8113 cells was also assayed using the same method. Each condition was repeated in three independent wells.
Statistics. Data were analyzed with SPSS 11.0 software (SPSS, Chicago, IL, USA). Mean values between two groups were compared using the Student’s unpaired t‐test. All P‐values were given for two‐sided testing, and statistical significance was defined as P < 0.05.
Results
In vitro behavior of LECs co‐cultured with Tca8113 and LNMTca8113 cells. To investigate the behaviors of LNMLECs in vitro, cell proliferation, tube formation, and resistance to apoptosis were compared with TLECs. In contrast to TLECs, thymidine incorporation into the DNA of LNMLECs increased moderately (Tca8113 CM, 645.60 ± 94.95 count per minute (CPM), LNMTca8113 CM, 877.47 ± 41.87 CPM; P = 0.017) (Fig. 1a). This result indicated that the proliferation activity of LNMLECs was moderately higher than that of TLECs. After LECs were co‐cultured with LNMTca8113 CM and Tca8113 CM for 24 h, lymphatic endothelial tube formation assay confirmed that lymphangiogenesis could be enhanced by addition of LNMTca8113 CM (LNMTca8113 CM, 393.16 ± 13.62 μm tube length × per field; Tca8113 CM 330.93 ± 11.53 μm tube length × per field; P = 0.012) (Fig. 1b). Additionally, we further quantified the number of apoptotic cells in LNMTca8113 and Tca8113‐induced LECs using flow cytometry, and confirmed that these cells were equal in resisting ECGS starvation‐induced apoptosis (apoptosis rate: 2.9 ± 0.3%, 3.1 ± 0.5% respectively; P = 0.701) (Fig. 1c). Our results suggested that LECs induced by highly metastatic tongue cancer cells had distinct biologic behaviors. Therefore, global gene expression patterns of LECs were further analyzed using a cDNA microarray approach.
Figure 1.
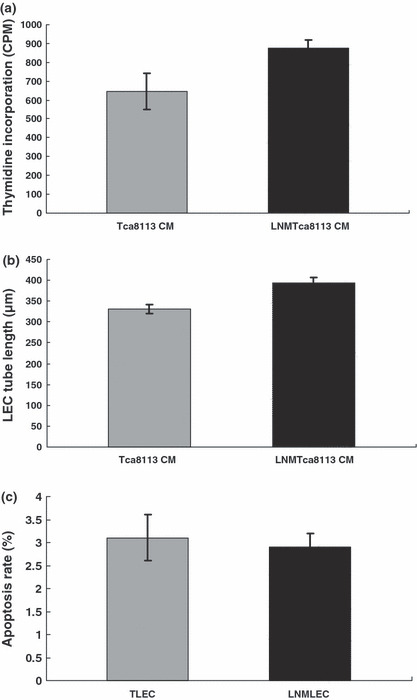
Lymphatic endothelial cells (LECs) induced by LNMTca8113 cells and Tca8113 cells displayed different biologic behaviors. (a) LEC proliferation. LEC proliferation was determined by (3H)thymidine incorporation into the cell DNA. In contrast to Tca8113‐stimulated LECs (TLECs), the proliferation activity of LNMTca8113‐stimulated LECs (LNMLECs) increased moderately (P = 0.017). (b) Lymphangiogenesis. By the measurement of the length of tubules, it was confirmed that lymphangiogenesis could be enhanced by addition of LNMTca8113 conditioned medium (CM) (P = 0.012). (c) LEC apoptosis. The number of apoptotic LECs was determined by Annexin V‐PI staining using a FACSCalibur. The results showed that LNMLECs and TLECs were equal in resisting endothelial cell growth supplement (ECGS) starvation‐induced apoptosis (P = 0.701).
Specific expression profiling of LNM LECs and TLECs. A total of 496 unique genes had a 2‐fold or higher change of expression between the two groups: 296 were over‐expressed and 200 were under‐expressed in LNMLECs. These genes were related to cell adhesion, angiogenesis, cell apoptosis, cell motility, cell development, signal transduction, immune response, cell metabolism, and so on (partly shown in 2, 3). All of the genes that met the restriction are shown in the Supporting Information. To display the similarity of genes between TLECs and LNMLECs, hierarchical clustering was performed, which graphically displayed the varying expression patterns.
Table 2.
Genes that are up‐regulated in LNMLECs
| UniGene ID | Gene symbol | Gene function | Cytoband | SLR |
|---|---|---|---|---|
| Hs.525607 | TNFAIP2 | Angiogenesis | chr14q32 | 1.6 |
| Hs.468675 | PDPN | Lymphangiogenesis | chr1p36.21 | 1.1 |
| Hs.515126 | ICAM1 | Cell–cell adhesion | chr19p13.3 | 1.1 |
| Hs.434971 | TRO | Cell adhesion | chrXp11.22 | 3.4 |
| Hs.570065 | COL4A3 | Cell adhesion | chr2q36 | 3.9 |
| Hs.436657 | CLU | Apoptosis | chr8p21 | 1.9 |
| Hs.591785 | IER3 | Apoptosis | chr6p21.3 | 1 |
| Hs.514913 | SERPINB2 | Anti‐apoptosis | chr18q21.3 | 4.1 |
| Hs.271955 | TNFAIP8 | Anti‐apoptosis | chr5q23.1 | 1 |
| Hs.134830 | COL8A1 | Cell adhesion | chr3q12.3 | 1 |
| Hs.567276 | GPC3 | Morphogenesis | chrXq26.1 | 4 |
| Hs.590919 | ADAMTS3 | Collagen catabolism | chr4q13.3 | 1.8 |
| Hs.382202 | CHI3L1 | Arbohydrate metabolism | chr1q32.1 | 5.7 |
| Hs.34012 | BRCA2 | Regulation of progression | chr13q12.3 | 1 |
| Hs.128518 | EFNA5 | Cell–cell signaling | chr5q21 | 1.2 |
| Hs.303649 | CCL2 | Chemotaxis | chr17q11.2 | 2.8 |
| Hs.75498 | CCL20 | Chemotaxis | chr2q33 | 3.1 |
| Hs.251526 | CCL7 | Chemotaxis | chr17q11.2 | 2.5 |
| Hs.789 | CXCL1 | Chemotaxis | chr4q21 | 4.2 |
| Hs.590921 | CXCL2 | Chemotaxis | chr4q21 | 4.3 |
| Hs.89690 | CXCL3 | Chemotaxis | chr4q21 | 4.3 |
| Hs.89714 | CXCL5 | Chemotaxis | chr4q12‐q13 | 4.3 |
| Hs.164021 | CXCL6 | Chemotaxis | chr4q21 | 4 |
Gene symbols and descriptions are derived from the NCBI UniGene database. Expression ratios refer to LNMTca8113‐stimulated lymphatic endothelial cells (LNMLECs) versus Tca8113‐stimulated LECs (TLECs). Function is derived from the SOURCE database and published literature. SLR, signal log ratio.
Table 3.
Genes that are down‐regulated in LNMLEC
| UniGene ID | Gene symbol | Gene function | Cytoband | SLR |
|---|---|---|---|---|
| Hs.34341 | CD58 | Cell–cell adhesion | chr1p13 | 1.6 |
| Hs.473417 | CXADR | Cell adhesion | chr21q21.1 | 1.2 |
| Hs.591210 | ITGBL1 | Cell adhesion | chr13q33 | 1.4 |
| Hs.293917 | PVRL3 | Cell adhesion | chr3q13 | 1.1 |
| Hs.590881 | JAG1 | Angiogenesis | chr20p12.1 | 1.2 |
| Hs.485572 | SOCS2 | Anti‐apoptosis | chr12q | 1.3 |
| Hs.170009 | TGFA | Regulation of progression | chr2p13 | 1.1 |
| Hs.189825 | KIAA1244 | Regulation of signal transduction | chr6q23.3 | 1.3 |
| Hs.148670 | RHOBTB1 | Small GTPase‐mediated signal transduction | chr10q21.2 | 1.1 |
| Hs.470646 | RAPGEF4 | Small GTPase‐mediated signal transduction | chr2q31 | 1 |
| Hs.269775 | MAP3K7IP2 | Positive regulation of NF‐kappa B cascade | chr6q25.1 | 1.9 |
| Hs.444975 | PLAGL1 | Cell cycle | chr6q24 | 1 |
| Hs.79347 | ZNF592 | Transcription | chr15q25.3 | 5.9 |
| Hs.184523 | STK38L | Protein kinase cascade | chr12p11.23 | 1 |
| Hs.174312 | TLR4 | Activation of NF‐kappa B‐inducing kinase | chr9q32 | 1.1 |
| Hs.591873 | IL7 | Negative regulation of apoptosis | chr8q12 | 1 |
| Hs.133397 | ITGA6 | Cell–matrix adhesion | chr2q31.1 | 1.1 |
| Hs.533317 | VIM | Cell motility | chr10p13 | 1.4 |
Gene symbols and descriptions are derived from the NCBI UniGene database. Expression ratios refer to LNMTca8113‐stimulated lymphatic endothelial cells (LNMLECs) versus Tca8113‐stimulated LECs (TLECs). Function is derived from the SOURCE database and published literature. SLR, signal log ratio.
Quantitative PCR validation of differentially expressed genes selected from the microarray data. The results of gene microarrays showed that after LECs were induced by tongue cancer cells, they differentially expressed chemokines, including CXCL1, CXCL2, CXCL3, CXCL5, CXCL6, CCL2, CCL7, and CCL20. To obtain truly comparable results, we used the unamplified total RNA as the template, and the number of amplifications was no more than 40 cycles. In LNMLECs, expression of six genes was markedly up‐regulated, including CXCL1 (32‐fold), CXCL5 (32‐fold), CCL2 (17.959‐fold), CCL7 (35.919‐fold), and CXCL6 (22.627‐fold). Additionally, quantitative expression of three genes, including CXCL2 (1‐fold), CXCL3 (4.489‐fold), and CCL20 (1.259‐fold), moderately increased in LNMTLECs (Fig. 2a).
Figure 2.
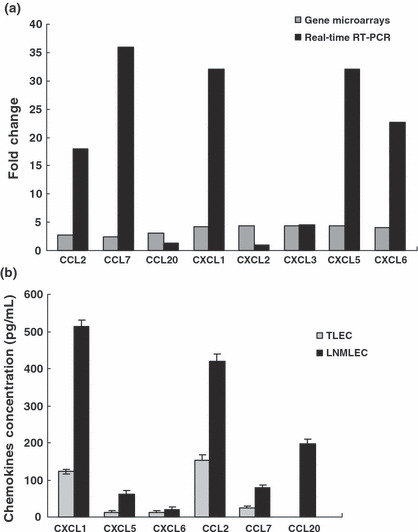
Differential expressions of the chemokines between LNMTca8113‐stimulated lymphatic endothelial cells (LNMLECs) and Tca8113‐stimulated LECs (TLECs) were assayed by gene microarrays, real‐time PCR, and ELISA. (a) Gene expressions of the chemokines in LNMLECs were distinct from that in TLECs. (b) LNMLECs secreted significantly higher levels of chemokines. Chemokine concentrations are reported as pg/mL per 100 000 cells. Mean values between two groups were compared using the t‐test. *P < 0.05.
LNMTca8113 secreted higher levels of VEGF‐A, ‐C and had a positive effect on proliferation and tube formation of LECs. Our previous microarray data indicated that Tca8113 cells and LNMTca8113 cells may have differentially expressed VEGF‐A, ‐C, and ‐D at the protein level, which was mainly responsible for the LEC proliferation and lymphangiogenesis.( 11 ) Thus, the concentration of VEGF‐A, C‐, and ‐D in the two conditioned media was assayed by ELISA. The results showed that Tca8113 cells could secrete VEGF‐A (864.257 ± 106.379 pg/mL), VEGF‐C (1782.613 ± 112.845 pg/mL), and VEGF‐D (203.669 ± 47.512 pg/mL). In contrast to Tca8113 cells, LNMTca8113 cells secreted significantly higher levels of VEGF‐A and VEGF‐C but not VEGF‐D (VEGF‐A, 1289.843 ± 96.545 pg/mL, P < 0.05; VEGF‐C, 2173.178 ± 126.743 pg/mL, P < 0.05; VEGF‐D, 194.327 ± 56.943 pg/mL, P > 0.05).
LNMLECs secreted higher levels of chemokines and had a stronger effect on the migration of tongue cancer cells compared with TLECs. To identify the role of LECs in OTSCC metastasis, CXCL1, CXCL5, CXCL6, CCL2, CCL7, and CCL20 secreted from LNMLECs and TLECs were determined by ELISA. As expected, TLECs were significant sources of chemokines (CXCL1, 122.752 ± 5.921 pg/mL; CXCL5, 11.556 ± 6.125 pg/mL; CXCL6, 13.183 ± 3.286 pg/mL; CCL2, 143.102 ± 14.668 pg/mL; CCL7, 24.487 ± 4.106 pg/mL). However, CCL20 failed to produce signals. Compared with TLECs, LNMLECs secreted significantly higher levels of chemokines (CXCL1, 513.671 ± 16.121 pg/mL; CXCL5, 62.081 ± 8.902 pg/mL; CXCL6, 20.919 ± 7.261 pg/mL; CCL2, 419.812 ± 19.209 pg/mL; CCL7, 80.237 ± 7.353 pg/mL; CCL20, 198.047 ± 12.202 pg/mL; mean ± SD) (Fig. 2b). To confirm that LNMLECs could induce enhanced migration of tongue cancer cells compared with TLECs, Tca8113 cells were placed in the upper chamber. The CM (24 h) from LNMLECs and TLECs were used as chemoattractants, and Tca8113 cell migration was measured after 24 h. Results showed that the CM could stimulate the migration of Tca8113 cells, and the migration was promoted by LNMLECs. (TLEC CM, 135.15 ± 15.66; LNMLEC CM, 266.82 ± 28.08; mean ± SD) (Fig. 3a).
Figure 3.
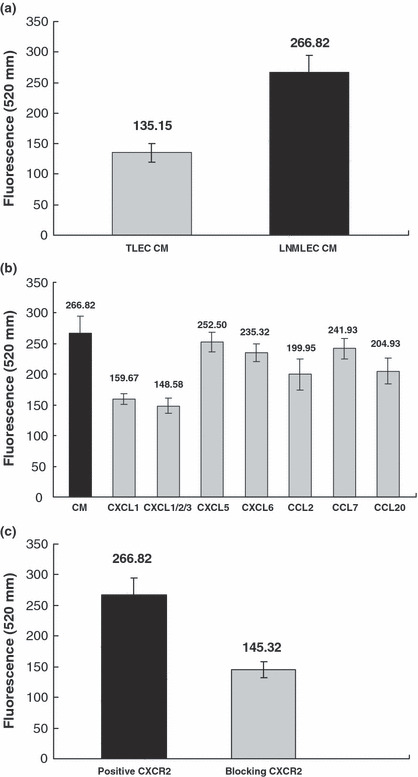
Chemokines secreted by LNMTca8113‐stimulated lymphatic endothelial cells (LNMLECs) were chemoattractants for tongue cancer cells and stimulated cell migration. (a) LNMLEC conditioned medium (CM) promoted the migration of Tca8113 cells (*P < 0.05). (b) LNMLEC CM‐induced migration was markedly attenuated with the presence of anti‐CXCL1 and CXCL1/2/3 neutralizing antibody. *P < 0.05 versus CXCL1, CXCL1/2/3, CCL2, CCL20. **P > 0.05 versus CXCL5, CXCL6, CCL7. (c) After the CXCR2 of Tca8113 cells was blocked, LNMLEC CM‐induced migration was significantly attenuated (*P < 0.05).
CXCL1 secreted by LNMLECs was a potent regulator of tongue cancer cell migration. To further understand the role of chemokines in tongue cancer cell migration, we used a 96‐well migration assay with decreasing concentrations of chemokines as chemoattractants. Compared with LNMLEC CM, chemokine‐induced migration was partially attenuated with the presence of neutralizing antibodies, including CXCL1, CXCL1/2/3, CXCL5, CXCL6, CCL2, CCL7, and CCL20 (CXCL1, 159.667 ± 8.649; CXCL1/2/3, 148.583 ± 12.213; CXCL5, 252.5 ± 16.314; CXCL6, 235.317 ± 13.877; CCL2, 199.95 ± 25.414; CCL7, 241.933 ± 16.451; CCL20, 204.933 ± 20.975; mean fluorescence ± SD) (Fig. 3b). CXCL2 and CXCL3 were not assayed in LEC CM, because we could not obtain corresponding ELISA kits. However, their secretion in LNMLEC CM could not be completely excluded. CXCL1/2/3 antibody, which could neutralize the biologic activity of CXCL1, CXCL2, and CXCL3, was used to exclude the interference of CXCL2 and CXCL3. Our results showed that the cancer cell migration was markedly attenuated with the presence of anti‐CXCL1 and anti‐CXCL1/2/3 neutralizing antibody (Fig. 3b), indicating that CXCL1 played an important role in tongue cancer cell migration induced by LNMLEC CM. Then, the relative receptors of chemokines differentially expressed by LNMLECs and TLECs were assayed by Western blot analyses, including CCR1, CCR2, CCR6, CCR4, CXCR1, and CXCR2 (information retrieved from Entrez Gene). The results showed that only CXCR2 was expressed by Tca8113 cells. After blocking the CXCR2 of Tca8113 cells, cell migration induced by LNMLEC CM was significantly suppressed (positive CXCR2, 266.82 ± 28.08; blocking CXCR2, 145.32 ± 13.47; mean ± SD), suggesting that the interaction of CXCL1 and CXCR2 mediated the OTSCC cell migration (Fig. 3c).
Discussion
Lymphangiogenesis is an emerging concept and the mechanisms have not been elucidated up to now.( 17 ) At present, it is known that cancer cells could secrete soluble factors to simulate the formation of lymphatic vessels, by which cancer cells successfully disseminate.( 18 ) Several reports have shown that unlike lymphatic vessels in normal tissue, the average diameter and density of lymphatic vessels (LVD) in OTSCC significantly increased, and statistical analysis demonstrated that higher LVD had a close association with an increased risk of lymphatic dissemination.( 6 , 19 , 20 ) Additionally, inhibition of lymphangiogenesis‐related properties of LECs would reduce the risk of lymph node metastasis of cancer cells.( 21 ) These results indicated that cancer‐induced lymphangiogenesis may be essential for secondary lymphatic spread. However, the function of LECs in lymphatic spread should not be neglected.
Recent studies have shown that LECs are not only responsible for the recruitment of leucocytes into the lymphatics, but are also important for cancer lymphatic metastasis. LECs could secrete different chemokines and express receptors in the surface, including CCL21, CCL20, lymphatic vessel endothelial HA receptor 1 (LYVE‐1), mannose receptor (MR), and common lymphatic endothelial and vascular endothelial receptor 1 (CLEVER‐1), which are involved in the binding and trafficking of cancer cells into lymphatic vessels.( 22 , 23 , 24 , 25 ) Moreover, a few studies demonstrated that tumor‐derived LECs possessed distinct and specific phenotypes. For example, they have enhanced abilities of lymphangiogenesis, migration, and adhesion, and could express special molecules to mediate the lymphatic dissemination of cancer cells, such as CXCR4.( 26 , 27 ) Therefore, it is hypothesized that the phenotypes of LECs could be induced by cancer cells to meet the lymphatic dissemination of cancer cells.
During cancer progression, tumor cells switch from poorly metastatic cells to highly metastatic cells.( 28 , 29 ) However, it is unclear whether the specific phenotypes of LECs induced by cancer cells have a positive influence on the lymphatic metastasis of cancer cells. In the present study, LECs were co‐cultured with Tca8113 and LNMTca8113 cells, which were successfully established by an animal model and reflected the progressive process of tongue cancer cells. After 3–5 days, we investigated the biologic behaviors of LNMLECs and TLECs in vitro. In contrast to TLECs, LNMECs were more proliferative and had enhanced ability to organize capillary‐like structures in the absence of ECGS. However, LNMLECs did not show increased resistance to apoptosis induced by ECGS starvation. This data indicated that tongue cancer cells with different potential of lymphatic metastasis could promote the alteration of LECs phenotypes. However, the mechanisms that govern these biological changes were still obscure. Thus, we studied whether the concentration of lymphangiogenic factors secreted by Tca8113 and LNMTca8113 cells was different. Our previous data demonstrated that there were no differentially expressed lymphangiogenic factors besides VEGF‐A, ‐C, and ‐D.( 11 ) Our results showed that LNMTca8113 cells could secrete more VEGF‐A and ‐C than Tca8113 cells, indicating that VEGF‐A and ‐C might be mainly responsible for the alteration of LECs phenotypes induced by LNMTca8113 cells.
To explore the differences between LNMLECs and TLECs at the molecular level, we studied the transcriptional changes using Affymetrix gene chips, and identified large numbers of differentially expressed genes. The results showed that approximately 496 genes had a 2‐fold or greater change in LNMLECs compared with TLECs, and some of these genes had functions related to apoptosis, angiogenesis, cell growth, cell adhesion, and so on. These results further confirmed that specific phenotypes of LECs could be induced by tongue cancer cells with different potential of lymphatic metastasis.
Lymphatic metastasis is a continuous and complicated process.( 30 , 31 ) In this process, the chemotaxis is an essential component of tumor cell trafficking and metastasis. It is assumed that cancer cells actively crawl towards blood and lymphatic vessels, following attractant molecules gradients formed by endothelial cells.( 32 , 33 ) LECs could secrete many chemokines, which were postulated to be potent stimulators of cancer cells’ migration to lymphatic vessels.( 10 , 22 ) Therefore, identifying the key chemokines secreted by tumor‐derived LECs is helpful in understanding the function of LECs in tumor biology and may lead to the identification of novel therapeutic targets. In this article, the results showed that LNMLECs and TLECs differentially expressed chemokines, including CXCL1, CXCL2, CXCL3, CXCL5, CXCL6, CCL2, CCL7, and CCL20. Thus, our data suggested that LECs in tumors might be involved in directing the migration of cancer cells and had an active role in lymphatic metastasis.( 10 , 20 )
In our study, differential expression of chemokines was validated by quantitative real‐time RT‐PCR. Among them, CXCL1, CXCL5, CXCL6, CCL2, CCL7, and CCL20 expressions in LNMLECs and TLECs were also confirmed using ELISA. These genes were up‐regulated both at the mRNA and protein level in LNMLECs, which indicated that LECs induced by highly metastatic cancer cells could secrete more chemokines to facilitate the directed migration of tongue cancer cells. More and more evidence suggested that directed movement caused by chemokines was required for tumor metastasis. For example, CCL2 regulated invasion and migration of cancer cells by binding to chemokine receptor CCR4;( 34 , 35 ) CCL20/CCR6 ligand‐receptor was involved in liver metastasis of colorectal cancer;( 36 ) CXCL2 provoked a dose‐dependent increase of cell migration and a most pronounced cell adhesion in vitro;( 37 ) high expression of CXCL5 in gastric cancer resulted in lymph node metastasis;( 38 ) and CXCL6 had an important role in the growth and metastasis of small‐cell lung cancer.( 39 )
OTSCC cells have affinity with the lymphatic vessels, and it is questioned whether LECs in tumor play an important role in guiding cancer cell migration to lymphatic vessels. Our results showed that the CM from LNMLECs and TLECs stimulated the migration of Tca8113 cells, and the migration was promoted by LNMLEC CM. Moreover, LNMLEC CM‐induced migration was attenuated with the presence of neutralizing antibodies, especially for CXCL1. According to Entrez Gene, we studied the expression of relative chemokine receptors, including CCR1, CCR2, CCR4, CCR6, CXCR1, and CXCR2. The results showed that only CXCR2 was positively expressed by Tca8113 cells, indicating that other differentially expressed chemokines had a minor role in the cell migration, and CXCL1, the ligand of CXCR2, had more influence on this process. When the CXCR2 of Tca8113 cells was blocked, LNMLEC CM‐induced migration was indeed attenuated. Thus, CXCL1 secreted by LNMLECs was responsible for this process by interaction with the CXCR2 of Tca8113 cells.
In conclusion, we demonstrated an important role of tumor‐derived LECs in the pathogenesis of tongue cancer lymphatic metastasis. Tongue cancer cells with high metastatic potential induced changes in the LEC phenotype, such as biologic behaviors and gene expression. Moreover, cancer‐induced LECs could secrete many chemokines to guide the migration of tongue cancer cells to the lymphatic system. Therefore, phenotypes and the functional status of LECs in OTSCC might be a positive factor in lymphatic dissemination and should be studied in detail.
Disclosure Statement
There was no conflict interest regarding this article.
Supporting information
Appendix S1. All the genes had a 2‐fold or higher change of expression between the LNMTca8113‐stimulated lymphatic endothelial cells (LNMLECs) and Tca8113‐stimulated LECs (TLECs).
Please note: Wiley‐Blackwell are not responsible for the content or functionality of any supporting materials supplied by the authors. Any queries (other than missing material) should be directed to the corresponding author for the article.
Supporting info item
Acknowledgments
We would like to thank Professor Yuming Wen for critical comments on the manuscript. This work was supported by China National Science Foundation grants to Zhang Zhuang and Pan Jian (contract grant number: 30901690, 30400505).
Z. Zhuang and P. Jian contributed equally to this work.
References
- 1. Harvey NL, Oliver G. Choose your fate: artery, vein or lymphatic vessel? Curr Opin Genet Dev 2004; 14: 499–505. [DOI] [PubMed] [Google Scholar]
- 2. Baldwin ME, Stacker SA, Achen MG. Molecular control of lymphangiogenesis. Bioessays 2002; 24: 1030–40. [DOI] [PubMed] [Google Scholar]
- 3. Pepper MS. Lymphangiogenesis and tumor metastasis: myth or reality? Clin Cancer Res 2001; 7: 462–8. [PubMed] [Google Scholar]
- 4. Spiro RH, Huvos AG, Wong GY, Spiro JD, Gnecco CA, Strong EW. Predictive value of tumor thickness in squamous carcinoma confined to the tongue and floor of the mouth. Am J Surg 1986; 152: 345–50. [DOI] [PubMed] [Google Scholar]
- 5. Myers JN, Greenberg JS, Mo V, Roberts D. Extracapsular spread. A significant predictor of treatment failure in patients with squamous cell carcinoma of the tongue. Cancer 2001; 92: 3030–6. [DOI] [PubMed] [Google Scholar]
- 6. Franchi A, Gallo O, Massi D, Baroni G, Santucci M. Tumor lymphangiogenesis in head and neck squamous cell carcinoma: a morphometric study with clinical correlations. Cancer 2004; 101: 973–8. [DOI] [PubMed] [Google Scholar]
- 7. Munoz‐Guerra MF, Marazuela EG, Martin‐Villar E, Quintanilla M, Gamallo C. Prognostic significance of intratumoral lymphangiogenesis in squamous cell carcinoma of the oral cavity. Cancer 2004; 100: 553–60. [DOI] [PubMed] [Google Scholar]
- 8. Xuan M, Fang YR, Wato M, Hata S, Tanaka A. Immunohistochemical co‐localization of lymphatics and blood vessels in oral squamous cell carcinomas. J Oral Pathol Med 2005; 34: 334–9. [DOI] [PubMed] [Google Scholar]
- 9. Clasper S, Royston D, Baban D et al. A novel gene expression profile in lymphatics associated with tumor growth and nodal metastasis. Cancer Res 2008; 68: 7293–303. [DOI] [PubMed] [Google Scholar]
- 10. Zhuang Z, Jian P, Longjiang L, Bo H, Hongwei Z. Identification of oral cancer cell‐induced changes in gene expression profile of lymphatic endothelial cell. Cancer Invest 2008; 26: 1002–7. [DOI] [PubMed] [Google Scholar]
- 11. Zhuang Z, Jian P, Longjiang L, Bo H, Wenlin X. Oral cancer cells with different potential of lymphatic metastasis displayed distinct biologic behaviors and gene expression profiles. J Oral Pathol Med 2009. Aug 12 [Epub ahead of print]. [DOI] [PubMed] [Google Scholar]
- 12. Ikuta T, Ariga H, Matsumoto K. Extracellular matrix tenascin‐X in combination with vascular endothelial growth factor B enhances endothelial cell proliferation. Genes Cells 2000; 5: 913–27. [DOI] [PubMed] [Google Scholar]
- 13. O’Donnell RK, Kupferman M, Wei SJ et al. Gene expression signature predicts lymphatic metastasis in squamous cell carcinoma of the oral cavity. Oncogene 2005; 24: 1244–51. [DOI] [PubMed] [Google Scholar]
- 14. Van‘t Veer LJ, Dai H, Van De Vijver MJ et al. Gene expression profiling predicts clinical outcome of breast cancer. Nature 2002; 415: 530–6. [DOI] [PubMed] [Google Scholar]
- 15. Hirakawa S, Hong YK, Harvey N et al. Identification of vascular lineage‐specific genes by transcriptional profiling of isolated blood vascular and lymphatic endothelial cells. Am J Pathol 2003; 162: 575–86. [DOI] [PMC free article] [PubMed] [Google Scholar]
- 16. Bazarbachi A, Abou Merhi R, Gessain A et al. Human T‐cell lymphotropic virus type I‐infected cells extravasate through the endothelial barrier by a local angiogenesis‐like mechanism. Cancer Res 2004; 64: 2039–46. [DOI] [PubMed] [Google Scholar]
- 17. Luttun A, Carmeliet P. Angiogenesis and lymphangiogenesis: highlights of the past year. Curr Opin Hematol 2004; 11: 262–71. [DOI] [PubMed] [Google Scholar]
- 18. Shintani S, Li C, Ishikawa T, Mihara M, Nakashiro K, Hamakawa H. Expression of vascular endothelial growth factor A, B, C, and D in oral squamous cell carcinoma. Oral Oncol 2004; 40: 13–20. [DOI] [PubMed] [Google Scholar]
- 19. Nakayama A, Ogawa A, Fukuta Y, Kudo K. Relation between lymphatic vessel diameter and clinicopathologic parameters in squamous cell carcinomas of the oral region. Cancer 1999; 86: 200–6. [DOI] [PubMed] [Google Scholar]
- 20. Pepper MS, Skobe M. Lymphatic endothelium: morphological, molecular and functional properties. J Cell Biol 2003; 163: 209–13. [DOI] [PMC free article] [PubMed] [Google Scholar]
- 21. Nakamura ES, Koizumi K, Kobayashi M, Saiki I. Inhibition of lymphangiogenesis‐related properties of murine lymphatic endothelial cells and lymph node metastasis of lung cancer by the matrix metalloproteinase inhibitor MMI270. Cancer Sci 2004; 95: 25–31. [DOI] [PMC free article] [PubMed] [Google Scholar]
- 22. Kriehuber E, Breiteneder‐Geleff S, Groeger M et al. Isolation and characterization of dermal lymphatic and blood endothelial cells reveal stable and functionally specialized cell lineages. J Exp Med 2001; 194: 797–808. [DOI] [PMC free article] [PubMed] [Google Scholar]
- 23. Mancardi S, Vecile E, Dusetti N et al. Evidence of CXC, CC and C chemokine production by lymphatic endothelial cells. Immunology 2003; 108: 523–30. [DOI] [PMC free article] [PubMed] [Google Scholar]
- 24. Irjala H, Alanen K, Grenman R, Heikkila P, Joensuu H, Jalkanen S. Mannose receptor (MR) and common lymphatic endothelial and vascular endothelial receptor (CLEVER)‐1 direct the binding of cancer cells to the lymph vessel endothelium. Cancer Res 2003; 63: 4671–6. [PubMed] [Google Scholar]
- 25. Jackson DG, Prevo R, Clasper S, Banerji S. LYVE‐1, the lymphatic system and tumor lymphangiogenesis. Trends Immunol 2001; 22: 317–21. [DOI] [PubMed] [Google Scholar]
- 26. Yu H, Zhou HZ, Wang CM, Gu XM, Pan BR. Effect of hepatoma H22 on lymphatic endothelium in vitro . World J Gastroenterol 2004; 10: 3428–32. [DOI] [PMC free article] [PubMed] [Google Scholar]
- 27. Irigoyen M, Anso E, Martinez E, Garayoa M, Martinez‐Irujo JJ, Rouzaut A. Hypoxia alters the adhesive properties of lymphatic endothelial cells. A transcriptional and functional study. Biochim Biophys Acta 2007; 1773: 880–90. [DOI] [PubMed] [Google Scholar]
- 28. Minn AJ, Gupta GP, Siegel PM et al. Genes that mediate breast cancer metastasis to lung. Nature 2005; 436: 518–24. [DOI] [PMC free article] [PubMed] [Google Scholar]
- 29. Clark EA, Golub TR, Lander ES, Hynes RO. Genomic analysis of metastasis reveals an essential role for RhoC. Nature 2000; 406: 532–5. [DOI] [PubMed] [Google Scholar]
- 30. Achen MG, McColl BK, Stacker SA. Focus on lymphangiogenesis in tumor metastasis. Cancer Cell 2005; 7: 121–7. [DOI] [PubMed] [Google Scholar]
- 31. Achen MG, Stacker SA. Molecular control of lymphatic metastasis. Ann N Y Acad Sci 2008; 1131: 225–34. [DOI] [PubMed] [Google Scholar]
- 32. Condeelis J, Pollard JW. Macrophages: obligate partners for tumor cell migration, invasion, and metastasis. Cell 2006; 124: 263–6. [DOI] [PubMed] [Google Scholar]
- 33. Chambers AF, Groom AC, MacDonald IC. Dissemination and growth of cancer cells in metastatic sites. Nat Rev Cancer 2002; 2: 563–72. [DOI] [PubMed] [Google Scholar]
- 34. Loberg RD, Ying C, Craig M, Yan L, Snyder LA, Pienta KJ. CCL2 as an important mediator of prostate cancer growth in vivo through the regulation of macrophage infiltration. Neoplasia 2007; 9: 556–62. [DOI] [PMC free article] [PubMed] [Google Scholar]
- 35. Ishida T, Ueda R. CCR4 as a novel molecular target for immunotherapy of cancer. Cancer Sci 2006; 97: 1139–46. [DOI] [PMC free article] [PubMed] [Google Scholar]
- 36. Rubie C, Oliveira V, Kempf K et al. Involvement of chemokine receptor CCR6 in colorectal cancer metastasis. Tumour Biol 2006; 27: 166–74. [DOI] [PubMed] [Google Scholar]
- 37. Kollmar O, Scheuer C, Menger MD, Schilling MK. Macrophage inflammatory protein‐2 promotes angiogenesis, cell migration, and tumor growth in hepatic metastasis. Ann Surg Oncol 2006; 13: 263–75. [DOI] [PubMed] [Google Scholar]
- 38. Park JY, Park KH, Bang S et al. CXCL5 overexpression is associated with late stage gastric cancer. J Cancer Res Clin Oncol 2007; 133: 835–40. [DOI] [PubMed] [Google Scholar]
- 39. Zhu YM, Bagstaff SM, Woll PJ. Production and upregulation of granulocyte chemotactic protein‐2/CXCL6 by IL‐1beta and hypoxia in small cell lung cancer. Br J Cancer 2006; 94: 1936–41. [DOI] [PMC free article] [PubMed] [Google Scholar]
Associated Data
This section collects any data citations, data availability statements, or supplementary materials included in this article.
Supplementary Materials
Appendix S1. All the genes had a 2‐fold or higher change of expression between the LNMTca8113‐stimulated lymphatic endothelial cells (LNMLECs) and Tca8113‐stimulated LECs (TLECs).
Please note: Wiley‐Blackwell are not responsible for the content or functionality of any supporting materials supplied by the authors. Any queries (other than missing material) should be directed to the corresponding author for the article.
Supporting info item