

Abstract
We have previously reported that a synergistic interaction between hypergastrinemia and Helicobacter felis (H. felis) infection accelerates gastric carcinogenesis in mice, but the precise mechanism for this interaction has not been clarified. Consequently, we undertook an oligonucleotide cDNA microarray study to investigate changes in gene expression in this model system. Male hypergastrinemic transgenic (INS‐GAS) mice with 6‐months H. felis infection were compared with three different age, strain and gender‐matched control groups: (i) INS‐GAS mice without H. felis infection; (ii) non‐transgenic FVB/N mice with H. felis infection; and (iii) non‐transgenic FVB/N mice without H. felis infection. Complementary RNA derived from whole stomach were hybridized to the Affymetrix GeneChip murine U74Av2 array. Among 12 000 cDNA spotted on each chip, 35 cDNA were upregulated and 41 cDNA were downregulated more than twofold in H. felis‐infected INS‐GAS mice compared with all three control groups. Expression changes were validated in 12 selected genes by northern hybridization and/or quantitative real‐time reverse transcription polymerase chain reaction (RT‐PCR). Confirmed upregulated genes included Reg I, amphiregulin, MMP‐10, MMP‐13, claudin‐7 and chitinase 3‐like 1, while confirmed downregulated genes included H/K‐ATPase alpha and beta subunits, intrinsic factor, somatostatin, galectin‐2 and apolipoprotein A‐I. Immunohistochemical analysis of MMP‐10, amphiregulin, H/K‐ATPase beta subunit and galectin‐2 confirmed these expression changes at the protein level, and MMP‐10 was mainly detected in stromal cells of submucosal region, while the other three genes were expressed in gastric epithelial cells. Taken together, gene expression profiling of this mouse model may provide novel insights into Helicobacter‐induced gastric carcinogenesis. (Cancer Sci 2007; 98: 284–293)
Recent studies have confirmed that Helicobacter pylori infection represents the primary environmental risk factor for non‐cardia gastric cancer.( 1 , 2 ) Based on accumulated epidemiological evidence, a Working Group of the International Agency for Research on Cancer (IARC), a branch of the World Health Organization, in 1994 classified H. pylori as a group I carcinogen.( 3 ) Nevertheless, the possible mechanisms by which this infectious organism is able to promote gastric cancer have not been elucidated for the most part. Data derived from both animal models as well as human studies have pointed to host immune responses, particularly strong T‐helper (Th)1 immune responses, as critical to the development of gastric atrophy and intestinal metaplasia, preneoplastic conditions strongly associated with progression to cancer.( 4 , 5 ) However, more recent studies in mice have also suggested a role for hypergastrinemia in the pathogenesis of gastric cancer. Hypergastrinemic mice (INS‐GAS mice) developed by our group showed spontaneous development of gastric atrophy, metaplasia and adenocarcinoma which could be markedly accelerated by concurrent Helicobacter infection.( 6 ) Kanda et al. also recently reported their gastrin transgenic mice (ACT‐GAS mice) showed gastric mucosal hypertrophy and eventually gastric cancer, which was significantly regressed by cyclooxygenase‐2 inhibitor celecoxib.( 7 ) In addition, it has been well‐documented that hypergastrinemia was associated with tumor growth in human gastric cancer patients.( 8 )
These data suggest the notion that elevations in circulating amidated gastrin might directly promote gastric atrophy and preneoplasia as well as neoplasia of the stomach in a susceptible host. A direct role for amidated gastrin in gastric carcinogenesis has been confirmed in recent studies by our group with the CCK2/gastrin receptor antagonist, YF476, which was shown to inhibit the development of atrophy and cancer in Helicobacter‐infected INS‐GAS mice.( 9 ) Nevertheless, the relevant downstream targets of gastrin, and the mechanism of synergy between amidated gastrin and Helicobacter infection, has not been defined.
The high throughput cDNA microarray represents a powerful tool for analyzing molecular events in cancer progression. This technology has been applied to study of the gene expression patterns in both human tissues and animal models of gastric cancer.( 10 , 11 , 12 ) For example, we have recently reported in Helicobacter felis‐infected C57BL/6 mice the gene expression profile of spasmolytic‐polypeptide expressing metaplasia (SPEM), a precancerous lesion associated with gastric neoplasia in both rodent and human gastric fundus, and identified 11 SPEM‐specific transcripts.( 13 ) However, previous studies did not distinguish and characterize expression profiles based on Helicobacter infection status or serum gastrin levels. Other microarray studies have focused primarily on Helicobacter‐treated gastric cancer cell lines,( 14 ) but these in vitro experiments could not correlate the expression of specific genes with cancer progression.
In the current study, with the aim of identifying gastric neoplasia‐specific transcripts, we undertook an oligonucleotide cDNA microarray study in our H. felis‐infected INS‐GAS mouse model of gastric cancer.( 6 ) In order to discern changes that were highly specific preneoplastic lesions, the expression profiles in our cancer model were compared to the following three sets of controls: (i) H. felis‐infected non‐transgenic mice, which should indicate changes in expression associated with chronic inflammation; (ii) INS‐GAS mice without H. felis infection, which should indicate changes in expression associated with hyperplasia; and (iii) non‐transgenic mice without H. felis infection as control of normal stomach, to reveal molecular mechanism of Helicobacter‐induced gastric carcinogenesis.
Materials and methods
Animals. The insulin‐gastrin (INS‐GAS) transgenic mice (FVB/N background) have been described previously.( 6 , 15 ) Animals were housed in micro‐isolator, solid‐bottomed polycarbonate cages of a pathogen free condition, fed a commercially prepared pelleted diet, and given water ad libitum. Twelve male, at 2 or 3 months of age, INS‐GAS mice were inoculated with H. felis (ATCC 49179) as previously described.( 6 ) All experiments were approved by the Institutional Animal Care and Use Committees of University of Massachusetts Medical School and Columbia University, College of Physicians and Surgeons, respectively.
RNA preparation. Total RNA were extracted from whole stomach of each sample with Trizol (Invitrogen) and 10 µg of total RNA were used for first strand cDNA synthesis using Superscript II cDNA amplification System (Invitrogen) following manufacturer's instructions.
Oligonucleotide Microarray Analysis. High‐density oligonucleotide microarray GeneChip murine U74Av2 (Affymetrix) containing approximately 12 000 probe sets per chip were used to analyze expression profiles of mice stomach. The cRNA sample preparation, array hybridization and scanning followed protocols recommended by the manufacturer (URL: http://www.affymetrix.com/index.affx). The hybridization intensity (average difference) of each transcript was determined using the Affymetrix Microarray Suite 5.0 software package. Intensity values were scaled such that the overall fluorescence intensity of each array was equivalent. Scaling factors for each experimental set varied by less than 20%.
Northern hybridization analysis. Twenty micrograms of total RNA from each sample were fractionated on 1% agarose denaturing formaldehyde gels, and the RNA was blotted to nylon membranes (Amersham Pharmacia Biotech) using established capillary blotting methods. DNA probes for northern blot analysis were labeled with (‐32P) dCTP (3000 mCi/mmol; NEN) using a random primer labeling kit (Megaprime; Amersham). The cDNA fragment, generated by reverse transcription polymerase chain reaction (RT‐PCR) and subcloned into pCRII vector (TOPO TA‐cloning kit, Invitrogen), then cut out by EcoRI digestion, was used for gene‐specific probe. A glyceraldehyde‐3‐phosphate dehydrogenase (GAPDH) probe was used as internal control. Hybridizations were performed at 65°C using Quickhyb solution (Stratagene) following the manufacturer's instructions, and membranes were washed to high stringency in 0.1 × SSC (1 × SSC is 0.15 M NaCl plus 0.015 M sodium citrate) 0.1% sodium dodecyl sulfate (SDS) at 65°C. After exposure to X‐Omat LS autoradiographic film (Kodak), blots were stripped with 0.1% SDS at 95°C for 5 min before rehybridization with other probes. Quantitation was performed using software AlphaEaseFC (Alpha Innotech).
Real‐time PCR (RT‐PCR) assay of expression profiles in mice stomach. Total RNA were extracted from the whole stomach of each sample with Trizol (Invitrogen) and 5 µg of total RNA were used for first strand cDNA synthesis using Superscript III cDNA amplification System (Invitrogen) following manufacturer's instructions. RT‐PCR was performed using LightCycler (Roche Applied Science) and Quantitect SYBR Green PCR kit (Qiagen) following companies’ instructions. Briefly, PCR assay was performed under the following conditions: 95°C for 15 min followed by 45 cycles of 95°C for 15 sec, 55°C for 30 sec and 72°C for 30 sec. RT‐PCR primers for each gene are as below. All these primers were originally designed using software Lasergene ver5.0 (DNASTAR). Results were calculated by minus delta delta threshold cycle (–ddCt) method as previously described.( 9 ) Briefly, the threshold cycle Ct1 of each sample reaction were deducted with the threshold cycle Ct2 of GAPDH reaction for normalization, then deducted from the threshold cycle Ct3 of calibration control (45 cycles in this experiment); thus, the final result was represented by the formula: Ct3 − (Ct1 − Ct2). Upregulated genes: Reg I, forward 5′‐aaggagagtggcactacagacg‐3′, reverse 5′‐gtattgggcatcacagttgtca‐3′; amphiregulin, forward 5′‐ggcaaaaatggaaaaggcagaa‐3′, reverse 5′‐cgaggatgatggcagagacaaa‐3′; MMP‐10, forward 5′‐cacctggccctggattttatgg‐3′, reverse 5′‐gctgggcttgtggagaacctgta‐3′; MMP‐13, forward 5′‐ggccagaacttcccaaccat‐3′, reverse 5′‐gaaccgcagcgctcagtctct‐3′; claudin‐7, forward 5′‐tgggcctgatagcgagcact‐3′, reverse 5′‐aacaccagggacaccaccatta‐3′; chitinase 3‐like 1, forward 5′‐ aggattaccaggccggttcacc‐3′, reverse 5′‐tcataccccacccactggttgc‐3′. Downregulated genes: H+K+‐ATPase alpha subunit, forward 5′‐tggcgtgaggccttccagacag‐3′, reverse 5′‐gcggcatttgagcacagcatca‐3′; H+K+‐ATPase beta subunit, forward 5′‐accggacgtgtatggggaaagagg‐3′, reverse 5′‐gggttgctgtagtggggctgtgct‐3′; somatostatin, forward 5′‐gtcctggctttgggcggtgtca‐3′, reverse 5′‐tgcagctccagcctcatctcgt‐3′; intrinsic factor, forward 5′‐caaccttggccctgacctgtatg‐3′, reverse 5′‐gaaaagcggatcaacccctctca‐3′; galectin‐2, forward 5′‐taaccctcgcttcgatgaatcc‐3′, reverse 5′‐agcccacccatgctcaagtagt‐3′; apolipoprotein A‐I, forward 5′‐ctggccgtggctctggtcttc‐3′, reverse 5′‐gctgtctttgaccgcatccaca‐3′; GAPDH, forward 5′‐gacatcaagaaggtggtgaagc‐3′, reverse 5′‐gtccaccaccctgttgctgtag‐3′.
Stomach histology and immunohistochemistry. The mice stomach was incised and rinsed in phosphate‐buffered saline (PBS) to remove gastric contents. Midline strips along the lesser curvature were fixed in 10% neutral buffered formalin over night, processed routinely, and embedded in paraffin. Sections were cut at 5 µm, then mounted and stained with hematoxylin–eosin (HE). Immunohistochemistry (IHC) was performed with a commercial avidin–biotin–peroxidase complex (ABC) kit (Vector Laboratories). Antigen retrieval was achieved by boiling sections for 15 min in 0.01 M citrate buffer, pH 6.0. The following primary antibodies were used: matrix metalloproteinase‐10 (MMP‐10; dilution 1:100, rabbit antihuman, Santa Cruz); amphiregulin (1:50, rabbit antihuman, Lab Vision); H+K+‐ATPase beta subunit (1:2000, mouse antiporcine, Affinity Bioreagents); galectin‐2 (1:200, goat antihuman, R&D Systems); somatostatin (1:100, rabbit antihuman, DAKO). Primary antibodies were incubated at 4°C overnight in a humidified chamber. 3,3′‐diaminobenzidine tetrahydrochloride (DAB); Vector Laboratories was used as chromogen and slides were counterstained with Mayer's hematoxylin.
Statistical analysis. The results are expressed as mean ± SD unless otherwise stated. The Student's t‐test or Mann–Whitney test were used to evaluate statistical significance. Values of P < 0.01 or P < 0.05 were considered statistically significant.
Results
Gene expression profiling in the stomach of INS‐GAS mice with H. felis infection for 6 months analyzed by oligonucleotide cDNA microarray. Using oligonucleotide cDNA microarray, we analyzed the gene expression profile of whole stomachs of INS‐GAS mice with H. felis infection for 6 months (INSGAS + Hf) in comparison with three different control groups of mice: (i) H. felis‐infected wild‐type FVB/N mice (FVB + Hf); (ii) uninfected INS‐GAS mice (INSGAS wt); and (iii) uninfected wild‐type FVB/N mice (FVB wt). As shown in Figure 1, 74 genes were upregulated and 72 genes were downregulated more than twofold in INSGAS + Hf mice compared with FVB + Hf mice (areas a and e in Venn's diagram of Fig. 1), 343 genes upregulated and 271 genes downregulated compared with INSGAS wt (Fig. 1b,f) and 412 genes upregulated and 337 genes downregulated compared with FVB wt (Fig. 1c,g). Taken together, we found that 34 genes were upregulated and 38 genes were downregulated more than twofold in H. felis‐infected INS‐GAS mice compared with all three control groups (Fig. 1d,h), and we presumed these genes might be gastric cancer‐specific genes and deserving of more detailed analysis.
Figure 1.
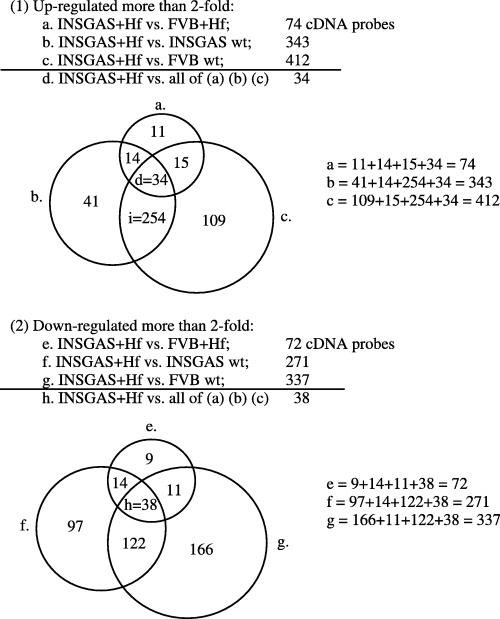
Number of cDNA probes up‐ or downregulated more than twofold in the stomach of male hypergastrinemic transgenic (INS‐GAS) mice with Helicobacter felis infection for 6 months. (1) indicates total number of upregulated genes more than twofold in the stomach of INS‐GAS mice with H. felis infection for 6 months compared with each control group. In Venn's diagram, the circles (a,b,c) indicate upregulated genes more than twofold in stomach of INS‐GAS mice with H. felis infection for 6 months compared with each control group, respectively, and the area (d) indicates the intersection of three circles which represents upregulated genes more than twofold in H. felis‐infected INS‐GAS mice compared with all three control groups. The area (i) indicates intersections of the circles (b) and (c) excluding the area (d) which represents upregulated genes more than twofold in H. felis‐infected INS‐GAS mice compared with non‐infected INS‐GAS mice and non‐infected wild‐type FVB/N mice, but not more than twofold upregulated compared with H. felis‐infected FVB/N mice. (2) shows total number of downregulated genes more than twofold in the stomach of INS‐GAS mice with H. felis infection for 6 months compared with each control group. In Venn's diagram, the circles (e,f,g) indicate downregulated genes more than twofold in the stomach of INS‐GAS mice with H. felis infection for 6 months compared with each control group, respectively, and the area (h) indicates intersection of three circles which represents downregulated genes more than twofold in H. felis‐infected INS‐GAS mice compared with all three control groups. The entire results of this microarray study have been submitted and are retrievable from the public database NCBI Gene Expression Omnibus (GEO) with the accession number GSE4651 (sample number: GSM102058‐102062).
Table 1 shows the list of the 34 upregulated genes, while Table 2 illustrates the 38 downregulated genes in INSGAS + Hf mice compared with all of the three control groups. Among the 34 upregulated genes, 17 genes were upregulated more than 10‐fold compared with FVB wt mice. Similarly, among the 38 downregulated genes, 16 genes were downregulated more than fivefold compared with FVB wt mice.
Table 1.
Upregulated genes in the stomach of Helicobacter felis‐infected male hypergastrinemic transgenic (INS‐GAS) mice
| Gene name | ID no. | Signal (a) | Signal (b) | Ratio (a:b) | Signal (c) | Ratio (a:c) | Signal (d) | Ratio (a:d) |
|---|---|---|---|---|---|---|---|---|
| Reg1 | 160213_at | 2298.4 | 1017.9 | 2:3 | 567.1 | 4:0 | 116.1 | 21:1 |
| Immunoglobulin heavy chain | 93927_f_at | 2031.1 | 990.8 | 2:1 | 19.6 | 68:6 | 44.5 | 26:0 |
| Lactotransferrin | 101115_at | 1888.0 | 765.4 | 2:5 | 97.7 | 14:9 | 160.3 | 13:0 |
| Retinol binding protein 1 | 104716_at | 1301.8 | 366.1 | 3:7 | 135.7 | 11:3 | 128.7 | 11:3 |
| CEA‐CAM1 | 102805_at | 1295.7 | 467.8 | 2:8 | 194.1 | 6:5 | 146.5 | 9:8 |
| Immunoglobulin kappa V10‐J2 | 102155_f_at | 1072.2 | 462.4 | 2:0 | 13.6 | 55:7 | 60.3 | 9:8 |
| Immunoglobulin kappa anti‐DNA antigen | 99405_at | 1031.1 | 161.9 | 6:1 | 51.5 | 14:9 | 63.8 | 13:0 |
| Lymphocyte antigen 64 | 98000_at | 859.4 | 452.3 | 2:1 | 51.4 | 13:9 | 77.4 | 12:1 |
| Claudin‐7 | 99561_f_at | 831.7 | 306.2 | 2:8 | 44.3 | 13:0 | 27.6 | 29:9 |
| Plasminogen activator | 93981_at | 822.5 | 374.7 | 2:1 | 126.9 | 5:7 | 157.0 | 3:2 |
| Immunoglobulin gamma2b | 102824_g_at | 816.6 | 271.0 | 2:8 | 14.0 | 55:7 | 21.9 | 34:3 |
| Small proline‐rich protein 2F | 94120_s_at | 736.6 | 161.5 | 4:0 | 75.7 | 9:2 | 78.5 | 5:7 |
| Amphiregulin | 99915_at | 685.7 | 263.9 | 2:5 | 252.9 | 2:8 | 181.4 | 2:6 |
| Immunoglobulin V‐kappa10‐Ars‐A kappa | 102157_f_at | 660.0 | 303.7 | 2:1 | 21.6 | 27:9 | 23.8 | 21:1 |
| Thromboplastin | 97689_at | 568.2 | 256.3 | 2:1 | 186.7 | 3:5 | 153.2 | 3:2 |
| Biliary glycoprotein 2 long isoform (Bgp2) | 101908_s_at | 565.8 | 226.2 | 2:3 | 98.5 | 5:7 | 103.3 | 4:6 |
| Immunoglobulin light chain IgM | 100299_f_at | 560.0 | 268.4 | 2:3 | 26.8 | 22:6 | 41.4 | 18:4 |
| IgH chain gene, DJC region D‐FL16.1 | 102843_s_at | 472.9 | 207.9 | 2:1 | 22.6 | 19:7 | 23.7 | 18:4 |
| Chitinase 3‐like 1 | 99952_at | 443.7 | 99.1 | 4:3 | 17.7 | 22:6 | 5.3 | 90:5 |
| Cluster Incl AW060549 | 160799_at | 417.3 | 169.3 | 2:5 | 79.1 | 4:6 | 234.7 | 2:0 |
| Aldehyde dehydrogenase 1A3 | 98372_at | 395.7 | 193.9 | 2:1 | 95.8 | 4:3 | 68.2 | 4:0 |
| Osteoprotegerin | 102887_at | 372.5 | 140.5 | 2:0 | 76.2 | 4:0 | 52.9 | 4:0 |
| Complement component 4 binding protein | 102799_at | 337.2 | 122.0 | 2:6 | 61.7 | 4:6 | 81.1 | 4:6 |
| Proliferin | 93883_at | 336.6 | 120.7 | 3:5 | 70.3 | 4:3 | 22.3 | 13:0 |
| MMP‐10 (stromelysin‐2) | 94724_at | 284.4 | 107.8 | 2:5 | 58.5 | 4:0 | 19.2 | 11:3 |
| HGF activator | 104182_at | 280.9 | 165.3 | 2:0 | 98.4 | 3:7 | 76.7 | 3:0 |
| MHC2DMa | 162346_f_at | 232.8 | 106.6 | 2:3 | 25.3 | 9:2 | 22.6 | 10:6 |
| Heparan sulfate glucosaminyl sulfotransferase | 102410_at | 222.5 | 80.1 | 2:5 | 88.7 | 2:5 | 52.6 | 3:5 |
| MMP‐13 (collagenase‐3) | 100484_at | 186.7 | 61.2 | 3:5 | 55.7 | 3:5 | 35.6 | 4:0 |
| Gelsolin‐like capping protein | 161969_f_at | 148.4 | 23.7 | 6:1 | 75.5 | 2:0 | 11.8 | 12:1 |
| Single chain antibody ScFv | 93213_at | 140.0 | 47.5 | 2:1 | 2.8 | 24:3 | 24.5 | 3:5 |
| Lymphocyte specific 1 | 161914_s_at | 134.1 | 70.5 | 2:0 | 45.6 | 3:5 | 41.6 | 3:5 |
| Proliferin | 93929_s_at | 125.1 | 48.2 | 3:2 | 22.8 | 6:1 | 7.4 | 22:6 |
| Pdx1 | 98821_at | 108.6 | 40.2 | 2:5 | 55.6 | 2:0 | 18.9 | 4:6 |
(a) INS‐GAS with H. felis; (b) FVB with H. felis; (c) INS‐GAS no H. felis; (d) FVB no H. felis.
Table 2.
Downregulated genes in the stomach of H. felis‐infected INS‐GAS mice
| Name | ID no. | Signal (a) | Signal (b) | Ratio (a:b) | Signal (c) | Ratio (a:c) | Signal (d) | Ratio (a:d) |
|---|---|---|---|---|---|---|---|---|
| HKATPase alpha | 94163_at | 4414.3 | 9171.3 | 0:50 | 12 708.3 | 0:35 | 14591.9 | 0:308 |
| Galectin‐2 | 160221_at | 3661.6 | 9380.3 | 0:38 | 12 350.2 | 0:27 | 12 893.6 | 0:233 |
| HKATPase beta | 100501_at | 2098.2 | 5329.6 | 0:38 | 8110.5 | 0:29 | 11 789.3 | 0:203 |
| Apolipoprotein A‐I | 96094_at | 1782.9 | 5153.2 | 0:33 | 6406.7 | 0:27 | 9145.3 | 0:203 |
| Gastric intrinsic factor | 92690_at | 1564.9 | 3854.3 | 0:41 | 6231.2 | 0:27 | 14 784.5 | 0:117 |
| Trypsinogen | 160132_at | 1086.0 | 2358.9 | 0:47 | 9394.2 | 0:11 | 14 832.7 | 0:063 |
| Keratin10 | 94321_at | 904.0 | 2762.2 | 0:33 | 5473.5 | 0:16 | 3275.3 | 0:287 |
| Keratinocyte differentiation associated protein | 99654_s_at | 656.0 | 1854.7 | 0:33 | 5862.1 | 0:11 | 2753.1 | 0:233 |
| ISG12 | 93775_at | 424.1 | 918.0 | 0:47 | 916.3 | 0:50 | 1106.0 | 0:379 |
| Small proline‐rich protein 3 | 101762_at | 406.6 | 1305.3 | 0:33 | 5471.8 | 0:07 | 2341.3 | 0:134 |
| Keratin4 | 100421_at | 307.7 | 1297.5 | 0:29 | 6418.5 | 0:05 | 2147.3 | 0:189 |
| Aspartic protease | 95740_at | 229.0 | 966.7 | 0:23 | 2817.4 | 0:08 | 1380.3 | 0:165 |
| Metallothionein 4 | 102989_at | 222.9 | 739.6 | 0:31 | 1315.1 | 0:14 | 842.1 | 0:287 |
| Keratin13 | 160510_f_at | 215.3 | 592.0 | 0:27 | 1902.4 | 0:09 | 774.1 | 0:233 |
| Loricrin | 92624_r_at | 192.3 | 537.0 | 0:31 | 2347.1 | 0:08 | 757.0 | 0:268 |
| Somatostatin | 95436_at | 184.5 | 327.5 | 0:50 | 950.5 | 0:19 | 2004.8 | 0:082 |
| Nice‐1 | 98518_f_at | 176.2 | 737.6 | 0:25 | 1968.0 | 0:09 | 903.5 | 0:203 |
| Cardiac troponin I | 100921_at | 174.0 | 481.1 | 0:44 | 821.6 | 0:22 | 1820.3 | 0:102 |
| Corneodesmosin | 104363_at | 165.6 | 256.4 | 0:50 | 655.7 | 0:18 | 375.7 | 0:354 |
| Filaggrin | 100420_at | 142.6 | 328.4 | 0:38 | 1565.9 | 0:08 | 627.8 | 0:203 |
| Calmodulin 4 | 93744_at | 128.5 | 321.1 | 0:41 | 1147.6 | 0:12 | 414.0 | 0:287 |
| Chymotrypsin A | 160744_r_at | 124.1 | 502.4 | 0:29 | 696.6 | 0:13 | 251.9 | 0:330 |
| FGF binding protein 1 | 103995_at | 105.0 | 240.4 | 0:50 | 407.9 | 0:27 | 405.5 | 0:287 |
| Repetin | 94732_at | 71.9 | 231.2 | 0:27 | 814.2 | 0:09 | 396.0 | 0:177 |
| Fatty acid binding protein heart 1 | 94214_at | 64.8 | 159.8 | 0:44 | 302.7 | 0:23 | 771.1 | 0:102 |
| Cluster Incl AV240248 | 161542_r_at | 55.6 | 143.0 | 0:47 | 347.8 | 0:31 | 149.9 | 0:354 |
| Uteroglogin | 94291_at | 52.4 | 228.6 | 0:19 | 277.0 | 0:18 | 108.0 | 0:354 |
| Cluster Incl AV160842 | 161680_r_at | 50.8 | 110.0 | 0:44 | 195.2 | 0:23 | 138.8 | 0:379 |
| Caspase14 | 103837_at | 48.9 | 144.2 | 0:41 | 448.3 | 0:14 | 212.3 | 0:308 |
| Sine oculis‐related homeobox 2 | 98839_at | 48.8 | 187.4 | 0:25 | 226.5 | 0:22 | 192.7 | 0:268 |
| Chitinase | 160509_at | 46.7 | 192.5 | 0:23 | 2917.9 | 0:01 | 12 701.8 | 0:003 |
| Cluster Incl AA674409 | 92601_at | 37.1 | 330.4 | 0:16 | 409.9 | 0:15 | 318.7 | 0:177 |
| Cluster Incl AA607809 | 95509_at | 34.6 | 289.5 | 0:11 | 316.4 | 0:10 | 155.0 | 0:308 |
| Cluster Incl AI843094 | 94400_at | 26.9 | 100.2 | 0:20 | 155.6 | 0:13 | 102.6 | 0:134 |
| Cluster Incl AA241764 | 100631_r_at | 23.3 | 125.9 | 0:29 | 216.1 | 0:15 | 179.2 | 0:134 |
| Pancreatic alpha‐amylase isozyme | 97523_i_at | 23.2 | 4504.3 | 0:01 | 5046.1 | 0:00 | 5630.3 | 0:004 |
| Keratin complex2 | 104370_s_at | 22.3 | 112.0 | 0:15 | 179.3 | 0:13 | 183.6 | 0:102 |
| Cluster Incl AV087536 | 161647_f_at | 10.4 | 145.7 | 0:07 | 223.7 | 0:04 | 120.1 | 0:095 |
(a) INS‐GAS with H. felis; (b) FVB with H. felis; (c) INS‐GAS no H. felis; (d) FVB no H. felis.
Of note, the proinflammatory cytokine interleukin‐1 beta (IL‐1β) which has been linked to gastric cancer,( 16 ) was upregulated 16‐fold in INSGAS + Hf mice compared with FVB wt mice, but this cytokine was also upregulated 10‐fold in FVB + Hf mice. Therefore, it appeared to be more strongly linked to Helicobacter infection than our cancer model per se, and was not included in the list of Table 1. (Actually, this gene belongs to area i in Venn's diagram shown in Fig. 1)
The entire results of this microarray study have been submitted and are retrievable from the public database NCBI Gene Expression Omnibus (GEO) with the accession number GSE4651 (sample number: GSM102058‐102062).
Northern hybridization analysis of gene expression profile of the stomach of INS‐GAS mice with H. felis infection for 6 months. In order to further confirm the microarray results, we performed northern hybridization analysis using the same sets of total RNA. We analyzed the samples from H. felis‐infected INS‐GAS mice and the sample from each of the three control groups. We chose four selected genes from the list of Table 1 with GAPDH as the internal control: Reg I, amphiregulin, MMP‐10 and claudin‐7. As shown in Figure 2 and Table 3, the upregulation of four genes in H. felis‐infected INS‐GAS mice compared with the three control groups was validated.
Figure 2.
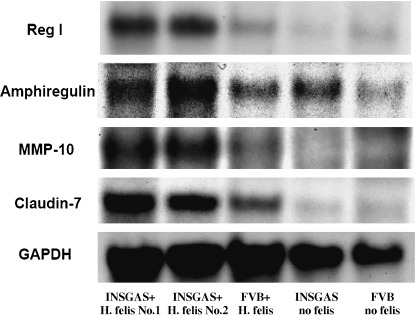
Northern hybridization of upregulated genes in the stomach of INS‐GAS mice with H. felis infection for 6 months. Total RNA used for microarray analysis were analyzed and confirmed by northern hybridization of four different cDNA probes in the list of upregulated genes with glyceraldehyde‐3‐phosphate dehydrogenase (GAPDH) as internal control: Reg I, amphiregulin, MMP‐10, claudin‐7. From left lane to right: (1) H. felis‐infected INS‐GAS mice no. 1; (2) H. felis‐infected INS‐GAS mice no. 2; (3) H. felis‐infected FVB mice; (4) INS‐GAS mice without H. felis infection; and (5) FVB mice without H. felis infection. Each lane, 20 µg of total RNA were loaded and electrophoresed in 1% agarose/formaldehyde gel.
Table 3.
Densitometric analysis of northern hybridization of up‐ or downregulated genes in H. felis‐infected INS‐GAS mice stomach
| Upregulated | INS‐GAS +H. felis no. 1 | INS‐GAS + H. felis no. 2 | FVB + H. felis | INS‐GAS no H. felis | FVB no H. felis |
|---|---|---|---|---|---|
| Reg I | 51.3 | 46.9 | 26.2 | 16.1 | 22.2 |
| Amphiregulin | 10.8 | 11.6 | 6.9 | 8.7 | 4.9 |
| MMP‐10 | 58.5 | 55.9 | 40.7 | 42.8 | 24.8 |
| Claudin‐7 | 12.3 | 10.5 | 8.1 | 4.1 | 2.7 |
| (GAPDH) | 362.2 | 369.5 | 369.5 | 349.0 | 312.3 |
| Downregulated | |||||
| HKATPalpha | 38.2 | 35.0 | 43.2 | 49.8 | 81.3 |
| Somatostatin | 18.1 | 11.3 | 21.1 | 43.2 | 57.1 |
| Intrinsic factor | 53.7 | 55.9 | 62.9 | 75.6 | 77.7 |
| Galectin‐2 | 19.8 | 22.4 | 26.3 | 48.9 | 49.1 |
| (GAPDH) | 338.4 | 341.3 | 310.4 | 288.4 | 297.2 |
GAPDH, glyceraldehyde‐3‐phosphate dehydrogenase. Intensity of gene expression in each sample was normalized in accordance with GAPDH intensity as 100. Original GAPDH intensity is shown in brackets.
Similarly, we also chose four selected genes from the list of Table 3 with GAPDH as the internal control: H+K+ATPase alpha subunit, somatostatin, gastric intrinsic factor and galectin‐2. As shown in Figure 3 and Table 3, we validated that all of these genes were downregulated in H. felis‐infected INS‐GAS mice compared with the three control groups.
Figure 3.
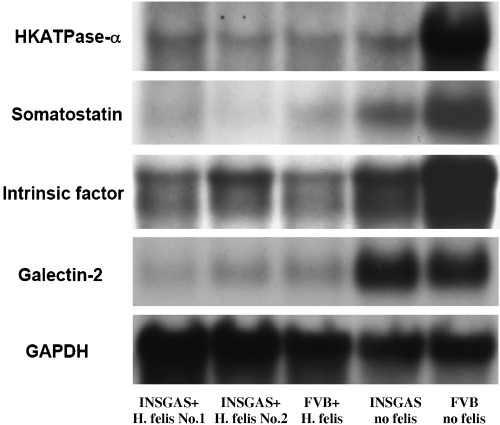
Northern hybridization of downregulated genes in the stomach of INS‐GAS mice with H. felis infection for 6 months. Total RNA used for microarray analysis were analyzed and confirmed by northern hybridization of four different cDNA probes in the list of downregulated genes with GAPDH as internal control: H+K+ATPase alpha subunit, somatostatin, gastric intrinsic factor and galectin‐2. From left lane to right: (1) H. felis‐infected INS‐GAS mice no. 1; (2) H. felis‐infected INS‐GAS mice no. 2; (3) H. felis‐infected FVB mice; (4) INS‐GAS mice without H. felis infection; and (5) FVB mice without H. felis infection. Each lane, 20 µg of total RNA were loaded and electrophoresed in 1% agarose/formaldehyde gel.
Quantitative real‐time RT‐PCR analysis of gene expression profile of the stomach of INS‐GAS mice with H. felis infection for 6 months. In order to further confirm statistical significance of our findings, we performed quantitative real‐time RT‐PCR analysis of the relevant genes in our original samples used in microarray study, as well as additional samples, that is, n = 6 for H. felis‐infected INS‐GAS mice and n = 3 for each control group mice. Furthermore, we chose two additional genes from each list to verify our microarray data: upregulated genes, MMP‐13 and chitinase 3‐like 1; downregulated genes, H+K+ATPase beta subunit and apolipoprotein A‐I. As shown in 4, 5, we confirmed all of these genes were significantly changed in H. felis‐infected INS‐GAS mice compared with the three control group mice.
Figure 4.
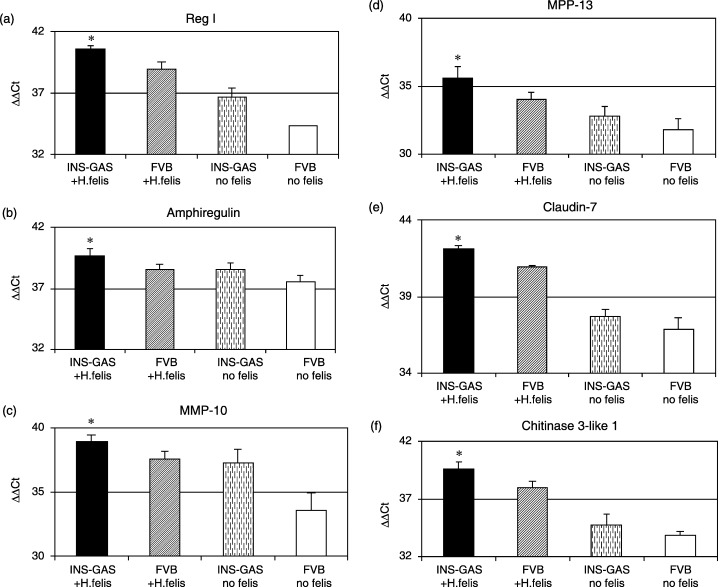
Quantitative real‐time reverse transcription polymerase chain reaction (RT‐PCR) analysis of upregulated genes in the stomach of INS‐GAS mice with H. felis infection for 6 months. Total RNA extracted from each sample were analyzed by quantitative real‐time RT‐PCR for seven different genes selected from the list of Table 2: Reg I, amphiregulin, MMP‐10, MMP‐13, claudin‐7, tissue‐type plasminogen activator and chitinase 3‐like 1. Results were expressed delta‐delta threshold cycles (ΔΔCt) normalized by GAPDH as internal control. All of the genes were significantly upregulated more than twofold compared with three control group mice. n = 6 for H. felis‐infected INS‐GAS mice, n = 3 for each of three control group mice, i.e. H. felis‐infected non‐transgenic FVB mice, INS‐GAS mice without H. felis infection, and non‐transgenic FVB mice without H. felis infection (statistical significance: *P < 0.01).
Figure 5.
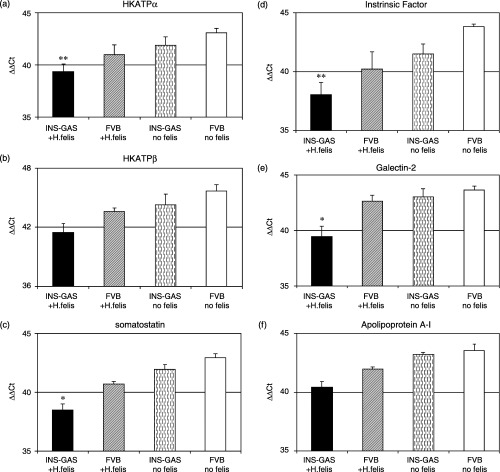
Quantitative real‐time RT‐PCR analysis of downregulated genes in the stomach of INS‐GAS mice with H. felis infection for 6 months. Total RNA extracted from each sample were analyzed by quantitative real‐time RT‐PCR for six different genes selected from the list of Table 3: H+K+ATPase alpha and beta subunit, somatostatin, gastric intrinsic factor, galectin‐2 and apolipoprotein A‐I. Results were expressed delta‐delta threshold cycles (ΔΔCt) normalized by GAPDH as internal control. All of the genes were significantly downregulated more than twofold compared with three control group mice. n = 6 for H. felis‐infected INS‐GAS mice, n = 3 for each of three control group mice, i.e. H. felis‐infected non‐transgenic FVB mice, INS‐GAS mice without H. felis infection, and non‐transgenic FVB mice without H. felis infection (statistical significance: *P < 0.01, **P < 0.05).
Immunohistochemical analysis of gene expression profile of the stomach of INS‐GAS mice with H. felis infection for 6 months. To examine these gene expression profile changes obtained by microarray at the protein level, we performed immunohistochemical studies. We analyzed the following four selected genes for which commercial primary antibodies available: upregulated genes, MMP‐10 and amphiregulin; downregulated genes, H+K+ATPase beta subunit and galectin‐2.
There were many MMP‐10 positive cells in H. felis‐infected INS‐GAS mice stomach, and those positive cells were mainly located in the submucosal region (Fig. 6a), while no positive cells were observed in uninfected FVB control mouse stomach (Fig. 6b). In addition, we confirmed that amphiregulin was strongly expressed in epithelial cells of gastric neoplasia lesions of H. felis‐infected INS‐GAS mice (Fig. 6c), while very few cells were weakly positive for amphiregulin in the surface area of uninfected FVB control mice (Fig. 6d).
Figure 6.
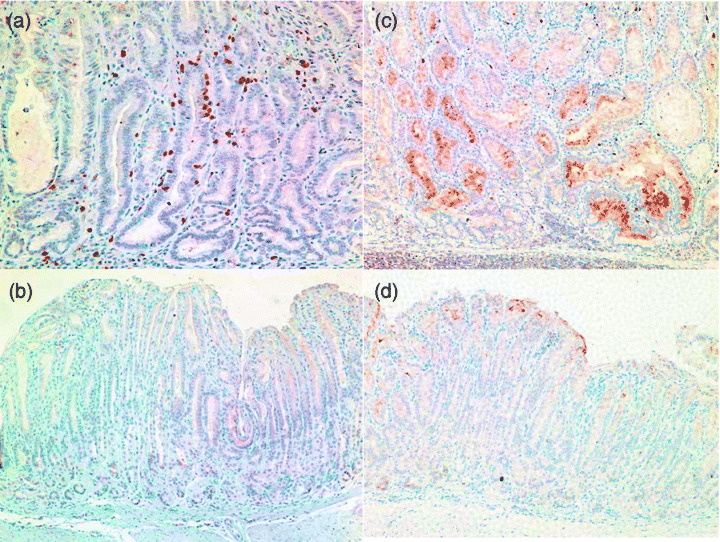
Immunohistochemistry of MMP‐10 and amphiregulin in H. felis‐infected INS‐GAS mice and uninfected wild‐type FVB/N mice. (a,b) Immunohistochemical staining with anti‐MMP‐10 antibody: (a) H. felis‐infected INS‐GAS mice (6 months infection); (b) uninfected wild‐type FVB/N mice (original magnification ×100). MMP‐10 positive cells in H. felis‐infected INS‐GAS mice stomach are mainly located in the submucosal region (a), while no positive cells were observed in uninfected FVB control mouse stomach (b). (c–d) Immunohistochemical staining with anti‐amphiregulin antibody: (c) H. felis‐infected INS‐GAS mice (6 months infection); (d) uninfected wild‐type FVB/N mice (original magnification ×100). Amphiregulin is strongly expressed in epithelial cells of gastric neoplasia lesions of H. felis‐infected INS‐GAS mice (c), while very few cells weakly positive for amphiregulin are found in the surface area of uninfected FVB control mice (d).
With respect to downregulated genes, only a few positive cells for H+K+ATPase beta subunit, presumably parietal cells, were found in gastric neoplasia lesions of H. felis‐infected INS‐GAS mice (Fig. 7a), while there were many positive cells in the gastric corpus of uninfected FVB control mice, consistent with the presence of abundant parietal cells (Fig. 7b). Galectin‐2 was strongly expressed in gastric surface cells of uninfected FVB control mice (Fig. 6d), while very few, weakly positive cells were found in gastric neoplasia lesions of H. felis‐infected INS‐GAS mice (Fig. 7c). Somatostatin‐positive cells were identified in both the gastric corpus and antrum in uninfected FVB control mice (Fig. 7g,h), while positive cells were still detected in the gastric antrum of H. felis‐infected INS‐GAS mice (Fig. 7f) but completely lost in gastric corpus neoplastic lesions (Fig. 7e).
Figure 7.
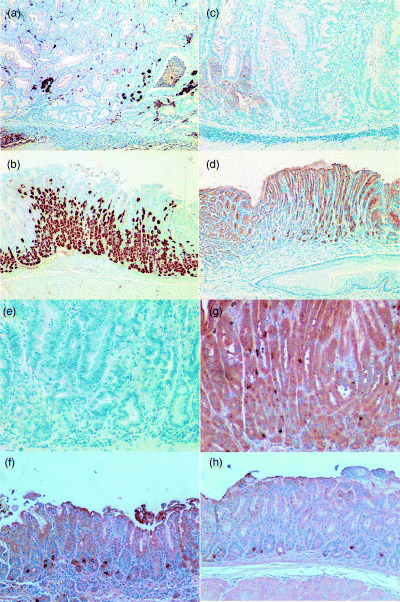
Immunohistochemistry of H+K+ATPase beta subunit, galectin‐2 and somatostatin in H. felis‐infected INS‐GAS mice and uninfected wild‐type FVB/N mice. (a–b) Immunohistochemical staining with anti‐H+K+ATPase beta subunit antibody: (a) H. felis‐infected INS‐GAS mice (6 months infection); (b) uninfected wild‐type FVB/N mice (original magnification ×100). There are many positive cells in gastric corpus of uninfected FVB control mice (b), while very few positive cells for H+K+ATPase beta subunit are found in gastric neoplasia lesions of H. felis‐infected INS‐GAS mice (a). (c–d). Immunohistochemical staining with antigalectin‐2 antibody: (c) H. felis‐infected INS‐GAS mice (6 months infection); (d) uninfected wild‐type FVB/N mice (original magnification ×100). Galectin‐2 was strongly expressed in gastric surface cells of uninfected FVB control mice (d), while very few, weakly positive cells were found in gastric neoplasia lesions of H. felis‐infected INS‐GAS mice (c). (e–f): Immunohistochemical staining with anti‐somatostatin antibody: (e) corpus and (f) antrum of H. felis‐infected INS‐GAS mice (6 months infection); (g) corpus and (h) antrum of uninfected wild‐type FVB/N mice (original magnification ×200). Several positive cells (dark brown dots) were found in both the gastric corpus and antrum of uninfected FVB control mice (g,h), while, despite there being a few positive cells still identified in the antrum of H. felis‐infected INS‐GAS mice (f), there were no positive cells in gastric neoplasia lesions of H. felis‐infected INS‐GAS mice (e).
Discussion
In this study, we have applied high‐throughput oligonucleotide microarray technology to our Helicobacter‐infected hypergastrinemic mice, a recently validated mouse model of gastric cancer.( 6 ) Our results revealed changes in the expression level of a number of genes potentially involved in gastric cancer progression.
Among upregulated genes in gastric cancer, Reg I and amphiregulin seem logical candidates for oncogenic factors in view of their known function as growth factors. Reg I was originally identified as one of the upregulated genes in the regeneration of pancreatic islet beta cells. Later, it was found to be involved in gastric epithelial proliferation and to be highly expressed in human gastric cancers.( 17 , 18 ) Consistent with these findings, Reg I was upregulated in H. felis‐infected INS‐GAS mice compared to the control groups. Amphiregulin is a member of the epidermal growth factor (EGF) family, and is also reported to be highly expressed in human gastric cancer cells.( 19 ) This gene has been shown to be upregulated by gastrin stimulation,( 20 ) but there are conflicting data with respect to the effect of H. pylori infection on amphiregulin expression. Tuccillo et al. reported upregulation of amphiregulin and heparin‐binding epidermal growth factor‐like growth factor (HB‐EGF) expression in H. pylori‐infected human gastric mucosa,( 21 ) whereas Shiemann et al. suggested decreased expression of these factors.( 22 )
In contrast to the confirmatory nature of the changes in Reg I and amphiregulin, the functional role of MMP‐10 (stromelysin‐2) and MMP‐13 (collagenase‐3) upregulated in cancer cells has not been well analyzed. MMP‐10 and MMP‐13 are members of the matrix metalloproteinase family which consists of 24 members to date. These genes have been reported to promote cancer progression by increasing cancer‐cell growth, migration, invasion, metastasis and angiogenesis.( 23 ) Aung et al. recently detected MMP‐10 as one of the highly expressed genes in gastric cancer specimens compared with normal tissues by serial analysis of gene expression (SAGE) data analysis and, moreover, enzyme‐linked immunosorbent assay showed high levels of MMP‐10 in serum samples from patients with gastric cancer.( 24 ) Our present result suggests MMP‐10 is highly induced by Helicobacter infection in the stromal cells of INS‐GAS mice as well as FVB mice, and may be involved in stromal–epithelial cell interaction and gastric cancer progression. MMP‐13, which is also reported to be overexpressed in human gastric cancer,( 25 ) is also likely important in our model.
Claudin‐7 is a member of the claudin gene family, a group of genes that contain four transmembrane domains and encodes for the components of tight junction molecules. Twenty‐four members of the claudin family have so far been identified in both mice and humans. These proteins form a large network of tight junction strands that act as a primary barrier to the diffusion of solutes through the intercellular space, creating a boundary between the apical and the basolateral plasma membrane domains.( 26 ) Claudin‐7 has been reported to be downregulated in breast and head/neck cancer,( 27 , 28 ) while Johnson et al. recently reported that claudin‐7 was upregulated in gastric tumors of TFF1 knockout mouse as well as human gastric cancers.( 29 ) To be compatible with this report, we have observed upregulation of claudin‐7 in our mouse model of gastric cancer.
Chitinase 3‐like 1, also known as YKL‐40 or HCgp39, was first identified as a glycoprotein secreted from human osteoblastic cells in culture.( 30 ) Its biological function appears to be that of a growth factor for connective tissue cells, a potent migration factor for endothelial cells, and possibly involved in a remodeling of extracellular matrix. The gene is overexpressed in several types of cancer such as breast and colon cancer.( 31 , 32 ) In our study, chitinase 3‐like 1 was significantly upregulated in INS‐GAS mice with H. felis infection compared to the three control groups. In particular, the increase compared with uninfected wild type FVB/N mice was 90‐fold, which was the highest among all the upregulated genes listed in Table 1. Our study is the first to describe the overexpression of this gene in a mouse model of gastric cancer, and it would be interesting to investigate whether this is also true in human gastric cancers.
HK‐ATPase alpha and beta subunits are specifically expressed in parietal cells, and downregulations of these genes is thus consistent with our previous observation that parietal cell loss (atrophy) occurs in association with hypergastrinemia and Helicobacter infection, and precedes gastric dysplasia/neoplasia.( 6 ) As Correa initially observed,( 33 ) chronic inflammation induced by H. pylori infection results in atrophy of the oxyntic mucosa, leading to intestinal metaplasia, dysplasia and eventually gastric cancer. Therefore, downregulations of both of H+K+‐ATPase alpha and beta subunits genes in our mouse model mimics these progressive steps in human gastric carcinogenesis.
Downregulation of two other genes, somatostatin and gastric intrinsic factor, was also expected in view of the loss of individual gastric cell lineage during gastric cancer progression. Somatostatin is produced by D cells in gastric antrum and fundus. It has been reported that Helicobacter infection leads to reduced numbers of D cells in mice and humans.( 34 , 35 ) In our INS‐GAS mouse with the H. felis infection model, gastric cancer was induced only in the corpus lesions( 6 ) and, compatible with this observation, no D cells were detected in the neoplastic lesions in the corpus of H. felis‐infected INS‐GAS mice stomach while D cells were still identified in the antrum (Fig. 7e,f).
Gastric intrinsic factor is produced by chief cells or zymogenic cells and binds to vitamin B12, which is essential for absorbance of vitamin B12 by enterocytes in the small intestine, and deficiency of gastric intrinsic factor will eventually lead to pernicious (vitamin B12‐dependent) anemia. We have observed that H. felis‐infected INS‐GAS mice develop severe anemia after 6 months infection (Takaishi, unpublished data) and it is consistent with downregulation of gastric intrinsic factor in these mice. In human gastric cancer, Lee et al. reported gastric intrinsic factor and HK‐ATPase alpha subunit were among 36 downregulated genes as shown by SAGE analysis.( 36 ) Clinically, an increased risk of gastric cancer in patients of pernicious anemia has been well documented.( 37 )
In contrast with the above four downregulated genes, the reduced expression of galectin‐2 in gastric cancer lesions of H. felis‐infected INS‐GAS mice was unexpected and newly recognized in this study. Galectins are a family of animal lectins, and currently consist of 15 members. Galectins have been postulated to have important roles in cancer, possibly by contributing to neoplastic transformation, tumor cell survival, angiogenesis, tumor metastasis and inflammatory responses.( 38 ) Galectin‐2 is mainly expressed in the gastric epithelial cells of rats,( 39 ) but a role in cancer has not yet been described. Our present study demonstrates for the first time a decrease of galectin‐2 expression in gastric cancer progression, and suggests a role in tumor suppression.
Downregulation of apolipoprotein A‐I was also unexpected. Of note, Ryu et al. recently reported that they identified apolipoprotein A‐I as downregulated in human gastric cancer through a proteomics approach,( 40 ) although the role of this gene in cancer is yet to be elucidated.
In our gastric cancer mouse model (INS‐GAS mice with H. felis infection for 6 months),( 6 ) serum gastrin levels were much higher (594 +150 pM) than the other three control groups, and we have recently showed that these extensive and continuous hypergastrinemia caused gastric cell apoptosis, especially parietal cell loss( 41 ) and eventually caused gastric cancer. In this respect, we observed the remarkable development of SPEM and dysplastic lesions in H. felis‐infected INS‐GAS mice stomach. We also analyzed Cdx‐1 and Cdx‐2 gene expression, which is reported to be involved in metaplastic changes of gastric mucosa( 42 ) by real‐time RT‐PCR, and Cdx‐2 expression was, not significantly, but highly upregulated in H. felis‐infected INS‐GAS mice stomach, while Cdx‐1 was, unexpectedly, almost unchanged.
We and another group have recently reported that Th1 and Th2 cytokine balance caused by Helicobacter infection would also be an important factor for the development of gastritis and gastric cancer.( 5 , 43 ) In the stomach of INS‐GAS mice as well as non‐transgenic FVB/N mice with H. felis infection for 6 months, Th1 cytokines such as interferon‐γ, IL‐1β and tumor necrosis factor‐α were all upregulated more than twofold compared with the other two control groups and, in H. felis‐infected INS‐GAS mice, these cytokines showed insignificant but higher levels than H. felis‐infected FVB/N mice, which indicated their important role in gastric cancer progression (Takaishi, unpublished data).
In conclusion, the gene expression profiles obtained by microarray analysis of our mouse model of gastric cancer revealed the usefulness of this model for the study of human gastric cancer, and also provided novel insights for Helicobacter‐induced gastric carcinogenesis.
Acknowledgments
The authors express sincere thank to Ms Dana Frederick and Ms Jane Carlson (University of Massachusetts Medical School) for their assistance of mice preparation and Helicobacter infection, Dr Guanglin Cui (University of Massachusetts Medical School, and now University of Tromso, Norway) for valuable histological suggestions, and Ms Rongzhen Chen (Columbia University, College of Physicians and Surgeons) for her excellent immunohistochemical works, and Prof. Graham J. Dockray and Prof. Andrea Varro (University of Liverpool, UK) for gastrin G‐17 RIA. This research was supported in part by National Institutes of Health grants CA93405 and DK48077 (TCW).
References
- 1. Helicabacter and Cancer Collaborative Group. Gastric cancer and Helicobacter pylori: a combined analysis of 12 case control studies nested within prospective cohorts. Gut 2001; 49: 347–53. [DOI] [PMC free article] [PubMed] [Google Scholar]
- 2. Uemura N, Okamoto S, Yamamoto S et al. Helicobacter pylori infection and the development of gastric cancer. N Engl J Med 2001; 345: 784–9. [DOI] [PubMed] [Google Scholar]
- 3. International Agency for Research on Cancer. ‘Infection with Helicobacter pylori’. IARC monographs on the evaluation of the carcinogenic risks to humans. 1994; 61: 177. Available from URL: http://193.51.164.11/htdocs/monographs/vol61/m61‐3.htm. [PMC free article] [PubMed]
- 4. Houghton J, Fox JG, Wang TC. Gastric cancer: laboratory bench to clinic. J Gastroenterol Hepatol 2002; 17: 495–502. [DOI] [PubMed] [Google Scholar]
- 5. Fox JG, Beck P, Dangler CA et al. Concurrent enteric helminth infection modulates inflammation and gastric immune responses and reduces helicobacter‐induced gastric atrophy. Nat Med 2000; 6: 536–42. [DOI] [PubMed] [Google Scholar]
- 6. Wang TC, Dangler CA, Chen D et al. Synergistic interaction between hypergastrinemia and Helicobacter infection in a mouse model of gastric cancer. Gastroenterology 2000; 118: 36–47. [DOI] [PubMed] [Google Scholar]
- 7. Kanda N, Seno H, Kawada M et al. Involvement of cyclooxygenase‐2 in gastric mucosal hypertrophy in gastrin transgenic mice. Am J Physiol Gastrointest Liver Physiol 2005; 290: G519–27. [DOI] [PubMed] [Google Scholar]
- 8. Miyaji M, Ogoshi K, Tajima T, Mitomi T. Association between serum gastrin levels, gastric acid secretion and age in early gastric cancer. Tumour Biol 1997; 18: 311–20. [DOI] [PubMed] [Google Scholar]
- 9. Takaishi S, Cui G, Frederick DM et al. Synergistic inhibitory effects of gastrin and histamine receptor antagonists on Helicobacter‐induced gastric cancer. Gastroenterology 2005; 128: 1965–83. [DOI] [PubMed] [Google Scholar]
- 10. Hasegawa S, Furukawa Y, Li M et al. Genome‐wide analysis of gene expression in intestinal‐type gastric cancers using a complementary DNA microarray representing 23 040 genes. Cancer Res 2002; 62: 7012–7. [PubMed] [Google Scholar]
- 11. Hippo Y, Taniguchi H, Tsutsumi S et al. Global gene expression analysis of gastric cancer by oligonucleotide microarrays. Cancer Res 2002; 62: 233–40. [PubMed] [Google Scholar]
- 12. Abe M, Yamashita S, Kuramoto T et al. Global expression analysis of N‐methyl‐N‐nitro‐N‐nitrosoguanidine‐induced rat stomach carcinomas using oligonucleotide microarrays. Carcinogenesis 2003; 24: 861–7. [DOI] [PubMed] [Google Scholar]
- 13. Nomura S, Baxter T, Yamaguchi H et al. Spasmolytic polypeptide expressing metaplasia to preneoplasia in H. felis‐infected mice. Gastroenterology 2004; 127: 582–94. [DOI] [PubMed] [Google Scholar]
- 14. Maeda S, Otsuka M, Hirata Y et al. cDNA microarray analysis of Helicobacter pylori‐mediated alteration of gene expression in gastric cancer cells. Biochem Biophys Res Commun 2001; 284: 443–9. [DOI] [PubMed] [Google Scholar]
- 15. Fox JG, Wang TC, Rogers AB et al. Host and microbial constituents influence Helicobacter pylori‐induced cancer in a murine model of hypergastrinemia. Gastroenterology 2003; 124: 1879–90. [DOI] [PubMed] [Google Scholar]
- 16. El‐Omar EM, Carrington M, Chow WH et al. Interleukin‐1 polymorphisms associated with increased risk of gastric cancer. Nature 2000; 404: 398–402. [DOI] [PubMed] [Google Scholar]
- 17. Kinoshita Y, Ishihara S, Kadowaki Y, Fukui H, Chiba T. Reg protein is a unique growth factor of gastric mucosal cells. J Gastroenterol 2004; 39: 507–13. [DOI] [PubMed] [Google Scholar]
- 18. Sekikawa A, Fukui H, Fujii S et al. REG Ialpha protein may function as a trophic and/or anti‐apoptotic factor in the development of gastric cancer. Gastroenterology 2005; 128: 642–53. [DOI] [PubMed] [Google Scholar]
- 19. Kitadai Y, Yasui W, Yokozaki H et al. Expression of amphiregulin, a novel gene of the epidermal growth factor family, in human gastric carcinomas. Jpn J Cancer Res 1993; 84: 879–84. [DOI] [PMC free article] [PubMed] [Google Scholar]
- 20. Tsutsui S, Shinomura Y, Higashiyama S et al. Induction of heparin binding epidermal growth factor‐like growth factor and amphiregulin mRNAs by gastrin in the rat stomach. Biochem Biophys Res Commun 1997; 235: 520–3. [DOI] [PubMed] [Google Scholar]
- 21. Tuccillo C, Manzo BA, Nardone G et al. Up‐regulation of heparin binding epidermal growth factor‐like growth factor and amphiregulin expression in Helicobacter pylori‐infected human gastric mucosa. Dig Liver Dis 2002; 34: 498–505. [DOI] [PubMed] [Google Scholar]
- 22. Schiemann U, Konturek JW, Osterhoff M et al. Decreased expression of epidermal growth factor receptor and mRNA of its ligands in Helicobacter pylori‐infected gastric mucosa. Scand J Gastroenterol 2001; 36: 23–31. [DOI] [PubMed] [Google Scholar]
- 23. Egeblad M, Werb Z. New functions for the matrix metalloproteinases in cancer progression. Nat Rev Cancer 2002; 2: 161–74. [DOI] [PubMed] [Google Scholar]
- 24. Aung PP, Oue N, Mitani Y et al. Systematic search for gastric cancer‐specific genes based on SAGE data: melanoma inhibitory activity and matrix metalloproteinase‐10 are novel prognostic factors in patients with gastric cancer. Oncogene 2005. [DOI] [PubMed]
- 25. Elnemr A, Yonemura Y, Bandou E et al. Expression of collagenase‐3 (matrix metalloproteinase‐13) in human gastric cancer. Gastric Cancer 2003; 6: 30–8. [DOI] [PubMed] [Google Scholar]
- 26. Tsukita S, Furuse M, Itoh M. Multifunctional strands in tight junctions. Nat Rev Mol Cell Biol 2001; 2: 285–93. [DOI] [PubMed] [Google Scholar]
- 27. Kominsky SL, Argani P, Korz D et al. Loss of the tight junction protein claudin‐7 correlates with histological grade in both ductal carcinoma in situ and invasive ductal carcinoma of the breast. Oncogene 2003; 22: 2021–33. [DOI] [PubMed] [Google Scholar]
- 28. Al Moustafa AE, Alaoui‐Jamali MA, Batist G et al. Identification of genes associated with head and neck carcinogenesis by cDNA microarray comparison between matched primary normal epithelial and squamous carcinoma cells. Oncogene 2002; 21: 2634–40. [DOI] [PubMed] [Google Scholar]
- 29. Johnson AH, Frierson HF, Zaika A et al. Expression of tight‐junction protein claudin‐7 is an early event in gastric tumorigenesis. Am J Pathol 2005; 167: 577–84. [DOI] [PMC free article] [PubMed] [Google Scholar]
- 30. Johansen JS, Williamson MK, Rice JS, Price PA. Identification of proteins secreted by human osteoblastic cells in culture. J Bone Miner Res 1992; 7: 501–12. [DOI] [PubMed] [Google Scholar]
- 31. Jensen BV, Johansen JS, Price PA. High levels of serum HER‐2/neu and YKL‐40 independently reflect aggressiveness of metastatic breast cancer. Clin Cancer Res 2003; 9: 4423–34. [PubMed] [Google Scholar]
- 32. Cintin C, Johansen JS, Christensen IJ, Price PA, Sorensen S, Nielsen HJ. High serum YKL‐40 level after surgery for colorectal carcinoma is related to short survival. Cancer 2002; 95: 267–74. [DOI] [PubMed] [Google Scholar]
- 33. Correa P. Human gastric carcinogenesis: a multistep and multifactorial process – First American Cancer Society Award Lecture on Cancer Epidemiology and Prevention. Cancer Res 1992; 52: 6735–40. [PubMed] [Google Scholar]
- 34. Zavros Y, Rieder G, Ferguson A, Samuelson LC, Merchant JL. Hypergastrinemia in response to gastric inflammation suppresses somatostatin. Am J Physiol Gastrointest Liver Physiol 2002; 282: G175–83. [DOI] [PubMed] [Google Scholar]
- 35. Graham DY, Lew GM, Lechago J. Antral G‐cell and D‐cell numbers in Helicobacter pylori infection: effect of H. pylori eradication. Gastroenterology 1993; 104: 1655–60. [DOI] [PubMed] [Google Scholar]
- 36. Lee JY, Eom EM, Kim DS, Ha‐Lee YM, Lee DH. Analysis of gene expression profiles of gastric normal and cancer tissues by SAGE. Genomics 2003; 82: 78–85. [DOI] [PubMed] [Google Scholar]
- 37. Kokkola A, Sjoblom SM, Haapiainen R, Sipponen P, Puolakkainen P, Jarvinen H. The risk of gastric carcinoma and carcinoid tumours in patients with pernicious anaemia. A prospective follow‐up study. Scand J Gastroenterol 1998; 33: 88–92. [DOI] [PubMed] [Google Scholar]
- 38. Liu FT, Rabinovich GA. Galectins as modulators of tumour progression. Nat Rev Cancer 2005; 5: 29–41. [DOI] [PubMed] [Google Scholar]
- 39. Oka T, Murakami S, Arata Y et al. Identification and cloning of rat galectin‐2: expression is predominantly in epithelial cells of the stomach. Arch Biochem Biophys 1999; 361: 195–201. [DOI] [PubMed] [Google Scholar]
- 40. Ryu JW, Kim HJ, Lee YS et al. The proteomics approach to find biomarkers in gastric cancer. J Korean Med Sci 2003; 18: 505–9. [DOI] [PMC free article] [PubMed] [Google Scholar]
- 41. Cui G, Takaishi S, Ai W et al. Gastrin‐induced apoptosis contributes to carcinogenesis in the stomach. Lab Invest 2006; 86: 1037–51. [DOI] [PubMed] [Google Scholar]
- 42. Tatematsu M, Tsukamoto T, Inada K. Stem cells and gastric cancer: role of gastric and intestinal mixed intestinal metaplasia. Cancer Sci 2003; 94: 135–41. [DOI] [PMC free article] [PubMed] [Google Scholar]
- 43. Chiba T, Seno H, Marusawa H et al. Host factors are important in determining clinical outcomes of Helicobacter pylori infection. J Gastroenterol 2006; 41: 1–9. [DOI] [PubMed] [Google Scholar]