

Abstract
Glutathione S‐transferase P (GST‐P), a marker for rat hepatic preneoplastic lesions, is suggested to bind to Jun N‐terminal kinase (JNK) to repress stress response, and GST‐P gene expression is regulated by a transcription factor, nuclear factor‐erythroid 2‐related factor 2 (Nrf2). In this study, we examined by immunohistochemistry whether JNK2, p38 mitogen‐activated protein kinase, and Nrf2 were expressed in GST‐P‐positive foci induced by the Solt–Farber protocol. At 2 weeks after partial hepatectomy, all GST‐P‐positive foci were negative for p38, and 86.4 ± 5.6% and 64.7 ± 6.3% of GST‐P‐positive foci were negative for JNK2 and Nrf2, respectively. Western blot analysis showed decreased p38 mitogen‐activated protein kinase and JNK2 expression in livers treated with the protocol. In immunohistochemistry, besides GST‐P‐positive foci, GST‐P‐negative foci were detected as p38‐negative foci in the surrounding tissues positive for p38. In contrast to GST‐P‐positive foci, most GST‐P‐negative foci showed enhanced Nrf2 expression. The number of GST‐P‐negative foci was 76 ± 18/10 mm2 of liver section at 2 weeks, but was undetectable at 1 week. The area of GST‐P‐negative foci was 0.09 ± 0.05 mm2, smaller than that of GST‐P‐positive ones (0.29 ± 0.23). After treatment with carbon tetrachloride, small vacuoles due to liver injury were frequently observed inside GST‐P‐negative foci but less frequently in GST‐P‐positive foci. However, this treatment resulted in expression of JNK2, p38, and Nrf2 in both foci. These results showed development of GST‐P‐negative foci during the early stage of hepatocarcinogenesis and suggested that Nrf2 is not responsible for GST‐P expression in rat hepatic preneoplastic foci. (Cancer Sci 2008; 99: 497–501)
- Abbreviations: ABC
avidin–biotin–peroxidase complex
- CCl4
carbon tetrachloride
- GST‐P
glutathione S‐transferase P
- JNK
Jun N‐terminal kinase
- MAPK
mitogen‐activated protein kinase
- Nrf2
nuclear factor‐erythroid 2‐related factor 2
- PH
partial hepatectomy.
Glutathione S‐transferases are a family of multifunctional proteins that act as enzymes, and binding proteins in detoxification processes.( 1 ) One isoenzyme of this family, GST‐P, is strongly expressed in hepatic preneoplastic and neoplastic nodules, and is widely used as a reliable marker for preneoplastic cells.( 2 ) Recently, GST‐P has been suggested to function as an inhibitor of MAPK pathways, including JNK and p38 MAPK, which are involved in stress response, apoptosis, and cellular proliferation.( 3 , 4 ) There are also reports that the transcription factor, Nrf2/MafK, might be involved in GST‐P gene expression during rat hepatocarcinogenesis.( 5 ) However, it is not clear whether GST‐P acts as an inhibitor of MAPK in rat hepatic foci, and whether Nrf2 is responsible for GST‐P expression in foci. We tried to explore these points by examining the expression of Nrf2 and MAPK in hepatic foci induced by the Solt–Farber protocol. We observed the absence of p38 MAPK and Nrf2 expression in GST‐P‐positive foci, and unexpectedly observed hepatic foci lacking GST‐P expression. In the present study, we described the loss of p38 MAPK and Nrf2 expression in GST‐P‐positive foci and the properties of GST‐P‐negative foci compared with positive lesions.
Materials and Methods
Animals and chemical hepatocarcinogenesis. Male Sprague–Dawley rats maintained in our Department, aged 7 weeks and initially weighing 180–210 g, were used in the present study. The rats were housed in plastic cages in an air‐conditioned room with a 12:12 h L: D cycle in the Institute for Animal Experiments, Hirosaki University Graduate School of Medicine (Hirosaki, Japan), and had free access to water and food. Rats in the carcinogenesis group were subjected to the Solt–Farber protocol to induce GST‐P‐positive foci in the livers,( 6 ) and killed at 2 weeks after PH (Fig. 1a). In other experiment, rats subjected to the Solt–Farber protocol were killed at 1 or 2 weeks after PH, and some rats also received a mixture of carbon tetrachloride (CCl4; Wako Pure Chemical Industries, Osaka, Japan) and corn oil (1:1, v/v; 4.5 mL/kg body weight) through a stomach tube on the day 12 after PH (Fig. 1b). As the control for CCl4 treatment, other rats were given corn oil alone (4.5 mL/kg body weight).( 7 ) Every group contained six rats. Rats were decapitated under diethyl anesthesia, and the livers were fixed and analyzed. All procedures and treatments that involved live animals were approved by the Animal Care and Use Committee, Hirosaki University.
Figure 1.
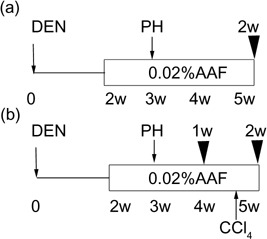
Schematic representation of experimental protocols used in this study. (a) The Solt–Farber protocol to induce preneoplastic hepatic foci in rat liver. Black arrow heads, time points at which rats were killed; white box, 0.02% 2‐acetyl aminofluorene feeding. (b) Carbon tetrachloride (CCl4) treatment. A mixture of CCl4 and corn oil was given to rats treated with the Solt–Farber protocol on day 12 after partial hepatectomy (PH). DEN, diethylnitrosamine.
Immunohistochemistry. Rat livers were fixed in cold acetone and embedded in paraffin. Tissue sections (6 µm) were routinely passed through xylene and a graded alcohol series and stained for GST‐P, Nrf2, JNK2, and p38 MAPK by the ABC method. Rabbit anti‐GST‐P antibody was prepared following the method described previously.( 2 ) Antibodies against Nrf2 (sc‐722), JNK2 (sc‐572), and p38MAPK (sc‐728) were obtained from Santa Cruz Biotechnology (Santa Cruz, CA). Affinity‐purified, biotin‐labeled goat antirabbit immunoglobulin G and ABC complex (Vectastain ABC kit, PK6101) were obtained from Vector Laboratories (Burlingame, CA). The site of peroxidase binding was determined by the diaminobenzidine method. Sections were then lightly counterstained with hematoxylin for microscopic examination. As negative controls, non‐immune γ‐globulin was used instead of the antibodies. The specimens were examined and photographed using a microscope (COOLSCOPE; Nikon, Tokyo, Japan). Staining results of foci for p38 MAPK, JNK2, and Nrf2 were evaluated according to staining intensity: negative (–), no staining; positive (+), stained at a similar level to the surrounding tissue; and strongly positive (++), more heavily stained than the surrounding tissues. In some experiments, antiphosphorylated JNK antibody (sc‐6254; Santa Cruz Biotechnology) was also used.
Measurement of lesion area. GST‐P‐positive and GST‐P‐negative lesions composed of more than 50 cells in cross‐section were counted as such foci, and expressed as the numbers per 10 mm2 of liver section. The areas of GST‐P‐positive and GST‐P‐negative foci were measured as reported previously,( 8 ) with the aid of an image analyzer interfaced with a computer using NIH Image software 1.62.
Western blot analysis. Rat livers were homogenized in 4 volumes of 0.25 M sucrose, 15 mM Tris‐HCl (pH 7.9), 15 mM NaCl, 60 mM KCl, 5 mM ethylenediaminetetraacetic acid, 0.15 mM spermine, 0.5 mM spermidine, 0.1 mM phenylmethanesulfonyl fluoride, 1.0 mM dithiothreitol, and 1% protease inhibitor cocktail (Sigma), and centrifuged at 15 000g for 10 min. The supernatant was used as cytoplasmic extract. Nuclear extracts were prepared from rat liver tissues, as described by Dignam et al.( 9 ) Proteins of these extracts were separated by 12.5% sodium dodecyl sulfate–polyacrylamide gel electrophoresis,( 10 ) and electroblotted to polyvinylidene difluoride membranes (Amersham Biosciences, Tokyo, Japan). Blotting was probed with anti‐GST‐P, p38 MAPK, JNK2, β‐actin, or Nrf2 antibodies, according to the method of Towbin et al.( 11 ) Antibody against β‐actin (A5441) was from Sigma‐Aldrich Biotechnology (Tokyo, Japan). The antigen–antibody complexes were then detected using enhanced chemiluminescence (Amersham Biosciences). Detected bands were quantified with an image analysis system (ChemiDoc XRS; Bio‐Rad, Tokyo, Japan).
Statistical analysis. Student's t‐test and Bonferroni's test were used for single and multiple comparisons, respectively. Data are expressed as mean ± SD.
Results
Loss of p38 MAPK, JNK2, and Nrf2 expression in GST‐P‐positive foci and detection of GST‐P‐negative foci. Liver sections from rats treated with the Solt–Farber protocol at 2 weeks after PH showed GST‐P‐positive foci by immunohistochemistry, and the surrounding tissues did not express GST‐P (Fig. 2a), consistent with a previous report.( 2 ) All GST‐P‐positive foci were devoid of p38 MAPK expression (Fig. 2b) and most foci were also negative for Nrf2 (Fig. 2c) and JNK2 (Fig. 2e). Staining of the sections with non‐immune γ‐globulin was completely negative (Fig. 2f). Quantitative data are summarized in Table 1: 86.4 ± 5.6% and 64.7 ± 6.3% of GST‐P‐positive foci were negative for JNK2 and Nrf2, respectively. By immunohistochemistry with anti‐p38 MAPK antibody, besides GST‐P‐positive foci, GST‐P‐negative foci were detected as p38 MAPK‐negative foci in the surrounding tissues that were positive for p38 MAPK. GST‐P‐negative foci were also detectable with JNK2 staining. In contrast to GST‐P‐positive foci, most GST‐P‐negative foci showed enhanced expression of Nrf2 (Fig. 2c, black arrowhead, and Table 1), compared with the surrounding tissues. Nrf2 was localized in the cytoplasm and nuclei of such foci (Fig. 2d).
Figure 2.
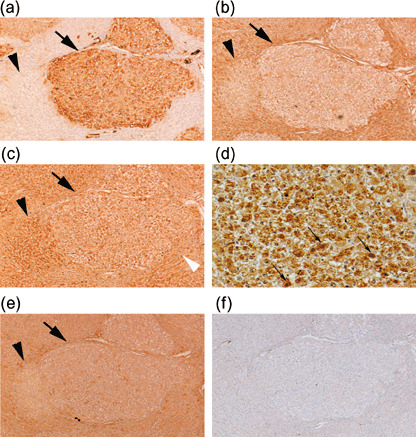
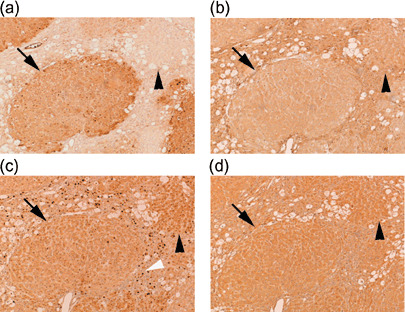
Immunohistochemical staining of serial sections of rat hepatic foci induced by the Solt–Farber protocol by anti‐glutathione S‐transferase P (GST‐P) antibody (a), anti‐p38 mitogen‐activated protein kinase antibody (b), anti‐nuclear factor‐erythroid 2‐related factor 2 (Nrf2) antibody (c, d), anti‐Jun N‐terminal kinase 2 antibody (e), and non‐immune γ‐globulin (f). Liver samples were obtained at 2 weeks after partial hepatectomy. Black arrows, GST‐P‐positive lesions; black arrowheads, GST‐P‐negative lesions; white arrowhead (c), stained nuclei of infiltrated leukocytes. Original magnification, ×50. High magnification (×200) of (c) is presented in (d); slim arrows, stained nuclei in an Nrf2‐positive focus.
Table 1.
Examination of Jun N‐terminal kinase 2 (JNK2), p38 mitogen‐activated protein kinase, and nuclear factor‐erythroid 2‐related factor 2 (Nrf2) expression in glutathione S‐transferase P (GST‐P)‐positive and GST‐P‐negative foci at 2 weeks after partial hepatectomy in rats
| GST‐P staining | No. of foci/liver section, 10 mm2 | Percentage of foci stained for (%) | ||||||
|---|---|---|---|---|---|---|---|---|
| p38 | JNK2 | Nrf2 | ||||||
| + | – | + | – | ++ | + | – | ||
| + | 151 ± 8 | 0.0 | 100.0 | 13.6 ± 5.6 | 86.4 ± 5.6 | 0.0 | 35.3 ± 6.3 | 64.7 ± 6.3 |
| – | 147 ± 16 | 0.0 | 100.0 | 24.4 ± 7.4 | 75.6 ± 7.4 | 72.8 ± 6.4 | 27.2 ± 6.4 | 0.0 |
Data are presented as mean ± SD. Foci are composed of >50 cells. –, no staining; +, stained at a similar level to the surrounding tissue; ++, more heavily stained than the surrounding tissues.
Western blot analysis showed strong expression of GST‐P and reduced expression of p38 MAPK in rat livers treated with the Solt–Farber protocol (Fig. 3a,b), and quantitative analysis revealed a 30% reduction after compensation with the β‐actin level in control liver. The JNK2 band disappeared in preneoplastic lesion‐bearing livers (Fig. 3c), and the Nrf2 band was not detected (data not shown). These results confirmed the immunohistochemical findings, except in the case of Nrf2.
Figure 3.
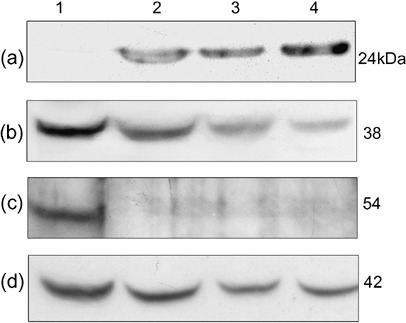
Altered expression of glutathione S‐transferase P (GST‐P), p38 mitogen‐activated protein kinase (MAPK), and Jun N‐terminal kinase 2 (JNK2) in rat livers subjected to the Solt–Farber protocol. Cytoplasmic extracts from control liver (lane 1) and preneoplastic lesion‐bearing livers (lanes 2–4) were subjected to sodium dodecyl sulfate–polyacrylamide gel electrophoresis (40 µg protein each) then Western blot analysis with antibodies against GST‐P (a), p38 MAPK (b), JNK2 (c), and β‐actin as the internal control (d). The numbers on the right indicate molecular mass in kDa.
GST‐P‐negative lesions were undetectable at 1 week after PH. Immunohistochemistry with anti‐GST‐P antibody and anti‐p38 MAPK antibody was also carried out at 1 week and 2 weeks after PH to examine when GST‐P‐negative foci appear. Preneoplastic foci are reported to be resistant to damaging agents such as CCl4.( 7 ) A group of rats were also treated with CCl4 at 12 days after PH to examine the sensitivity of such foci to the hepatotoxin. GST‐P‐negative lesions were not detected at 1 week after PH. The numbers and areas of GST‐P‐positive and negative foci at these time points are summarized in Table 2. The number of GST‐P‐positive foci was 135 ± 45/10 mm2 at 1 week and decreased to 80 ± 16 at 2 weeks without CCl4 treatment (P < 0.01). The value of GST‐P‐negative foci was 76 ± 18 at 2 weeks without CCl4 treatment. The total numbers of foci including positive and negative ones were not different between 1 week and 2 weeks. The area of GST‐P‐negative foci was 0.09 ± 0.05 mm2 at 2 weeks without CCl4 treatment, significantly smaller than that of GST‐P‐positive ones at the same time point (0.29 ± 0.23 mm2, P < 0.01).
Table 2.
Number and area of glutathione S‐transferase P (GST‐P)‐positive and GST‐P‐negative foci at 1 week after partial hepatectomy (PH) in rats and at 2 weeks with (+) and without (–) carbon tetrachloride (CCl4) treatment
| GST‐P staining | No. of foci (/10 mm2) | GST‐P staining | Area of foci (mm2) | ||||
|---|---|---|---|---|---|---|---|
| 1 week | 2 weeks | 1 week | 2 weeks | ||||
| CCl4– | CCl4+ | CCl4– | CCl4+ | ||||
| + | 135 ± 45 | 80 ± 16* | 107 ± 15** | + | 0.20 ± 0.12 | 0.29 ± 0.23 | 0.27 ± 0.24 |
| – | 0 | 76 ± 18 | 73 ± 21*** | – | / | 0.09 ± 0.05***** | 0.15 ± 0.08****** |
| Total | 135 ± 45 | 156 ± 27 | 180 ± 25**** | ||||
Data are presented as mean ± SD. Foci are composed of >50 cells. *P < 0.01 versus number of GST‐P+ lesions at 1 week after PH; **P < 0.01 versus number of GST‐P+ lesions without CCl4 treatment; ***P < 0.01 versus number of GST‐P+ lesions with CCl4 treatment; ****P < 0.01 versus number of GST‐P+ lesions at 1 week after PH; *****P < 0.01 versus area of GST‐P+ lesions without CCl4 treatment; ******P < 0.05 versus area of GST‐P+ lesions with CCl4 treatment.
Sensitivity of GST‐P‐negative lesions to CCl4 treatment. We compared the response to CCl4 treatment between GST‐P‐positive and GST‐P‐negative foci. At 2 days after CCl4 treatment, many vacuoles due to liver injury were formed in the surrounding tissues (Fig. 4). Small vacuoles were observed inside GST‐P‐negative foci, but the size of vacuoles was much smaller than those in the surrounding tissues. Quantitative analysis revealed that vacuole formation was less frequent in GST‐P‐positive foci than in GST‐P‐negative ones (25.0 ± 4.2%versus 87.5 ± 5.0%, P < 0.01; Table 3). As there was a difference in foci size between GST‐P‐positive and GST‐P‐negative lesions, we also compared the area of foci between lesions with and without vacuole formation. Foci accompanying vacuole formation were smaller than those without vacuoles in either GST‐P‐positive or GST‐P‐negative ones (Table 3). The number of GST‐P‐positive foci was higher in the group with CCl4 treatment than in the group without the treatment, but the area was not different between them (Table 2). The number of GST‐P‐negative foci was not different but the foci area was larger in the group with CCl4 treatment. These data suggested that GST‐P‐negative foci were resistant to CCl4, compared with the surrounding tissue, but less resistant than GST‐P‐positive ones.
Figure 4.
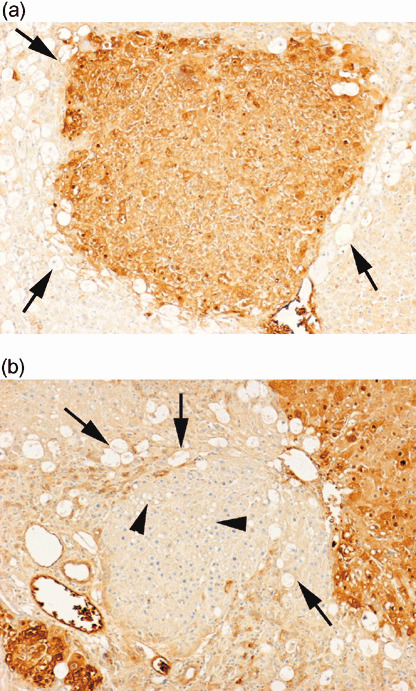
Immunohistochemical staining of rat hepatic foci treated with carbon tetrachloride by anti‐glutathione S‐transferase P (GST‐P) antibody. Vacuoles were observed in the surrounding tissues [black arrows in (a) and (b)], but were barely observed in the GST‐P‐positive focus; many small vacuoles were observed inside the GST‐P‐negative focus [black arrowheads in (b)]. Original magnification, ×100.
Table 3.
More frequent vacuole formation in rat hepatic small glutathione S‐transferase P (GST‐P)‐negative foci versus GST‐P‐positive foci after carbon tetrachloride treatment
| Foci | Vacuole formation (%) | Area of foci (mm2) | |
|---|---|---|---|
| With vacuole formation | Without vacuole formation | ||
| GST‐P+ | 25.0 ± 4.2 | 0.20 ± 0.19 | 0.47 ± 0.26** |
| GST‐P– | 87.5 ± 5.0* | 0.09 ± 0.05 | 0.20 ± 0.11*** |
Data are presented as mean ± SD. Foci are composed of >50 cells. *P < 0.01 versus the percentage of GST‐P‐positive (GST‐P+) lesions accompanying vacuole formation; **P < 0.01 versus area of GST‐P+ lesions with vacuole formation; ***P < 0.01 versus area of GST‐P‐negative (GST‐P–) lesions with vacuole formation.
We also compared immunohistochemically the expression of p38 MAPK, Nrf2, and JNK2 between GST‐P‐positive and ‐negative foci after CCl4 treatment. This treatment resulted in expression of these proteins in both foci with similar extent (Fig. 5). p38 MAPK staining was less in foci, as compared with the surrounding tissues (Fig. 5b), but JNK2 and Nrf2 staining was comparable between them (Fig. 5c,d). Immunohistochemistry with antiphosphorylated JNK antibody was also carried out to examine whether JNK expressed in hepatocytes was activated or not. Such JNK2‐positive hepatocytes were not stained with the antibody but non‐parenchymal cells including Kupffer cells were stained (data not shown). In addition, CCl4 treatment caused the infiltration of a huge amount of leukocytes in the interstitial tissues, and these cells were heavily stained with anti‐Nrf2 antibody in the nuclei (white arrowhead in Fig. 5c). Nuclear staining was hardly observed without CCl4 treatment (Fig. 2c). Such infiltrating leukocytes were also detected in some GST‐P‐negative foci but not in GST‐P‐positive ones.
Figure 5.
Immunohistochemical staining of serial sections of rat hepatic foci treated with carbon tetrachloride (CCl4) by anti‐glutathione S‐transferase P (GST‐P) antibody (a), anti‐p38 mitogen‐activated protein kinase antibody (b), anti‐nuclear factor‐erythroid 2‐related factor 2 antibody (c) and anti‐ Jun N‐terminal kinase 2 antibody (d). Liver samples were obtained at 2 days after CCl4 treatment in the group treated with the Solt–Farber protocol. Black arrows, GST‐P‐positive lesions; black arrowheads, GST‐P‐negative lesions; white arrowhead (c), stained nuclei of infiltrated leukocytes. Original magnification, ×50.
Discussion
Our previous study revealed that GST‐P was strongly expressed in preneoplastic lesions induced by many carcinogens.( 2 , 12 ) In this study, we showed GST‐P‐negative lesions during the early stage of hepatocarcinogenesis by staining with anti‐p38 MAPK antibody in addition to anti‐GST‐P antibody. Unlike the surrounding tissues, GST‐P‐negative foci were negative for p38 MAPK, and also devoid of JNK2 expression. Thus, GST‐P‐negative lesions were clearly separable from the surrounding tissues. By CCl4 treatment, small and fine vacuoles were formed in GST‐P‐negative foci, whereas large vacuoles were formed in the surrounding tissues (2, 4), suggesting that GST‐P‐negative foci were resistant to CCl4, compared with the surrounding tissues.
GST‐P‐negative foci differed from GST‐P‐positive foci in Nrf2 expression (Fig. 2c), the size of foci (Table 2), and sensitivity to CCl4 treatment (Table 3, , Fig. 4). Although both p38 MAPK and JNK2 were lacking in GST‐P‐positive and GST‐P‐negative lesions without CCl4 treatment, these kinases were similarly induced between the two lesions in response to the treatment. These results indicated that GST‐P did not exert inhibitory effects on CCl4‐induced JNK2 and p38 MAPK activation in preneoplastic foci.
Although the origin of GST‐P‐negative foci is unclear, the number of foci at 1 week and 2 weeks after PH (Table 2) might give a hint. The number of GST‐P‐positive foci decreased at 2 weeks, as compared with that at 1 week, but the number of total foci, including GST‐P‐positive and GST‐P‐negative foci, was not different between 1 week and 2 weeks, raising the possibility that negative foci might derive from positive ones. However, the size of GST‐P‐negative foci was smaller than that of GST‐P‐positive foci at 1 week (Table 2). This raises another possibility that they occur de novo, from initiated cells lacking GST‐P expression. Although the resistant nature of GST‐P‐negative foci to CCl4 suggested preneoplastic properties, further studies are clearly needed to examine whether such foci are actually preneoplastic foci as well as positive ones.
There has been much research on the regulation of gst‐p gene expression.( 13 , 14 , 15 , 16 , 17 ) Some researchers have reported that Nrf2 acts as a positive transcription factor for both basal and inducible GST‐P expression.( 5 , 18 , 19 ) In the present study, we observed that GST‐P‐positive foci were devoid of Nrf2 expression, whereas GST‐P‐negative foci expressed higher levels of Nrf2 than the surrounding tissues. This result suggested that, although Nrf2 is induced during the processes of rat hepatocarcinogenesis, it is unlikely to be responsible for GST‐P expression in foci. This is also consistent with a previous finding that the mouse equivalent of rat GST‐P is induced in hepatic foci of Nrf2 knockout animals.( 20 )
GST‐P was shown to bind to JNK to inhibit its signaling pathway,( 3 , 21 ) and JNK/Jun stimulate GST‐P expression. Thus, these proteins are suggested to constitute a feedback loop.( 4 ) Several reports have revealed that JNK is linked to stress‐induced apoptosis.( 22 , 23 , 24 , 25 , 26 ) GST‐P is also reported to modulate the activities of p38 MAPK and extracellular signal‐regulated kinase in NIH3T3 cells.( 4 ) Iyoda et al. reported that p38 MAPK was involved in apoptosis, and the inactivation of the enzyme resulted in the repression of cell death, leading to unrestricted cell growth of human hepatocellular carcinoma cells.( 27 ) Recent studies showed that p38 MAPK controlled the G2/M checkpoint, and inhibition of p38 MAPK activity also led to increased proliferation.( 28 , 29 ) In our present study, under the stressful condition of CCl4 treatment, the kinase signaling pathways were activated in GST‐P‐positive foci as well as GST‐P‐negative foci. However, p38 MAPK and JNK2 were not expressed in GST‐P‐positive foci without CCl4 treatment, indicating that GST‐P could not exert direct effects on these kinases. Many studies reported that the appearance of GST‐P‐positive foci and their clonal expansion are required for carcinogenesis.( 12 , 30 , 31 , 32 ) The loss of p38 MAPK and JNK in GST‐P‐positive foci might provide a favorable environment for tumor development by being resistant to apoptosis.
In conclusion, our present results showed the development of GST‐P‐negative foci during the early stage of hepatocarcinogenesis by staining with anti‐p38 MAPK or anti‐JNK2 antibodies and suggested that Nrf2 is not responsible for GST‐P expression in rat hepatic foci.
Acknowledgments
This work was supported in part by a Grant for Priority Research designated by the President of Hirosaki University, the M. Endo Memorial Grant, and the Research Fund from Hirosaki University School of Medicine.
References
- 1. Tsuchida S, Sato K. Glutathione transferases and cancer. Crit Rev Biochem Mol Biol 1992; 27: 337–84. [DOI] [PubMed] [Google Scholar]
- 2. Satoh K, Kitahara A, Soma Y, Inaba Y, Hatayama I, Sato K. Purification, induction, and distribution of placental glutathione transferase: a new marker enzyme for preneoplastic cells in the rat chemical hepatocarcinogenesis. Proc Natl Acad Sci USA 1985; 82: 3964–8. [DOI] [PMC free article] [PubMed] [Google Scholar]
- 3. Adler V, Yin Z, Fuchs SY et al . Regulation of JNK signaling by GSTp. EMBO J 1999; 18: 1321–34. [DOI] [PMC free article] [PubMed] [Google Scholar]
- 4. Yin Z, Ivanov VN, Habelhah H, Tew K, Ronai Z. Glutathione S‐transferase p elicits protection against H2O2‐induced cell death via coordinated regulation of stress kinases. Cancer Res 2000; 60: 4053–7. [PubMed] [Google Scholar]
- 5. Ikeda H, Nishi S, Sakai M. Transcription factor Nrf2/MafK regulates rat placental glutathione S‐transferase gene during hepatocarcinogenesis. Biochem J 2004; 380: 515–21. [DOI] [PMC free article] [PubMed] [Google Scholar]
- 6. Solt D, Farber E. New principle for the analysis of chemical carcinogenesis. Nature 1976; 263: 701–3. [Google Scholar]
- 7. Farber E, Parker S, Gruenstein M. The resistance of putative premalignant liver cell populations, hyperplastic nodules, to the acute cytotoxic effects of some hepatocarcinogens. Cancer Res 1976; 36: 3879–87. [PubMed] [Google Scholar]
- 8. Satoh K, Hatayama I, Tateoka N et al . Transient induction of single GST‐P positive hepatocytes by DEN. Carcinogenesis 1989; 10: 2107–11. [DOI] [PubMed] [Google Scholar]
- 9. Dignam JD, Lebovitz RM, Roeder RG. Accurate transcription initiation by RNA polymerase II in a soluble extract from isolated mammalian nuclei. Nucl Acids Res 1983; 11: 1475–89. [DOI] [PMC free article] [PubMed] [Google Scholar]
- 10. Laemmli UK. Cleavage of structural proteins during the assembly of the head of bacteriophage T4. Nature 1970; 227: 680–5. [DOI] [PubMed] [Google Scholar]
- 11. Towbin H, Staehelin T, Gordon J. Electrophoretic transfer of proteins from polyacrylamide gels to nitrocellulose sheets: procedure and some applications. Proc Natl Acad Sci USA 1979; 76: 4350–4. [DOI] [PMC free article] [PubMed] [Google Scholar]
- 12. Sato K. Glutathione transferases as markers of preneoplasia and neoplasia. Adv Cancer Res 1989; 52: 205–55. [DOI] [PubMed] [Google Scholar]
- 13. Imagawa M, Osada S, Okuda A, Muramatsu M. Silencer binding proteins function on multiple cis‐elements in the glutathione transferase P gene. Nucleic Acids Res 1991; 19: 5–10. [DOI] [PMC free article] [PubMed] [Google Scholar]
- 14. Morimura S, Suzuki T, Hochi S et al . Trans‐activation of glutathione transferase P gene during chemical hepatocarcinogenesis of the rat. Proc Natl Acad Sci USA 1993; 90: 2065–8. [DOI] [PMC free article] [PubMed] [Google Scholar]
- 15. Sakai M, Okuda A, Muramatsu M. Multiple regulatory elements and phorbol 12‐O‐tetradecanoate 13‐acetate responsiveness of the rat placental glutathione transferase gene. Proc Natl Acad Sci USA 1988; 85: 9456–60. [DOI] [PMC free article] [PubMed] [Google Scholar]
- 16. Suzuki T, Imagawa M, Hirabayashi M et al . Identification of an enhancer responsible for tumor marker gene expression by means of transgenic rats. Cancer Res 1995; 55: 2651–5. [PubMed] [Google Scholar]
- 17. Thimmulappa RK, Mai KH, Srisuma S, Kensler TW, Yamamoto M, Biswal S. Identification of Nrf2‐regulated genes induced by the chemopreventive agent sulforaphane by oligonucleotide microarray. Cancer Res 2002; 62: 5196–203. [PubMed] [Google Scholar]
- 18. Ikeda H, Omoteyama K, Yoshida K, Nishi S, Sakai M. CCAAT enhancer‐binding protein alpha suppresses the rat placental glutathione S‐transferase gene in normal liver. J Biol Chem 2006; 281: 6734–41. [DOI] [PubMed] [Google Scholar]
- 19. Ohta K, Ohigashi M, Naganawa A et al . Histone acetyltransferase MOZ acts as a co‐activator of Nrf2‐MafK and induces tumour marker gene expression during hepatocarcinogenesis. Biochem J 2007; 402: 559–66. [DOI] [PMC free article] [PubMed] [Google Scholar]
- 20. Satoh K, Itoh K, Yamamoto M et al . Nrf2 transactivator‐independent GSTP1‐1 expression in ‘GSTP1‐1 positive’ single cells inducible in female mouse liver by DEN: a preneoplastic character of possible initiated cells. Carcinogenesis 2002; 23: 457–62. [DOI] [PubMed] [Google Scholar]
- 21. Elsby R, Kitteringham NR, Goldring CE et al . Increased constitutive c‐Jun N‐terminal kinase signaling in mice lacking glutathione S‐transferase Pi. J Biol Chem 2003; 278: 22243–9. [DOI] [PubMed] [Google Scholar]
- 22. Ip YT, Davis RJ. Signal transduction by the c‐Jun N‐terminal kinase (JNK) – from inflammation to development. Curr Opin Cell Biol 1998; 10: 205–19. [DOI] [PubMed] [Google Scholar]
- 23. Kasibhatla S, Brunner T, Genestier L, Echeverri F, Mahboubi A, Green DR. DNA damaging agents induce expression of Fas ligand and subsequent apoptosis in T lymphocytes via the activation of NF‐kappa B and AP‐1. Mol Cell 1998; 1: 543–51. [DOI] [PubMed] [Google Scholar]
- 24. Tournier C, Hess P, Yang DD et al . Requirement of JNK for stress‐induced activation of the cytochrome c‐mediated death pathway. Science 2000; 288: 870–4. [DOI] [PubMed] [Google Scholar]
- 25. Xia Z, Dickens M, Raingeaud J, Davis RJ, Greenberg ME. Opposing effects of ERK and JNK–p38 MAP kinases on apoptosis. Science 1995; 270: 1326–31. [DOI] [PubMed] [Google Scholar]
- 26. Yang DD, Kuan CY, Whitmarsh AJ et al . Absence of excitotoxicity‐induced apoptosis in the hippocampus of mice lacking the Jnk3 gene. Nature 1997; 389: 865–70. [DOI] [PubMed] [Google Scholar]
- 27. Iyoda K, Sasaki Y, Horimoto M et al . Involvement of the p38 mitogen‐activated protein kinase cascade in hepatocellular carcinoma. Cancer 2003; 97: 3017–26. [DOI] [PubMed] [Google Scholar]
- 28. Bulavin DV, Higashimoto Y, Popoff IJ et al . Initiation of a G2/M checkpoint after ultraviolet radiation requires p38 kinase. Nature 2001; 411: 102–7. [DOI] [PubMed] [Google Scholar]
- 29. Gate L, Majumdar RS, Lunk A, Tew KD. Increased myeloproliferation in glutathione S‐transferase pi‐deficient mice is associated with a deregulation of JNK and Janus kinase/STAT pathways. J Biol Chem 2004; 279: 8608–16. [DOI] [PubMed] [Google Scholar]
- 30. Denda A, Kitayama W, Konishi Y et al . Genetic properties for the suppression of development of putative preneoplastic glutathione S‐transferase placental form‐positive foci in the liver of carcinogen‐resistant DRH strain rats. Cancer Lett 1999; 140: 59–67. [DOI] [PubMed] [Google Scholar]
- 31. Higashi K, Hiai H, Higashi T, Muramatsu M. Regulatory mechanism of glutathione S‐transferase P‐form during chemical hepatocarcinogenesis: old wine in a new bottle. Cancer Lett 2004; 209: 155–63. [DOI] [PubMed] [Google Scholar]
- 32. Yan Y, Zeng ZZ, Higashi S et al . Resistance of DRH strain rats to chemical carcinogenesis of liver: genetic analysis of later progression stage. Carcinogenesis 2002; 23: 189–96. [DOI] [PubMed] [Google Scholar]