Abstract
Diagnosis of pancreatic adenocarcinoma (PaCa) at an early stage is important for successful treatment and improving the prognosis of patients. Serum samples were applied to strong anionic exchange chromatography (SAX) protein chips for protein profiling by surface enhanced laser desorption/ionization time‐of‐flight mass spectrometry (SELDI‐TOF‐MS) to distinguish PaCa from noncancer. The Wilcoxon rank‐sum test, decision tree algorithm, and logistic regression were used to statistically analyze the multiple protein peaks. Sixty‐one protein peaks between 2000 and 30 000 m/z ratios were detected to establish multiple decision classification trees for differentiating the known disease states. A sensitivity of 0.833 and a specificity of 1.000 were obtained in distinguishing PaCa from healthy controls and benign pancreatic diseases. Six protein biomarkers related to different PaCa TNM stages were detected (P < 0.01). One protein biomarker (m/z 4016) rich in PaCa had a down‐regulated trend when preoperative and postoperative samples (P < 0.05) were compared. Three protein biomarkers (m/z 4155, 4791, and 28 068) were detected in the differential diagnosis of the three test groups (P < 0.05). A peak m/z 28 068 was identified as C14orf16 using ProteinChip immunoassay. C14orf166 levels were significantly higher in the serum of patients with PaCa compared with the control group using a sandwich immunoenzymatic system. Immunolabeling of tissue sections revealed that the C14orf166 protein was strongly expressed in tumor cells. The results suggest that SELDI‐TOF‐MS serum profiling is helpful for the diagnostic, prognostic or therapeutic effects of PaCa, which is superior to CA 19‐9. The identified protein biomarker C14orf166 is a potential biomarker of PaCa. (Cancer Sci 2009; 100: 2292–2301)
Pancreatic adenocarcinoma (PaCa) is the fifth leading cause of cancer death and has the lowest survival rate for any solid cancer.( 1 , 2 ) Few if any patients with PaCa are cured without resection and only 10–15% of patients are resectable at the time of diagnosis. Therefore, early diagnosis and treatment are the only chance for long‐term survival. Unfortunately, the most widely used serum marker for PaCa, CA 19‐9, is not sufficiently sensitive and accurate to be used as a screening test, especially for identifying patients with small surgically resectable cancers.( 3 , 4 ) Despite improvements in diagnostic imaging, most patients do not undergo imaging procedures until late in the course of their disease when symptoms present. It is important that better protein biomarkers are identified to reduce the morality of PaCa.
Significant technological advances in protein chemistry in the past two decades have been established such as mass spectrometry, which is an indispensable tool for protein study including discovery and identification (peptide mapping, sequencing, and structural characterization).( 5 ) Ciphergen Biosystems (Fremont, CA, USA) has developed ProteinChip technology that utilizes surface enhanced laser desorption/ionization time‐of‐flight mass spectrometry (SELDI‐TOF‐MS) to facilitate protein profiling of complex biological specimens.( 6 ) With this platform combining advanced statistical methods and bioinformatics classifier algorithms, the results were surprisingly encouraging given the complexity of the problem and the performance of tumor markers changing from pre‐malignant lesions,( 7 , 8 , 9 , 10 ) which overcome many of the limitations of two‐dimensional electrophoresis and matrix‐assisted laser desorption/ionization‐TOF‐MS.( 11 , 12 )
SELDI‐TOF‐MS has been used to detect biomarkers of ovarian cancer,( 13 , 14 ) prostate cancer,( 15 , 16 , 17 ) breast cancer,( 18 ) renal cell carcinoma,( 19 ) bladder cancer,( 20 ) and other cancers. Rosty et al. ( 21 ) identified a peak at 16 570 daltons as hepatocarcioma‐intestine‐pancreas/pancreatitis associated‐protein I (HIP/PAP‐) present in pancreatic juice from patients with PaCa by means of SELDI‐TOF‐MS. Koopmann et al. ( 22 ) and Yun et al. ( 23 ) investigated protein peaks achieving a high sensitivity and specificity using SELDI‐TOF‐MS with ProteinChip arrays. Using similar experimental protocols, the objective of the cancer biomarker study reported herein was to determine if protein profiling using SELDI‐TOF‐MS with strong anionic exchange chromatography (SAX) ProteinChips could accurately classify patients with PaCa, benign pancreatic diseases, and healthy controls; distinguish patients with different stages of PaCa; and detect the curative effect of the patients with PaCa. One of the up‐regulated proteins m/z 28 068 screened in the PaCa was further identified as C14orf166 by SELDI‐based immunoassay and confirmed by immunoenzymatic assay and immunohistochemisry.
Materials and Methods
Patients and specimens. Serum samples were obtained from 58 patients with PaCa; 18 patients with benign pancreatic diseases, enrolled by Affiliated Zhongshan Hospital of Fudan University between December 2006 and February 2008; and 51 healthy age‐ and gender‐matched volunteers as a control (Table 1). Patients were excluded if they had received neoadjuvant chemotherapy or radiotherapy. Thirty‐five patients among the PaCa group were under surgery without recurrence during the 6 months after surgery. Their serum samples were also obtained 1, 2, 4 weeks, and 6 months after operation, and their tissue samples were obtained from the Department of Surgery. Another cohort included serum samples obtained from individuals including seven patients with PaCa; seven patients with benign pancreatic diseases, enrolled by Zhongshan Hospital between March 2008 and July 2008; and seven healthy volunteers which were used as the testing set for validation (Table 1).Written informed consent was obtained from each individual, which was approved by the biomedical research ethics committee of Affiliated Zhongshan Hospital of Fudan University. All acquired sera were centrifuged (3500 g , for 10 min, 4°C), aliquoted at 4°C, and frozen at −80°C immediately, and all tissues were immediately frozen in liquid nitrogen after surgical resection and then kept at −90°C until immunohistochemistry.
Table 1.
Patient characteristics including the independent training and testing sets
| Diagnosis | No.of patients: train/test | Age: train/test | Men: women: train/test |
|---|---|---|---|
| Pancreatic carcinoma | 58/7 | 63.10 ± 12.55 (26∼88)/ 61.00 ± 15.64 (44∼86) | 36:21/3:4 |
| Stage I | 5/2 | ||
| Stage II | 31/3 | ||
| Stage III | 6/2 | ||
| Stage IV | 16/0 | ||
| Benign pancreatic disease | 18/7 | 46.44 ± 17.09 (19∼85)/ 40.71 ± 15.48 (21∼67) | 6:12/2:5 |
| Chronic pancreatitis | 2/1 | ||
| Mucinous cystadenoma | 5/1 | ||
| Serous cystadenoma | 4/2 | ||
| Solid‐pseudopapillary neoplasm | 5/2 | ||
| Pseudocyst | 2/1 | ||
| Control group | 51/7 | 60.96 ± 14.80 (18∼86)/ 61.00 ± 15.64 (44∼86) | 31:20/3:4 |
SELDI‐TOF‐MS protein profiling. All eight‐spot SAX ProteinChip arrays were loaded with 200 μLof binding buffer (25 mm Tris‐HCl [ pH 9.5]) for 5 min on a vacuum manifold, repeated twice. An aliquot of 6 μL of each serum sample was diluted in 234 μL of binding buffer and then vortexed on ice for 5 min. After being washed, the array was assembled to a bio‐processor (Ciphergen Biosystems), and 200 μL of diluted serum sample was spotted onto each SAX array spot and incubated on a shaker at 4°C for 90 min. Consecutively, 200 μL of washing buffer (150 mm Tris‐HCl [ pH 6.5]) was added to each well, vortexed for 5 min at room temperature, repeated twice, and an additional wash of the sample plate with 300 μL deionized water was performed. Sinapinic acid solution as an energy absorbing matrix was prepared according to the manufacturer’s instructions (Ciphergen Biosystems) in 50% v/v acetonitrile/0.5% v/v trifluoroacetic acid, and 0.5 μL of the saturated matrix solution was applied twice to each spot on the chip. ProteinChip arrays were air dried and stored at room temperature in the dark until further use. Mass spectrometry analysis was performed in a Protein Biological System II ProteinChip reader (Ciphergen Biosystems), which was calibrated for mass accuracy by using an ‘all‐in‐1’ peptide. Mass spectrometry profiles were generated using an average 90 nitrogen laser shots with a laser intensity of 155 and a detector sensitivity of 7. Spectrum analysis was performed using the ProteinChip software version 3.0 (Ciphergen Biosystems). All of the pipetting steps were performed using the same laboratory workstation.
ProteinChip SELDI immunoassay. Pre‐activated surface ProteinChip arrays (PS1) have carbonyl diimidazole moieties that can react covalently with their amine groups. 2 μg of purified rabbit monoclonal antihuman C14orf166 antibody (Abcam, Cambridge, UK) was applied on each spot of the PS1 chip and incubated overnight at 4°C. An irrelevant rabbit monoclonal antibody was used as a control for every PS1 chip experiment. Residual active sites were then blocked by incubating the array in a 15 mL conical tube with 8 mL of 1 m ethanolamine, for 30 min, on a shaking platform. After three washes of 5 min each with 0.5% Triton X‐100 in PBS (pH 7.4) followed by three washes for 5 min with PBS (pH 7.4) in a 15 mL conical tube on a shaking platform, the chip was incubated for 5 h in a humidity chamber with 6 μL of serum sample diluted 1:1 with 0.5% Triton X‐100 in PBS (pH 7.4). The chip was washed as previously with 0.5% Triton X‐100 in PBS (pH 7.4) and PBS (pH 7.4), followed by a final wash in 1 mm HEPES buffer. Sinapinic acid was applied on each spot and mass/charge analysis was performed with an average of 90 nitrogen laser shots with a laser intensity of 155 and a detector sensitivity of 7.
Quantitative analysis of human C14orf166 by ELISA. Serum C14orf166 levels in the plasma samples were quantified using a human C14orf166 Immunoassay kit (R&D Systems, Minneapolis, MN, USA) according to the manufacturer’s instructions with minor modifications. The serum samples were diluted at 1:10 and the absorbance at 450 nm was measured for each well on a Ceres UV 900C plate reader (Bio‐Tek Instruments, Winooski, VT, USA). The concentration of C14orf166 in each sample well was reported automatically by the instrument software built into the machine and corrected by the dilution factor.
Immunohistochemistry. Paraffin‐embedded tissue sections (3–5 μm thick) were subjected to immunostaining (Maixin Systems, Shanghai, China). The sections mounted on positively charged slides were incubated for 45 min at 60°C and deparaffinized. Antigen was retrieved by boiling the tissue section in 10 mm sodium citrate buffer (pH 6.0) in a microwave for 20 min. After endogenous peroxidase activity was blocked with a 3% aqueous H2O2 solution for 10 min, the tissue was incubated with the same antibody used in the ProteinChip SELDI immunoassay at a 1:250 dilution for 1 h and then incubated with reinforcing agent for 20 min. The slides were rinsed with washing buffer and incubated with antirabbit antibodies for 30 min at room temperature. The DAB detection kit (Maixin Systems) was used for the detection of the immunostaining. For the negative controls, the PBS buffer substituted for the primary antibody. The intensity, staining percentage, and pattern of staining were assessed. The intensity of protein expression was graded as follows: 0, no staining; 1+, mild; 2+, moderate; 3+, strong. Only moderate and strong staining was considered positive. The staining density was quantified as the percentage of cells stained positively as follows: 0, no staining; 1, positive staining in <25% of the tumor cells; 2, positive staining in 25–50% of the tumor cells; 3, positive staining in >50% of the tumor cells. Intensity score was multiplied with density score to yield an overall score of 0–9 for each specimen. Each slide was read and scored independently by two pathologists in a blinded fashion.
Quantitative analysis of human CA19‐9. CA 19‐9 levels of 58 patients in the PaCa group and 18 patients in the benign disease group were measured using a commercially available electrochemiluminescence immunoassay (Roche Modular E170; Roche, Natick, MA, USA).
Statistical analysis. The spectral region (m/z 0–2000) was unreliable for both normalization and peak detection due to matrix interference and was therefore excluded from the analysis. All of the spectra were compiled, normalized to the total ion current of m/z between 2 k and 30 k, and the baselines were subtracted. The peak intensity was logarithmically transformed to reduce the variance of the data over multiple samples( 18 ) and assessed for statistical significance by the Wilcoxon rank‐sum test with t approximation by SPSS software (SPSS, Chicago, IL, USA) because of the skewed distributions. We used Matlab software (Basel, Switzerland) to combine different decision trees to improve the performance of the overall system. Threefold cross‐validation had been proved to be statistically good enough at evaluating the performance of the classifier. In threefold cross‐validation, the training set is equally divided into three different subsets randomly. Two out of three of the training subsets were used to train the learner, and the third subset was used as the test set. The total serum samples were randomly divided into the training groups (95 PaCa and healthy controls, 62 PaCa and benign pancreatic diseases) and the testing groups (14 PaCa and healthy controls, 14 PaCa and benign pancreatic diseases, respectively). The training groups were divided into three sets, two of which were applied to achieve 1000 decision trees. Furthermore, after assessment of the unseen data in a threefold cross‐validated manner, the top 10 decision trees were chosen with high positive predictive value based on previously testing the group. The transformation parameters of the biomarker candidates identified from serum SELDI‐profiling, based on logistic regression models made by SPSS software from the training set, were to be validated with the other testing set to assess the diagnostic value. In the PaCa group, the protein peaks were compared across different stages and also between the preoperative and postoperative subgroups using Spearman’s correlation. To calculate the sensitivity and specificity of peripheral levels of protein biomarkers at serial cut‐off points, the receiver–operator curves (ROC) were plotted using SPSS software.
Results
Serum SELDI profiles of PaCa versus healthy controls. The SELDI‐TOF‐MS technology is particularly effective in resolving low molecular weight (<30 kDa) just like protein profiles of the PaCa and healthy control groups (Fig. 1). Sixty‐one qualified protein peaks between 2.0 k and 30.0 k m/z ratios were detected by the Biomarker Wizard 3.0 software in all but one of the serum samples. Significant differences were detected in the levels of 26 serum protein biomarkers between PaCa patients and the healthy controls (P < 0.001, Table 1). Fourteen out of 26 protein biomarkers were in high abundance in the PaCa group and the others were in low abundance. The area of 0.62–0.86 (P < 0.001, Table 2) under the ROC (AUC) was obtained as a measure of the diagnostic discriminatory power of the parameters by univariate analysis. It was significantly better to use a combination assay of the protein biomarkers m/z 4137, 8685, 8777, 15 123, 17 250, 28 083, and 12 441 (AUC, 0.976; P < 0.001) in diagnostic power, resulting in a specificity of between 0.922 and 1.000 and a corresponding sensitivity of between 0.914 and 0.776. Application of this logistic model classification using combinations of the seven protein biomarkers gave diagnostic accuracies of up to 0.857 (12 of 14 patients) in the independent testing set including seven PaCa patients and seven healthy individuals. These sixty‐one detected peaks in the training set were then used to construct the decision tree classification model. One thousand decision trees were achieved to distinguish PaCa from healthy controls in a threefold cross‐validated manner with the correct validation rate of 0.828 ± 0.093. The top 10 decision trees with the highest correct validation rate between 0.90 and 0.95 were chosen to establish the classification tree model, which had the high positive predictive value of 0.929 (13 of 14 patients), a sensitivity of 0.833, and a specificity of 1.000 (Fig. 2). Diagnostic accuracy was also 0.929 (13 of 14 patients) for patients in the independent testing set.
Figure 1.
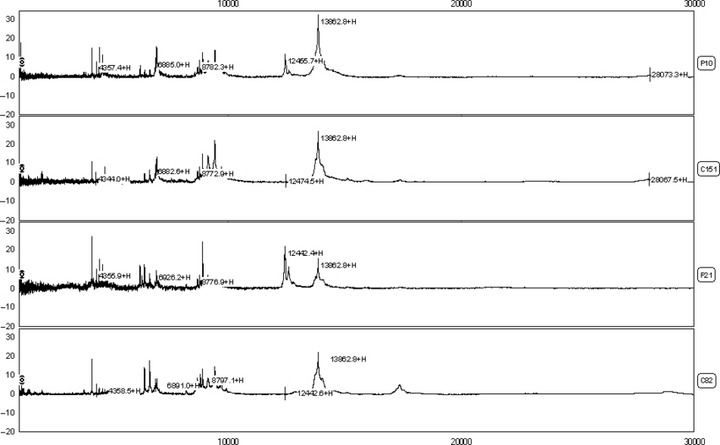
Differential expression of surface enhanced laser desorption/ionization time‐of‐flight mass spectrometry (SELDI‐TOF‐MS) in the comparison of pancreatic adenocarcinoma (PaCa) (p10,p21) and healthy control (c151,c82) sera. Profiles shown in peak display (ranging from 2–30k m/z ratios).
Table 2.
Protein peaks differentially expressed in PaCa and healthy control serum detected on SAX2 chip including the independent training and testing sets and the AUC for differential diagnosis between PaCa and healthy control
| m/z (Da) | P value | Intensity PaCa (test) | Intensity control (test) | AUC (P < 0.001) |
|---|---|---|---|---|
| 4137 | 2.00E‐09 | 5.93 ± 5.74/5.28 ± 2.44 | 2.19 ± 1.15/2.38 ± 0.79 | 0.856 ± 0.035 |
| 12 441 | 1.40E‐09 | 4.73 ± 4.36/5.96 ± 5.89 | 1.36 ± 1.29/2.74 ± 2.17 | 0.837 ± 0.038 |
| 4359 | 2.56E‐08 | 5.96 ± 4.61/5.51 ± 1.12 | 2.87 ± 1.30/2.61 ± 1.21 | 0.810 ± 0.041 |
| 4791 | 3.89E‐08 | 3.86 ± 3.70/3.72 ± 1.55 | 1.83 ± 0.65/2.00 ± 0.68 | 0.806 ± 0.042 |
| 28 068 | 1.76E‐07 | 2.45 ± 2.73/3.40 ± 4.12 | 0.61 ± 0.61/1.11 ± 0.98 | 0.791 ± 0.042 |
| 4016 | 2.44E‐07 | 2.16 ± 1.61/2.38 ± 1.42 | 0.86 ± 0.65/0.74 ± 0.61 | 0.787 ± 0.043 |
| 12 600 | 2.04E‐06 | 2.84 ± 1.97/3.60 ± 3.50 | 1.46 ± 1.22/2.68 ± 2.05 | 0.764 ± 0.046 |
| 4541 | 2.60E‐06 | 4.45 ± 3.59/4.23 ± 2.50 | 2.16 ± 1.47/2.00 ± 1.61 | 0.762 ± 0.046 |
| 15 123 | 2.92E‐06 | 1.54 ± 2.01/1.47 ± 0.72 | 2.62 ± 1.60/3.35 ± 2.45 | 0.760 ± 0.046 |
| 8777 | 3.01E‐06 | 3.34 ± 1.70/3.79 ± 1.92 | 5.06 ± 1.53/4.87 ± 0.98 | 0.760 ± 0.045 |
| 15 885 | 1.37E‐05 | 0.49 ± 0.80/0.47 ± 0.26 | 0.94 ± 0.77/1.28 ± 1.04 | 0.742 ± 0.047 |
| 8685 | 3.93E‐05 | 4.85 ± 2.77/5.75 ± 2.92 | 6.95 ± 1.64/6.91 ± 1.71 | 0.729 ± 0.048 |
| 4124 | 4.48E‐05 | 3.27 ± 2.75/4.83 ± 2.98 | 1.66 ± 1.24/1.60 ± 1.00 | 0.727 ± 0.049 |
| 17 250 | 4.48E‐05 | 1.13 ± 0.83/1.03 ± 0.78 | 1.75 ± 0.63/1.77 ± 0.38 | 0.727 ± 0.049 |
| 4629 | 4.60E‐05 | 14.09 ± 11.31/12.41 ± 5.07 | 7.62 ± 5.22/8.52 ± 5.06 | 0.727 ± 0.048 |
| 3444 | 4.98E‐05 | 1.84 ± 2.29/2.05 ± 1.92 | 0.62 ± 0.66/0.57 ± 0.48 | 0.726 ± 0.048 |
| 6889 | 8.31E‐05 | 3.50 ± 1.25/3.31 ± 0.95 | 4.56 ± 1.35/4.05 ± 1.38 | 0.719 ± 0.049 |
| 28 083 | 1.02E‐04 | 1.68 ± 1.97/1.45 ± 1.64 | 2.68 ± 2.00/2.11 ± 2.13 | 0.716 ± 0.050 |
| 5071 | 1.59E‐04 | 2.43 ± 1.93/1.95 ± 1.18 | 1.30 ± 0.55/1.43 ± 0.68 | 0.710 ± 0.049 |
| 8812 | 2.28E‐04 | 4.34 ± 2.86/5.63 ± 3.53 | 6.06 ± 2.32/7.38 ± 1.96 | 0.705 ± 0.050 |
| 13 864 | 2.95E‐04 | 15.08 ± 7.85/18.90 ± 7.95 | 20.38 ± 5.98/19.98 ± 7.60 | 0.701 ± 0.050 |
| 4056 | 4.09E‐04 | 2.45 ± 2.73/2.32 ± 0.78 | 1.23 ± 1.62/0.92 ± 0.58 | 0.697 ± 0.051 |
| 4190 | 5.25E‐04 | 5.80 ± 5.63/2.31 ± 0.69 | 3.76 ± 4.75/3.59 ± 3.72 | 0.693 ± 0.052 |
| 14 040 | 5.62E‐04 | 6.07 ± 2.97/7.58 ± 2.46 | 8.12 ± 2.00/7.73 ± 2.55 | 0.692 ± 0.050 |
| 8561 | 7.18E‐04 | 1.74 ± 1.48/1.15 ± 0.68 | 2.54 ± 1.07/1.85 ± 0.70 | 0.688 ± 0.051 |
| 7562 | 8.56E‐04 | 1.05 ± 1.59/1.04 ± 0.73 | 1.83 ± 1.63/2.43 ± 2.46 | 0.686 ± 0.052 |
Figure 2.
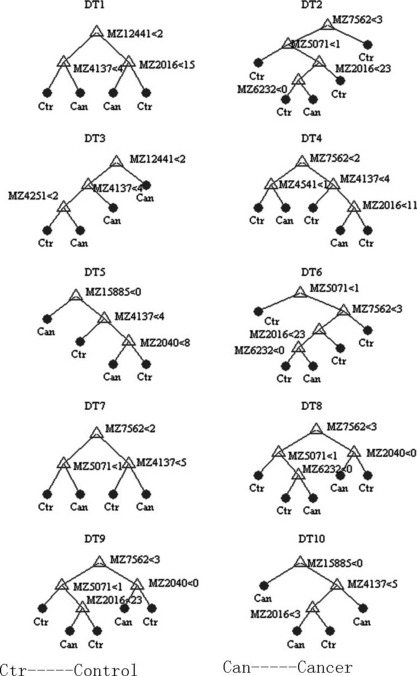
Diagram of a decision tree for the classification of pancreatic adenocarcinoma (PaCa) and healthy controls. Mass spectra from the sera of 58 PaCa and 51 healthy controls ranging from 2–30k m/z ratios.
Serum SELDI profiles of PaCa versus benign pancreatic diseases. Significant differences were detected in the levels of 16 serum protein biomarkers between PaCa patients and benign pancreatic disease patients (P < 0.05, Table 3). Six protein biomarkers were in high abundance in the PaCa group and ten were in low abundance. The area of 0.67–0.80 (P < 0.05, Table 3) under their ROC (AUC) was obtained as a measure of the diagnostic discriminatory power of the parameters. It was significantly better to use a combination assay p of the protein biomarkers m/z 2266, 4378, and 13 864 (AUC, 0.933; P < 0.001, Fig. 3) in diagnostic power, resulting in a specificity of between 0.769 and 1.000 and a corresponding sensitivity of between 0.958 and 0.708. Application of this logistic model classification using combinations of the three protein biomarkers gave diagnostic accuracies of up to 0.857 (12 of 14 patients) in the independent testing set including seven PaCa patients and seven benign pancreatic disease patients. However, there was a strong trend for a superior discrimination of PaCa from benign pancreatic disease combining SELDI profiling and CA 19‐9 (P < 0.001). The combination p1 of CA 19‐9 and the discriminating peaks had an AUC of 0.976 (P < 0.001, Fig. 3), resulting in a specificity of between 0.923 and 1.000 and a corresponding sensitivity of between 0.958 and 0.750, and diagnostic accuracies of up to 0.929 (13 of 14 patients) in the independent testing set. These identified 61 peaks in the training set were then used to construct the decision tree classification model. One thousand decision trees were achieved to distinguish PaCa and benign pancreatic disease in a threefold cross‐validated manner with the correct validation rate of 0.687 ± 0.108. The top 10 decision trees with the highest correct validation rate between 0.90 and 0.95 were chosen to establish the classification tree model, which had the high positive predictive value of 0.929 (13 of 14 patients), a sensitivity of 0.833, and a specificity of 1.000 (Fig. 4). Diagnostic accuracy was 0.857 (12 of 14 patients) for patients in the independent testing set. So the classification tree model was superior to CA 19‐9 in the discrimination of PaCa from benign pancreatic disease samples. The latter had a sensitivity of 0.813 and a specificity of 0.770 (Fig. 5).
Table 3.
Protein peaks differentially expressed in the PaCa and pancreatic benign disease serum detected on SAX2 chip including the independent training and testing sets and the AUC for differential diagnosis between PaCa and pancreatic benign disease
| m/z (Da) | P value | Intensity PaCa: train/test | Intensity benign disease: train/test | AUC (P < 0.05) |
|---|---|---|---|---|
| 6929 | 1.45E‐04 | 6.06 ± 3.67/6.32 ± 3.51 | 11.39 ± 5.85/12.16 ± 4.36 | 0.798 ± 0.059 |
| 13 864 | 4.09E‐03 | 15.08 ± 7.85/18.90 ± 7.95 | 21.45 ± 8.00/22.55 ± 9.34 | 0.725 ± 0.068 |
| 4378 | 5.76E‐03 | 1.93 ± 1.18/1.83 ± 0.72 | 3.00 ± 2.03/2.37 ± 0.99 | 0.716 ± 0.066 |
| 8207 | 7.19E‐03 | 1.64 ± 0.84/1.21 ± 0.62 | 1.12 ± 0.60/0.87 ± 0.40 | 0.711 ± 0.069 |
| 2266 | 8.93E‐03 | 0.94 ± 1.63/0.95 ± 1.04 | 1.99 ± 2.11/3.08 ± 2.78 | 0.705 ± 0.064 |
| 2016 | 9.26E‐03 | 4.07 ± 5.60/4.82 ± 4.55 | 6.87 ± 6.33/8.30 ± 7.78 | 0.704 ± 0.064 |
| 6441 | 9.26E‐03 | 9.86 ± 6.63/12.09 ± 6.81 | 5.92 ± 3.94/3.91 ± 2.03 | 0.704 ± 0.070 |
| 2040 | 1.07E‐02 | 3.05 ± 4.44/3.59 ± 3.14 | 5.04 ± 4.83/6.69 ± 5.87 | 0.700 ± 0.061 |
| 2066 | 1.31E‐02 | 1.99 ± 2.77/2.40 ± 2.12 | 3.08 ± 2.82/4.09 ± 3.85 | 0.694 ± 0.060 |
| 4155 | 1.66E‐02 | 31.99 ± 17.82/33.24 ± 12.24 | 48.79 ± 27.30/44.21 ± 14.16 | 0.688 ± 0.080 |
| 4791 | 1.90E‐02 | 3.86 ± 3.70/3.72 ± 1.54 | 2.27 ± 0.81/2.29 ± 0.95 | 0.684 ± 0.062 |
| 14 040 | 2.70E‐02 | 6.07 ± 2.96/7.57 ± 2.47 | 7.85 ± 2.92/8.43 ± 3.00 | 0.673 ± 0.074 |
| 8923 | 2.87E‐02 | 12.98 ± 6.09/12.80 ± 6.16 | 9.82 ± 3.52/8.29 ± 3.53 | 0.671 ± 0.065 |
| 28 068 | 3.06E‐02 | 2.45 ± 2.73/2.94 ± 1.01 | 1.49 ± 1.27/1.44 ± 0.94 | 0.670 ± 0.066 |
| 12 857 | 3.25E‐02 | 0.99 ± 0.43/1.24 ± 0.67 | 1.23 ± 0.46/1.30 ± 0.44 | 0.668 ± 0.073 |
| 6640 | 3.89E‐02 | 11.85 ± 6.35/12.19 ± 4.29 | 8.49 ± 5.39/5.89 ± 4.30 | 0.662 ± 0.076 |
Figure 3.
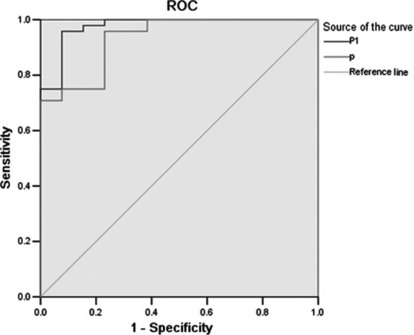
Receiver–operator curves (ROC) for the performance of marker panels derived from surface enhanced laser desorption/ionization (SELDI) (line below p: area under the curve [AUC] = 0.933) and a combined index of CA 19‐9 and marker panels derived from SELDI (the line above p1: AUC = 0.976).
Figure 4.
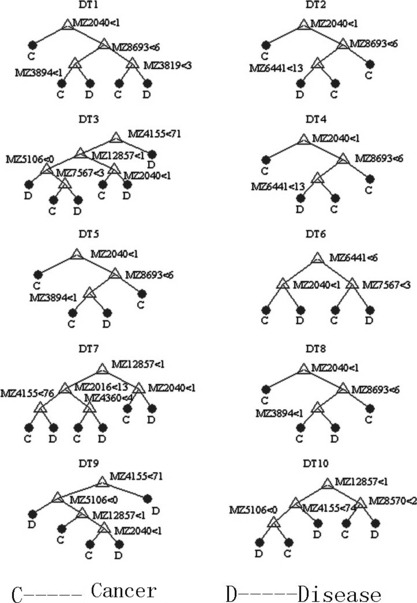
Diagram of a decision tree for the classification of pancreatic adenocarcinoma (PaCa) and benign pancreatic disease. Mass spectra from the sera of 58 PaCa and 18 benign pancreatic disease ranging from 2–30k m/z ratios.
Figure 5.
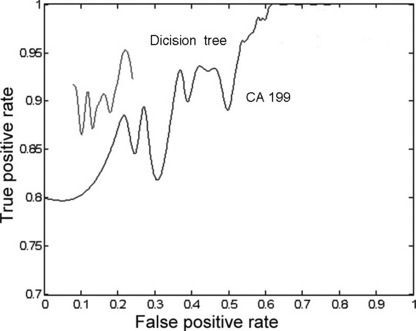
Receiver–operator curves (ROC) for the performance of marker panels derived from CA 19‐9 (the line below) and the classification tree model (the line above). The latter was achieved by lots of prune curves; unfortunately the value of top and the end was unpredictable.
Serum SELDI profiles of PaCa versus noncancer controls. The three most discriminating protein biomarkers (m/z 4155, 4791, and 28 068) were detected, which yielded an AUC of 0.795, through the comparison of the PaCa group and the noncancer group (i.e. healthy controls and the benign pancreatic disease group). There was a strong trend for a superior discrimination of PaCa from noncancer when combining SELDI profiling and CA 19‐9 (P < 0.001). The combination p of CA 19‐9 and the three discriminating peaks had an AUC of 0.931 (Fig. 6) resulting in a sensitivity of between 0.646 and 0.917 and a specificity of between 1.000 and 0.846. We applied a further test of logistic model classification on the entire independent testing set of 21 patients, obtaining an accuracy of 0.905, which was better than that of CA 19‐9 (overall accuracy, 0.762).
Figure 6.
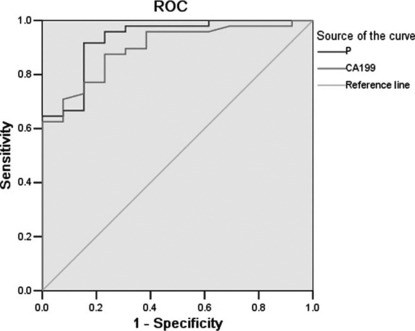
Receiver–operator curve (ROC) for the performance of CA 19‐9 (the line below: area under the curve [AUC] = 0.897) and a combined index of CA 19‐9 and marker panels derived from surface enhanced laser desorption/ionization (SELDI) (the line above p: AUC = 0.931).
Serum SELDI profiles of PaCa in different stages. A panel of the six most discriminating protein biomarkers could classify patients with PaCa in different stages. The intensity of four protein biomarker peaks (m/z 4541, 4629, 5071, 12 441) which were rich in the PaCa group increased as stages advanced, while that of the other two protein biomarker peaks (m/z 2040, 2066), which were low, decreased (P < 0.05). There was a significant improvement when predicting different PaCa stages by combining the SELDI six protein peaks. The AUC were 0.897 (between stage I and stage II), 0.978 (between stage II and stage III), and 0.792 (between stage III and stage IV) (P < 0.05) in the diagnosis of different PaCa stages.
Serum SELDI profiles of preoperative versus postoperative serum of PaCa. There was a down‐regulated trend (P < 0.05) in the most discriminating protein biomarker (m/z 4016) rich in PaCa after operation, through analyzing the preoperative cancer group and the postoperative cancer group (1, 2, 4 weeks, and 6 months after operation) (Fig. 7). When this protein biomarker was observed in the independent testing set, there was a clear downward trend in six of seven PaCa patients.
Figure 7.
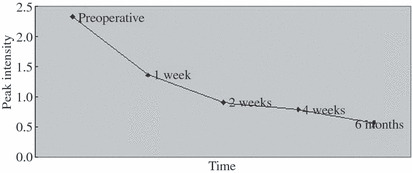
Trend of the protein biomarker (m/z 4016) after operation (preoperative samples, 1, 2, 4 weeks, and 6 months after operation).
Identification of C14orf166 by SELDI immunoassay. One peak of 61 protein peaks had a mass of 28 068 Da and displayed a highly significant difference in the distribution of intensities of peaks in the pancreatic carcinoma serum group compared with the other two serum groups. To identify the m/z 28 068 protein biomarker, we used the TagIdent tool from the ExPASy molecular biology serer. By entering the mass of an unknown protein, this tool will search in the SWISS‐PROT and TrEMBL protein databases for proteins that match the requested mass. We found that the secreted form of the human C14orf166 (SWISS‐PROT accession no. Q9Y224), with a mass of 28 068 Da, was among the first matches for our request. To confirm that the 28 068‐Da protein identified by differential screening of pancreatic serum samples was C14orf166, we performed a SELDI‐based immunoassay with a specific anti‐C14orf166 monoclonal antibody on 10 pancreatic serum samples: five for which the 28 068 Da peak was present and five for which a 28 068 Da peak was nearly absent on the SAX2 chip. We found that a specific peak of mean mass at 28 068 Da with an intensity of 3.33 ± 1.76 was present in all five samples that displayed a peak on the SAX2 chip, and the peak had an intensity of 0.60 ± 0.43 in the other five samples (Fig. 8).
Figure 8.
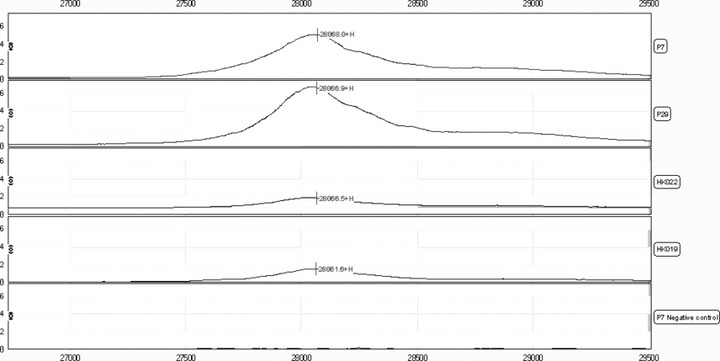
Representative examples of the surface enhanced laser desorption/ionization (SELDI) ProteinChip immunoassay spectrum detecting C14orf166 in four pancreatic serum samples (PaCa: P7, P29; healthy controls: HK022, HK019). A peak corresponding to C14orf166 was not present in the pancreatic serum from the same serum sample (PaCa: P7) that displayed a 28 068 Da peak on SELDI analysis with SAX2 when an irrelevant antibody was substituted for anti‐C14orf166 antibody (negative control).
Quantification of C14orf166 levels in serum using ELASA. In 127 individual serum samples including 58 PaCa, 18 pancreatic benign diseases, and 51 healthy controls, C14orf166 levels were detected. In univariate analyses, age and higher serum C14orf166 concentrations were associated with an increased risk of PaCa, whereas gender and age were not associated with this outcome. C14orf16 serum concentrations were significantly higher in patients with PaCa (24.21 ± 10.42 μg/mL) than in patients with pancreatic benign diseases (9.11 ± 4.57) and healthy controls (7.78 ± 3.69) (P < 0.001). There was no statistically significant difference when comparing levels in patients with pancreatic benign diseases and healthy controls (P = 0.34). The sensitivity and specificity of a serum C14orf166 level of 14.56 μg/mL for predicting PaCa in healthy controls was 82.8/92.2% and 82.8/88.9% compared with benign disease, respectively. An ROC curve (AUC, 0.938/0.917; P < 0.001) illustrating the sensitivity and specificity levels of serum C14orf166 at increasing concentrations is shown in Figure 9.
Figure 9.
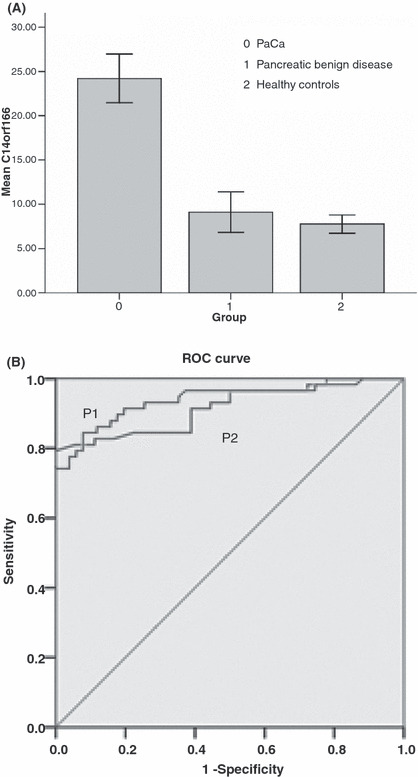
(A) C14orf16 serum concentrations from patients with pancreatic adenocarcinoma (PaCa), pancreatic benign disease, and healthy controls. Error bars, 95% confidence interval. (B) P1: receiver–operator curves (ROC) are shown for serum C14orf166 levels demonstrating the sensitivity and specificity for predicting PaCa from the healthy control (area under the curve [AUC] = 0.938). P2: ROC curves are shown for serum C14orf166 levels demonstrating the sensitivity and specificity for predicting PaCa from pancreatic benign disease (AUC = 0.917). Diagonal segments are produced by ties.
Immunohistochemical analysis of C14orf166 in PaCa. We analyzed C14orf166 expression by immunohistochemistry in patients undergoing pancreatectomy including 35 PaCa. A control slide with PBS buffer substituted for the anti‐C14orf166 antibody was used as a negative control. In the normal pancreas, acini were weakly labeled or not labeled for C14orf166 and focal cytoplasmic staining was observed in a few ductal cells. In contrast, 29 from 35 (82.9%) of the PaCa cases showed positive C14orf166 expression and C14orf166 proteins were localized in the cytoplasm of tumor cells. In these tumors with positive expression, the number of immunoreactive cells ranged from very few to almost all of tumor cells (Fig. 10). Semi‐quantitative scoring showed that C14orf166 expression levels of cancer cells (5.05 ± 3.0) were significantly higher than in the normal pancreas (0.83 ± 0.95, P < 0.001).
Figure 10.
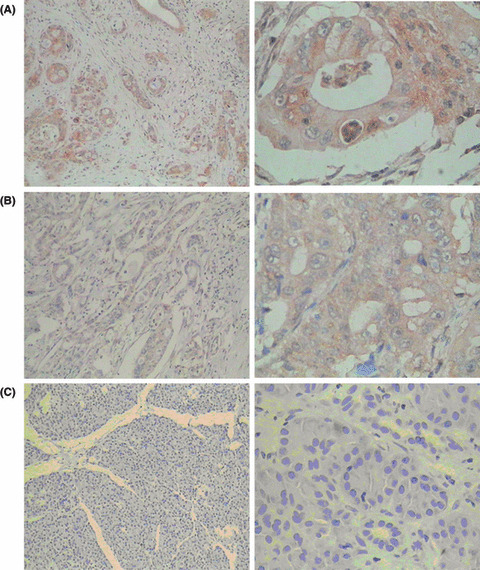
Immunohistochemical expression of C14orf166 in invasive pancreatic adenocarcinoma (PaCa). C14orf166 expressions were detected in the cytoplasm of tumor cells; original magnification, A–C (left) ×100; A–C (right) ×400. (A) Strong staining and almost all of the tumor cells expressed. (B) Moderate staining and almost all of the tumor cells expressed. (C) No staining and no normal pancreas cells expressed.
Discussion
Currently, there are no ideal methods for the early detection of PaCa. Current imaging studies are inadequate for the identification of lesions at the severe dysplastic stage (PanIN 3); moreover, these imaging modalities do not reliably detect tumors <1–2 cm in size.( 24 ) Sensitivities and specificities, as low as 0.56 and 0.45, respectively, of endoscopic ultrasound (EUS) morphology for differentiation between mucinous and non‐mucinous lesions have been reported.( 25 , 26 ) Radiological imaging studies such as computed tomography are often used to characterize pancreatic lesions, and several studies have used heterogeneous radiological criteria for discrimination between benign and pre‐malignant/malignant lesions.( 27 , 28 , 29 , 30 , 31 ) So general serum is an ideal diagnostic specimen, especially due to its ease and inexpensive access.( 32 ) Therefore, the use of serum biological markers for the early detection of PaCa is our most promising approach.( 33 , 34 ) Recently, proteomics has attempted to link the thousands of proteins detected in various fluids and tissues with the human genome.( 18 ) The use of SELDI for high‐throughput profiling of serum proteins has gained attention as an easy method for identifying panels of peptides and proteins that may be indicative of early disease for several cancers.( 17 , 35 , 36 , 37 ) Because of the different characteristics of the protein chips applied to SELDI‐TOF‐MS, different proteins can be detected. Currently, the SAX protein chip has not been used to predict or discriminate between different cancer stages, or to evaluate the prognosis of PaCa. Using a similar approach, we have detected protein profiles in this study that were capable of distinguishing sera of PaCa patients from noncancer patients.
Every candidate protein biomarker identified from serum SELDI profiling was valued in the diagnosis of PaCa (2, 3). To enhance the selection of mass peaks with biologic relevance, spectral data were analyzed by two independent multivariate methods including logistic regression and decision tree algorithm to obtain the optimal combination to achieve the diagnosis of PaCa in different sub‐sets. We conducted multivariate analyses to find sets of biomarkers that held promise in distinguishing between PaCa and healthy controls, and demonstrated another classification tree model with sensitivity of 0.833 and specificity of 1.000. This study demonstrates that SELDI profiling of serum is significantly better than the current standard serum biomarker CA 19‐9 at distinguishing patients with PaCa from those with benign pancreatic disease. We chose patients with a variety of pancreatic diseases in our benign disease control group to mimic real‐life diagnostic difficulties. The finding showed that the classification tree model successfully distinguished them with a sensitivity and specificity of 0.833 and 1.000, but CA 19‐9 with 0.813 and 0.770, respectively. In addition, for the differentiation of diseases, the combination of serum SELDI multiple markers or these markers and CA 19‐9 both yielded superior diagnostic performance to CA 19‐9 alone. Three of the detected protein biomarkers (m/z 4155, 4791, and 28 068) could discriminate PaCa from noncancer disease. The combination of CA 19‐9 and the three discriminating peaks had an AUC of 0.931, suggesting the potential significance of the model in the PaCa differential diagnosis. We also created independent training and testing sets, and achieved diagnostic accuracies of not <0.857, which was better than with CA 19‐9 (overall accuracy, 0.762), in our testing sets individually. It could provide robust estimates of the generalization capability of the classifier in the diagnosis and differential diagnosis of PaCa.
One approach to improve the dismal prognosis for an individual suffering from PaCa consists of diagnosing the disease at an earlier and hopefully more curable stage. A tumor marker can be defined as any substance that is in abnormal concentration in serum; is reproducible, rapid, widely available, and acceptable when measured; and has properties including high sensitivity, specificity, and correlation between concentration and tumor mass. So far, no tumor marker in PaCa has been shown to be useful in the screening of an asymptomatic population. In our study, the difference in detected protein biomarkers across different stages was focused on and the levels of protein biomarkers (m/z 4541, 4629, 5071, 12 441, 2040, and 2066) changed significantly in different stages, the first biomarker rich in PaCa increased with the advance of disease stage, and the other two low in PaCa decreased. It is possible that the worsening of patients’ general condition according to the progression of tumors is represented by the decrease of essential proteins such an albumin together with m/z 2040 and 2066. Combining these biomarkers could classify patients in different stages with a high AUC. Maybe the biomarkers play an important role in early detection in, for instance, PanIN lesions, hidden PaCa in chronic pancreatitis and intraductal papillary mucinous carcinoma, and evaluation of PaCa and the choice of therapeutic methods for the patient.
In addition to the large body of work accumulating on diagnosis, there is interest in using proteomic technology to examine response to therapy. In theory, treatment could be monitored by examining the proteomic profiles of serum both pre‐ and post‐therapy. These protein biomarkers were also detectable in a subset of patients who already had undergone surgery to remove tumors, suggesting that this could be used as a marker for residual disease. The most discriminating peaks (m/z 4016) in high abundance in PaCa sera appear to have the potential to serve as markers for response to therapy following surgery or chemotherapy, thereby allowing earlier opportunities to explore other therapeutic options.
Our results show that some protein biomarkers will shed light on the diagnosis. It is essential to gain insight into the biology of the potential biomarkers and to know the identity of these proteins. Using a ProeinChip‐based approach to screen for differentially expressed proteins, we identified C14orf166 as elevated in the serum of patients with PaCa. The sensitivity and specificity of a serum C14orf166 level of ≥14.56 μg/mL was 82.8/92.2% and 82.8/88.9% for the two control groups, respectively. Interestingly, the transcript of C14orf166 was expressed more distinctly in PaCa than in the normal pancreas. Howng et al. ( 38 ) found that C14orf166 might participate in the centrosome architecture as well as regulate centrosome formation by interacting with hNinein and blocking hNinein phosphorylation; furthermore, C14orf166 was highly expressed in many brain tumors. Cui et al. ( 39 ) also identified C14orf166 by MALDI‐TOF‐TOF and confirmed that it was up‐regulated in pancreatic cancer tissues and associated with LNM, which seems to be in accord with our results. But the specific mechanism of the candidate biomarker C14orf166 is unknown. Our data suggest that C14orf166 is involved in the event of PaCa and can be detected in the serum as well as the tumor tissue of patients. We can surmise that C14orf166 is tumor‐associated and that additional studies are needed to determine the contribution of C14orf166 to PaCa.
In summary, the findings of the current study have demonstrated that SELDI‐TOF‐MS, in combination with the classification algorithm including the decision tree and the logistic regression, can distinguish patients with PaCa from noncancer controls, which is superior to CA 19‐9, and can evaluate the prognosis and efficacy of patients with PaCa. By a ProteinChip‐based technology, we have demonstrated that C14orf166 is a potential serum biomarker specifically expressed in the tumor cell cytoplasm in PaCa. The emergence of new technologies for the identification of unknown proteins for mass spectrometry profiles is expected to accelerate the discovery of biomarkers that will increase the rate of early diagnosis of PaCa.
Acknowledgments
This study was supported by the Science and Technology Commission of Shanghai Municipality in China (no. 05JC14013).We are grateful to the Minxin Information and Technology Limited Company in Shanghai for their statistical work.
References
- 1. DiMagno EP, Reber HA, Tempero MA. Epidemiology, diagnosis, and treatment of pancreatic ductal adenocarcinoma. Gastroenterology 1999; 117: 1463–84. [DOI] [PubMed] [Google Scholar]
- 2. Jemal A, Murray T, Samuels A. Cancer statistics 2003. CA Cancer J Clin 2003; 53: 5–26. [DOI] [PubMed] [Google Scholar]
- 3. Pleskow DK, Berher HJ, Gyves J, Allen E, McLean A, Podolsky DK. Evaluation of a serologic marker, CA19–9, in the diagnosis of pancreatic cancer. Ann Intern Med 1989; 110: 704–9. [DOI] [PubMed] [Google Scholar]
- 4. Goggins M, Canto M, Hruban RH. Can we screen high‐risk individuals to detect early pancreatic carcinoma? J Surg Oncol 2000; 74: 243–8. [DOI] [PubMed] [Google Scholar]
- 5. Wright GL, Cazares LH, Leung SM et al. ProteinChip surface enhanced laser desorption/ionization mass spectrometry: a novel protein biochip technology for detection of prostate cancer biomarkers in complex protein mixtures. Prostate Cancer Prostatic Dis 1999; 2: 264–76. [DOI] [PubMed] [Google Scholar]
- 6. Conrads TP, Fusaro VA, Ross S et al. High‐resolution serum proteome features for ovarian cancer detection. Endocr Relat Cancer 2004; 11: 163–78. [DOI] [PubMed] [Google Scholar]
- 7. Coombes KR, Fritsche HA, Clarke C et al. Quality control and peak finding for proteomics data collected from nipple aspirate fluid by surface‐enhanced laser desorption and ionization. Clin Chem 2003; 49: 1615–23. [DOI] [PubMed] [Google Scholar]
- 8. Qu Y, Adam BL, Thornquist M. Data reduction using a discrete wavelet transformation in discriminant analysis of very high dimensinality data. Biometrics 2003; 59: 143–51. [DOI] [PubMed] [Google Scholar]
- 9. Orvisky E, Drake SK, Martin BM et al. Enrichment of low molecular weight fraction of serum for MS analysis of peptides associated with hepatocellular carcinoma. Proteomics 2006; 6: 2895–902. [DOI] [PubMed] [Google Scholar]
- 10. Yasui Y, Pepe M, Thompson ML et al. A data‐analytic strategy for protein biomarker discovery: profiling of high‐dimensional proteomic data for cancer detection. Biostatistics 2003; 4: 449–63. [DOI] [PubMed] [Google Scholar]
- 11. Merchant M, Weinberger SR. Recent advancements in surface‐enhanced laser desorption/ionization‐time of flight‐mass spectrometry. Electrophoresis 2000; 21: 1164–77. [DOI] [PubMed] [Google Scholar]
- 12. Engwegen JY, Gast MC, Schellens JH, Beijnen JH. Clinical proteomics: searching for better tumour markers with SELDI‐TOF mass spectrometry. Trends Pharmacol Sci 2006; 27: 251–9. [DOI] [PubMed] [Google Scholar]
- 13. Petricoin EF, Ardekani AM, Hitt BA et al. Use of proteomic patterns in serum to identify ovarian cancer. Lancet 2002; 359: 572–7. [DOI] [PubMed] [Google Scholar]
- 14. Kozak KR, Amneus MW, Pusey SM et al. Identification of biomarkers for ovarian cancer using strong anion‐exchange ProteinChips: potential use in diagnosis and prognosis. Proc Natl Acad Sci USA 2003; 100: 12343–8. [DOI] [PMC free article] [PubMed] [Google Scholar]
- 15. Petricoin EF, Ornstein DK, Paweletz CP et al. Serum proteomic patterns for detection of prostate cancer. J Natl Cancer Inst 2002; 94: 1576–8. [DOI] [PubMed] [Google Scholar]
- 16. Bañez LL, Prasanna P, Sun L et al. Diagnostic potential of serum proteomic patterns in prostate cancer. J Urol 2003; 170: 442–6. [DOI] [PubMed] [Google Scholar]
- 17. Adam BL, Qu Y, Davis JW et al. Serum protein fingerprinting coupled with a pattern‐matching algorithm distinguishes prostate cancer from benign prostate hyperplasia and healthy men. Cancer Res 2002; 62: 3609–14. [PubMed] [Google Scholar]
- 18. Li J, Zhang Z, Rosenzweig J, Wang YY, Chan DW. Proteomics and bioinformatics approaches for identification of serum biomarkers to detect breast cancer. Clin Chem 2002; 48: 1296–304. [PubMed] [Google Scholar]
- 19. Won Y, Song HJ, Kang TW, Kim JJ, Han BD, Lee SW. Pattern analysis of serum proteome distinguishes renal cell carcinoma from other urologic diseases and healthy persons. Proteomics 2003; 3: 2310–6. [DOI] [PubMed] [Google Scholar]
- 20. Vlahou A, Schellhammer PF, Mendrinos S et al. Development of a novel proteomic approach for the detection of transitional cell carcinoma of the bladder in urine. Am J Pathol 2001; 158: 1491–502. [DOI] [PMC free article] [PubMed] [Google Scholar]
- 21. Rosty C, Christa L, Kuzdzal S et al. Identification of hepatocarcinoma‐intestine‐pancreas/pancreatitis‐associated protein I as a biomarker for pancreatic ductal adenocarcinoma by protein biochip technology. Cancer Res 2002; 62: 1868–75. [PubMed] [Google Scholar]
- 22. Koopmann J, Zhang Z, White N et al. Serum diagnosis of pancreatic adenocarcinoma using surface‐enhanced laser desorption and ionization mass spectrometry. Clin Cancer Res 2004; 10: 860–8. [DOI] [PubMed] [Google Scholar]
- 23. Yu Y, Chen S, Wang LS et al. Prediction of pancreatic cancer by serum biomarkers using surface‐enhanced laser desorption/ionization‐based decision tree classification. Oncology 2005; 68: 79–86. [DOI] [PubMed] [Google Scholar]
- 24. Brand R, Matamoros A. Imaging techniques in the evaluation of adenocarcinoma of the pancreas. Dig Dis 1998; 16: 242–52. [DOI] [PubMed] [Google Scholar]
- 25. Brugge WR, Lewandrowski K, Lee‐Lewandrowski E et al. Diagnosis of pancreatic cystic neoplasms: a report of the cooperative pancreatic cyst study. Gastroenterology 2004; 126: 1330–6. [DOI] [PubMed] [Google Scholar]
- 26. Song MH, Lee SK, Kim MH et al. EUS in the evaluation of pancreatic cystic lesions. Gastrointest Endosc 2003; 57: 891–6. [DOI] [PubMed] [Google Scholar]
- 27. Sedlack R, Affi A, Vazquez‐Sequeiros E, Norton ID, Clain JE, Wiersema MJ. Utility of EUS in the evaluation of cystic pancreatic lesions. Gastrointest Endosc 2002; 56: 543–7. [DOI] [PubMed] [Google Scholar]
- 28. Le Borgne J, De Calan L, Partensky C. Cystadenomas and cystadenocarcinomas of the pancreas: a multi‐institutional retrospective study of 398 cases. French Surgical Association. Ann Surg 1999; 230: 152–61. [DOI] [PMC free article] [PubMed] [Google Scholar]
- 29. Johnson CD, Stephens DH, Charboneau JW, Carpenter HA, Welch TJ. Cystic pancreatic tumors: CT and sonographic assessment. AJR Am J Roentgenol 1988; 151: 1133–8. [DOI] [PubMed] [Google Scholar]
- 30. Ahmad NA, Kochman ML, Lewis JD, Ginsberg GG. Can EUS alone differentiate between malignant and benign cystic lesions of the pancreas? Am J Gastroenterol 2001; 96: 3295–300. [DOI] [PubMed] [Google Scholar]
- 31. PelaezLuna M, Chari ST. Cyst fluid analysis to diagnose pancreatic cystic lesions an as yet unfulfilled promise. Gastroenterology 2006; 130: 1007–9, discussion 1009. [DOI] [PubMed] [Google Scholar]
- 32. Abbruzzese J. Molecular diagnosis of pancreatic and biliary cancer: ready for broad implementation? Cancer J 2000; 6: 282–4. [PubMed] [Google Scholar]
- 33. Barkin JS, Goldstein JA. Diagnostic and therapeutic approach to pancreatic cancer. Biomed Pharmacother 2000; 54: 400–9. [DOI] [PubMed] [Google Scholar]
- 34. Phizicky E, Bastiaens PI, Zhu H, Snyder M, Fields S. Protein analysis on a proteomic scale. Nature 2003; 422: 208–15. [DOI] [PubMed] [Google Scholar]
- 35. Poon TC, Yip TT, Chan AT et al. Comprehensive proteomic profiling identifies serum proteomic signatures for detection of hepatocellular carcinoma and its subtypes. Clin Chem 2003; 49: 752–60. [DOI] [PubMed] [Google Scholar]
- 36. Rai AJ, Zhang Z, Rosenweig J et al. Proteomic approaches to tumor marker discovery: identification of biomarkers for ovarian cancer. Arch Pathol Lab Med 2002; 126: 1518–26. [DOI] [PubMed] [Google Scholar]
- 37. Khalid A, Finkelstein S, McGrath K. Molecular diagnosis of solid and cystic lesions of the pancreas. Clin Lab Med 2005; 25: 101–16. [DOI] [PubMed] [Google Scholar]
- 38. Howng SL, Hsu HC, Cheng TS et al. A novel ninein‐interaction protein CGI‐99, blocks ninein phosphorylation by GSK3beta and is highly expressed in brain tumors. FEBS Lett 2004; 566: 162–8. [DOI] [PubMed] [Google Scholar]
- 39. Cui YZ, Wu JW, Zong MJ et al. Proteomic profiling in pancreatic cancer with and without lymph node metastasis. Int J Cancer 2009; 124: 1614–21. [DOI] [PubMed] [Google Scholar]


