

Abstract
To search for potential protein markers of colorectal cancer (CRC), the changes in protein expression levels between microdissected tumor cells and normal mucosa epithelia were analyzed by an acetylation stable isotopic labeling method coupled with linear quadrupole ion trap fourier transform mass spectrometry (LTQ‐FTMS). In total, 137 proteins were up‐regulated or down‐regulated significantly in cancer by at least two‐fold. Based on gene ontology analysis, the largest part of differential proteins were unknown for both subcellular localization and biological process. In particular, the significant up‐regulation of transgelin‐2 (TAGLN2) in CRC was validated by Western blot analysis and further evaluated by immunohistochemistry in paired tumor and normal mucosa samples from 120 consecutive CRC patients, 20 adenomas, and eight synchronous hepatic metastases of CRC. TAGLN2 expression was frequently observed in cancer cells, precancerous lesions, and hepatic metastases, whereas in normal epithelia expression was rarely observed. The overexpression of TAGLN2 was associated with lymph node and distant metastasis, advanced clinical stage (P < 0.001), and shorter overall survival in CRCs. Cox regression analysis indicated that high tumor‐TAGLN2 expression represents an independent prognostic factor. Consequently, over‐expression of TAGLN2 may serve as a new biomarker for predicting progression and prognosis of CRC. (Cancer Sci 2009)
Colorectal cancer (CRC) is one of the most frequent malignancies and is listed as the third leading cause of cancer‐related deaths worldwide. Treatments for CRC have made significant progress in recent years. However, most patients are diagnosed after the invasive cancer appears, which therefore restricts further attempts to improve the survival rate.( 1 ) Consequently, the search for candidate biomarkers for early detection and prognostication of CRC is urgently required to guide early treatment and improve the prognosis of patients.
As an overall and high‐throughout protein analysis strategy, proteomics provides opportunities for the discovery of new biomarkers for the diagnosis of diseases.( 2 ) In recent years, proteomic technology has been applied in the analysis of CRC( 3 , 4 , 5 ) and has identified a number of differentially expressed proteins. However, very few of these results have been confirmed in the clinical setting and none of the identified potential marker proteins have been widely used for diagnosis or treatment of CRC in the clinic. Gel‐based approaches such as two‐dimensional electrophoresis (2‐DE) and two‐dimensional differential in‐gel electrophoresis (2D‐DIGE) are conventionally used for comparative proteomics in the field of cancer research. However, there are a number of technical difficulties associated with 2‐DE protein separation that limits its applicability only to abundant and soluble proteins.( 6 ) Recently, there has been increasing interest in applying mass spectrometry (MS)‐based quantitative methods to proteomic efforts. Such approaches complement protein identification via gel‐based proteomic strategies. MS methods also enable the identification of new diagnostic and early detection markers.( 7 ) Among the methods, acetylation stable isotopic labeling by D0/D6‐acetic anhydride coupled with LTQ‐FT MS has proven to be a valuable and reliable differential proteome analysis strategy.( 8 )
Tumor tissues obtained from operations represent ideal material for biomarker searching by proteomic analysis. However, tissue heterogeneity complicates the identification of tumor markers and the results obtained through proteomic analysis of whole tissue may be considered controversial.( 9 ) Laser capture microdissection (LCM) can overcome the heterogeneity problem by isolating individual tumor cells and represents an attractive application prospect in a proteomic study.( 10 ) However, the process involved in harvesting adequate cells for analysis is laborious and time‐consuming, and the small number of cells procured by LCM severely limits the required proteome coverage and biomarker discovery potential that is achievable using conventional proteomics platforms.
In this study, LCM purified cells from CRC tissue and adjacent normal mucosa were analyzed using D0/D3 acetylation labeling combined with high‐performance LTQ‐FT MS. LTQ‐FT MS possesses the obvious advantages of both allowing small amounts of samples to be analyzed and providing high proteome coverage for complex biological samples.( 11 ) Using a pooling strategy, we found a total of 137 differentially expressed proteins between CRC and normal mucosa. Among the identified proteins, transgelin‐2 (TAGLN2) was significantly up‐regulated in CRC compared with normal mucosa. This observation was confirmed by Western blot and immunohistochemistry (IHC) analysis. The clinicopathological and prognostic significances of TAGLN2 expression in CRC were also evaluated.
Materials and Methods
Tissue specimens.
For comparative proteomic analysis, surgically resected tissues from 20 patients with CRC and their adjacent mucosa were collected. Each sample was divided into two parts. One part was immediately snap frozen in liquid nitrogen and then stored at −80°C for LCM. The other part was fixed in a 10% formaldehyde solution for H&E staining and IHC. For further validation, clinicopathological and prognostic evaluation, a set of tissue microarray was constructed as previously described.( 12 ) This included paired tumor and normal mucosa samples of 120 consecutive CRC patients, 20 adenomas, and eight synchronous hepatic metastases of CRC. All samples were taken from the Peking University People’s Hospital (PUPH). Clinical and pathologic data of the samples are shown in Tables S1–S3. This study was approved by the Ethics Committee of PUPH and the informed consent of all participating subjects was obtained.
Laser capture microdissection (LCM) and protein extraction.
Fresh tissues were serially cut into 10‐μm frozen sections, one of which was H&E‐stained to check the pathological status and to locate the desired cells (Fig. S1). LCM was performed with a laser microdissection and pressure catapulting microscope (LMPC; Palm, Bernried, Germany). Between 3000–5000 cells were obtained per sample with a maximum time requirement of 20–30 min. Equal numbers of microdissected cells of each sample from different pathological conditions that were either CRC or matched normal mucosa were pooled. The pooled cells were dissolved in a lysis buffer containing 7 m urea, 2 m thiourea, 100 mm DTT, 4% CHAPS, and 1 × protease inhibitor cocktail (Roche, Penzberg, Germany) at 4°C for 1 h. After sonicating on ice for 15 s using an ultrasonic processor, the samples were spun at 20 000g for 30 min at 4°C to remove particulate materials. Protein concentrations were measured in duplicate using the Bradford method.
Protein separation and in‐gel digestion.
Equal amounts of protein (20 μg) from normal mucosa epithelia and CRC cells were separated on the same 12% SDS‐PAGE and stained with Coomassie brilliant blue. Each gel lane was cut into 10 sections for in‐gel tryptic digestion. The excised gel strips were sliced into about 1‐mm3 particles, destained with 50% ACN/25 mm ammonium bicarbonate solution, reduced with 10 mm DTT at 56°C, and alkylated in the dark with 50 mm iodoacetamide at room temperature for 1 h. Then the gel pieces were destained again, lyophilized, rehydrated with trypsin solution (0.01 μg/μL trypsin in 25 mm ammonium bicarbonate) on ice for 20 min, and then digested in the microwave oven at 750 W for 8 min, followed by incubation overnight at 37°C. The supernatants were collected and the tryptic peptides were extracted from the gel sequentially with 5% TFA in the microwave oven at 750 W for 8 min, and with 2.5% TFA, 50% ACN in the microwave oven at 750 W for 8 min. The extracted solutions were blended, lyophilized, and used for further stable isotopic labeling.
Acetylation stable isotopic labeling.
Peptides from the normal mucosa sample were tagged with D0‐acetic anhydride (Bejing Chemical Company, Beijing, China), whereas the CRC sample was labeled with D6‐acetic anhydride (Sigma‐Aldrich, St. Louis, MO, USA). The labeling was performed according to Everley( 13 ) and Nuan et al. ( 14 ) Briefly, 100 μL of 1 m O‐methylisourea (dissolved in 0.5 m carbonate buffer and adjusted to pH 11 with 1 m NaOH) was added to the peptides derived from the gel digestion and incubated at 37°C for 2 h. The solutions were then adjusted to pH 8.0 with 1 m HCl in preparation for the acetylation reaction. Two hundred μL of borate buffer was added to the solution to stabilize the pH. D0‐acetic and D6‐acetic anhydrides were diluted to 1 m with tetrahydrofuran. One μL of diluted acetic anhydride was added to the solution. The acetylation reaction was performed at room temperature for 1 h. N‐hydroxylamine was then added to hydrolyze the esters formed during the acetylation reaction and incubation continued for a further 30 min (pH 11.0). Subsequently, light‐labeled (D0‐) peptides were mixed with the corresponding heavy‐labeled (D3‐) peptides, desalted using a solid phase extraction column (Sigma), lyophilized, and stored at −80°C.
Analysis of labeled samples using LTQ‐FT MS.
See the Supplementary Information.
Protein identification and quantification.
The LTQ‐FT MS data were searched against the IPI human 3.23 using local MASCOT (version 1.9) with a 95% confidence level. The parameters were as follows: the N‐terminal fixed modification was the D0‐acetylation (+42.0106 Da, the peptide was labeled with the light chain reagent) or the D3‐acetylation (+45.0294 Da, the peptide was labeled with the heavy chain reagent); full tryptic cleavage was selected and the maximal allowable mis‐cleavage hits were set to two; mass tolerance for peptides and fragment ions was 15 ppm and 0.6 Da respectively. Based on the MASCOT results, the ratios of the monoisotopic peaks between the light‐labeled peptides and heavy‐labeled peptides were automatically calculated using an in‐house program and the protein ratios were calculated from the average of all quantified peptides. Gene Ontology (GO) (http://www.geneontology.org) was used to classify the differentially expressed proteins identified (ratios were ≥2.0 or ≤0.5).
Western blot analysis.
The expression levels of three dysregulated proteins in the microdissected samples for acetylation labeling were examined to confirm the results of the proteomic approach used in the present study. TAGLN2 was further validated in the whole lysates of paired CRC and the adjacent normal mucosa individually. Primary antibodies of TAGLN2 (mouse monoclonal; 1:1000 dilution) and ras‐related protein Rab‐10 (RAB10) (rabbit polyclonal; 1:1000 dilution) were purchased from Proteintech (Chicago, IL, USA). Solute carrier family 12 member 2 (SLC12A2) (chicken polyclonal; 1:1000 dilution) was purchased from GenWay Biotech (San Diego, CA, USA). β‐Actin (mouse monoclonal; 1:1000 dilution; Santa Cruz Biotechnology, CA, USA) was used simultaneously as a loading control. Western blot analysis was performed as described previously (Supplementary Information).( 15 )
IHC.
Four‐μm tissue sections were cut and deparaffinized in xylene, rehydrated in a graded ethanol series, and treated with an antigen retrieval solution (6.5 mm sodium citrate buffer, pH 6.0). The sections were incubated with mouse monoclonal anti‐TAGLN2 (dilution 1:200) overnight at 4°C and the staining of the target protein was visualized using a DAKO Envision System (Dako Diagnostics, Zug, Switzerland). Immunostaining was evaluated according to a scoring method as described previously.( 16 ) Each case was scored according to the intensity and area of staining. The intensity of staining was graded on the following scale: 0, no staining; 1+, mild staining; 2+, moderate staining; 3+, intense staining. The area of staining was evaluated as follows: 0, no staining of cells in any microscopic fields; 1+, <30% of cells stained positive; 2+, 30–60% stained positive; 3+, >60% stained positive. A combined staining score (intensity + extension) of ≤2 was low expression, a score between 3 and 4 was moderate expression, whereas a score between 5 and 6 was high expression.
Statistical analysis.
All statistical analyses were performed with SPSS version 13.0 software (SPSS, Chicago, IL, USA). The t‐test was used to assess the differences of TAGLN2 expression between tumor and normal mucosa. The χ2‐test was used to evaluate the relationships between TAGLN2 expression and clinicopathological factors. Overall survival curves were obtained by the Kaplan–Meier method and the statistical significance of the differences was evaluated using a log‐rank test. Cox regression analysis was used to evaluate the prognostic significance of clinicopathological factors. Differences with P‐values <0.05 were considered to be statistically significant.
Results
Protein identification and quantification.
In this study, 798 proteins were identified and quantified. The quantification of each identified protein was presented as a protein ratio between tumor and normal mucosa. The protein ratios ranged from 0.08 to 9.95 with an average ratio of 1.17, indicating that the majority of the protein expression levels were equivalent in the cancer and normal mucosa cells (Fig. S2). A total of 137 proteins showed at least a two‐fold difference in the level of expression in the CRC cells. Here, 67 proteins were overexpressed (ratios were ≥2.0), whereas 70 proteins were expressed at lower levels (ratios were ≤0.5) in the CRC cells (Table S4).
Analysis of differentially expressed proteins.
For the 137 differentially expressed proteins, 93 proteins were annotated by GO for component and biological processes, whereas the remaining fraction (44/137) were unknown proteins without GO annotation. The differentially expressed proteins were grouped into most categories of subcellular localization. The cytosol, plasma membrane, nucleus, and mitochondrion were the main cellular organelles that these proteins were identified to be located in (Fig. S3a). This observation indicates the importance of searching for tumor markers at the subcellular level. As for the functional distribution, the differentially expressed proteins covered a variety of biological processes with signal transduction‐related proteins and transporter proteins representing two major groups (Fig. S3b).
Confirmation of the quantification by D0/D3 acetylation analysis.
To confirm the quantitative results measured by the D0/D3 acetylation analysis, three proteins which showed significant differential expression were selected for validation using Western blot analysis. The expression of TAGLN2 was found to be four‐fold higher in the tumor than the normal mucosa according to the acetylation stable isotopic labeling method coupled with the LTQ‐FT MS (Fig. 1a). The results were consistent with the Western blot result, and similar correlations were observed for the proteins RAB10 and SLC12A2 (Fig. 1b). The most significant difference in expression levels was observed for TAGLN2 through validation in the 20 paired CRC samples by Western blot analysis (Fig. 2).
Figure 1.
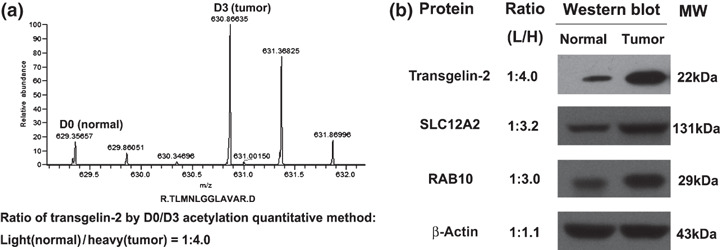
Quantification and validation of protein over‐expression in pooled colorectal cancer (CRC) samples. (a) The expression level of transgelin‐2 (TAGLN2) was quantified to be four‐fold higher by calculating the areas under the monoisotopic peaks of the heavy isotopic (D3) versus light isotopic (D0) peptides. (b) Western blot analysis confirmed the over‐expression of TAGLN2 in tumor samples. The results of the Western blot for solute carrier family 12 member 2 (SLC12A2) and ras‐related protein Rab‐10 (RAB10) were also consistent with the D0/D3 acetylation analysis.
Figure 2.
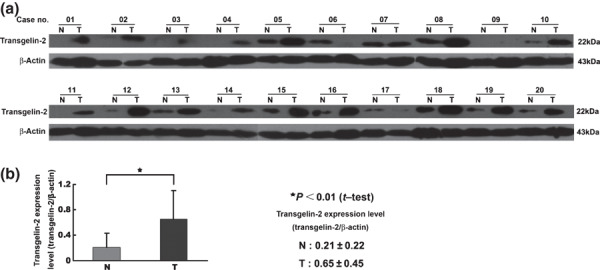
Expression of transgelin‐2 (TAGLN2) in 20 paired samples of colorectal cancer (CRC) (T) and normal mucosa (N). The intensity of each band was measured using the ImageQuant image analysis system and normalized against the signal from β‐actin. (a) The expression of TAGLN2 was significantly up‐regulated in tumor tissues compared with normal mucosa. (b) The difference of TAGLN2 expression between (T) and (N) was evaluated using the Satterthwaite’s approximate t‐test.
Characterization of TAGLN2 by IHC.
The differential expression of TAGLN2 was also validated by IHC to show the cellular origin and distribution. TAGLN2 staining was negative or weak in normal mucosa epithelia, but stronger in CRC cells, adenomas, and hepatic metastasis (Fig. 3). The expression of TAGLN2 was also found in some microvessel walls in the stroma. Results from the tissue microarray IHC showed that the positive staining rate of TAGLN2 was 85% in CRC, 16.67% in normal mucosa, 50% in adenomas, and 75% in hepatic metastasis. The results of IHC are shown in Tables S5, S6.
Figure 3.
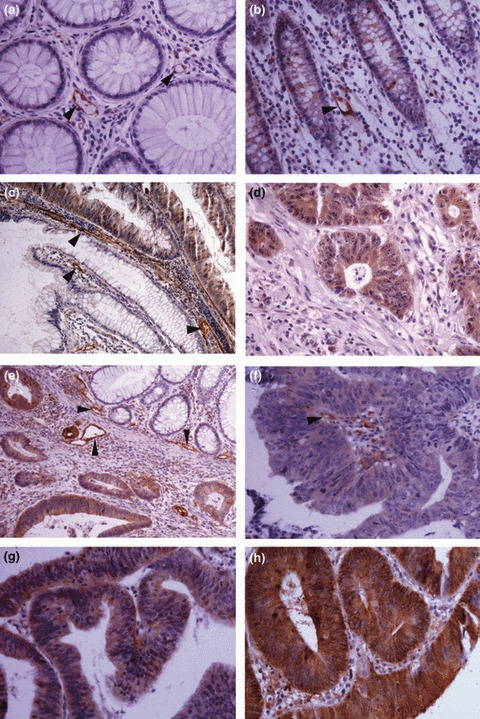
Immunohistochemical staining of transgelin‐2 (TAGLN2) in tissue specimens. (a,b) Negative staining or weak staining in normal mucosa epithelia; (c) positively stained villous adenoma and abutting negative normal mucosa epithelia; (d) positive staining in hepatic metastasis of colorectal cancer (CRC); (e) positively stained CRC tumor cells and abutting negative normal mucosa epithelia; (f,g,h) positive staining in tumor cells: weak (f), moderate (g), and strong staining (h). Some microvessel walls in the stroma also stained positive for TAGLN2 (a, b, d, arrowheads). Magnification, ×200 (a,b,d,f,g,h); ×100 (c,e).
Clinical significance of TAGLN2 expression in CRCs.
The relationships between the expression of TAGLN2 in colorectal cancer with clinicopathological factors and prognosis were evaluated. Increased levels of TAGLN2 expression was found to be significantly correlated with lymph node metastasis, distant metastasis, and the late TNM stage. In contrast, no significant correlations were found between TAGLN2 expression and other characteristics, including gender, age, tumor size, histological grade, and tumor status (Table 1). More interestingly, there was a significant correlation between TAGLN2 expression levels and postoperative survival. The mean survival rates of low‐, moderate‐, and high‐expression levels of TAGLN2 in patients were 49.8 ± 13.6, 31.6 ± 19, and 11.4 ± 11 months, respectively. The survival curves showed that the overall survival rate decreased significantly with increasing TAGLN2 expression (Fig. 4). In a univariate analysis, a decrease in survival was correlated with poor differentiation, lymph node metastasis, distant metastasis, advanced clinical stage, and an increase in TAGLN2 expression (Table 2). In a multivariate analysis, lymph node metastasis, distant metastasis, and an increase in TAGLN2 expression remained as significant independent prognostic factors for identifying a decrease in the overall survival rate (Table 2).
Table 1.
Relationships between TAGLN2 expression and clinicopathological factors in CRC
| Characteristics | n | TAGLN2 expression (score) | P‐values | ||
|---|---|---|---|---|---|
| Low (0–2) | Moderate (3–4) | High (5–6) | |||
| Age at presentation | |||||
| >65 years | 63 | 23 | 20 | 20 | 0.297 |
| ≤65 years | 57 | 25 | 11 | 21 | |
| Sex | |||||
| Male | 74 | 28 | 21 | 25 | 0.698 |
| Female | 46 | 20 | 10 | 16 | |
| Site of tumor | |||||
| Colon | 75 | 34 | 18 | 23 | 0.301 |
| Rectum | 45 | 14 | 13 | 18 | |
| Size of tumor | |||||
| >5 cm | 35 | 14 | 8 | 13 | 0.862 |
| ≤5 cm | 85 | 34 | 23 | 28 | |
| Histologic grade† | |||||
| Well + Mod | 99 | 43 | 28 | 28 | 0.067 |
| Poor | 21 | 5 | 3 | 13 | |
| Tumor status | |||||
| T1 + T2 | 19 | 11 | 6 | 2 | 0.055 |
| T3 + T4 | 101 | 37 | 25 | 39 | |
| LN metastasis | |||||
| N0 | 57 | 45 | 6 | 6 | 0.000* |
| N1 + N2 | 63 | 3 | 25 | 35 | |
| Distant metastasis | |||||
| M0 | 98 | 47 | 28 | 23 | 0.000* |
| M1 | 22 | 1 | 3 | 18 | |
| TNM stage | |||||
| I + II | 54 | 44 | 5 | 5 | 0.000* |
| III + IV | 66 | 4 | 26 | 36 | |
*P < 0.05 by χ2‐test. †Histologic grade: well, well differentiated; mod, moderately differentiated; poor, poorly differentiated. CRC, colorectal carcinoma; LN, lymph node; TAGLN2, transgelin‐2.
Figure 4.
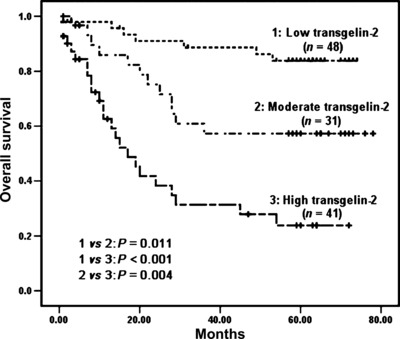
Kaplan–Meier survival curves for colorectal cancer (CRC) patients according to the expression levels of transgelin‐2 (TAGLN2). The P‐value was determined using log‐rank testing.
Table 2.
Significant prognostic factors by univariate and multivariate analysis (Cox’s proportional hazards model)
| Variable | Hazard ratio (95% CI) | P‐values |
|---|---|---|
| Univariate analysis | ||
| Histologic grade (Well/Mod/Poor) | 2.386 (1.283–4.438) | 0.006 |
| LN metastasis (N0/N1 + N2) | 5.300 (2.527–11.113) | 0.000 |
| Distant metastasis (M0/M1) | 13.303 (6.909–25.625) | 0.000 |
| TNM stage (I + II/III + IV) | 3.685 (2.068–6.568) | 0.000 |
| TAGLN2 expression (Low/Moderate/High) | 2.866 (1.921–4.275) | 0.000 |
| Multivariate analysis | ||
| LN metastasis | 2.794 (1.246–6.263) | 0.012 |
| Distant metastasis | 8.318 (4.119–16.798) | 0.000 |
| TAGLN2 expression | 1.639 (1.018–2.638) | 0.042 |
CI, confidence interval; LN, lymph node; TAGLN2, transgelin‐2.
Discussion
In this study, LCM and D0/D3 acetylation isotopic labeling combined with LTQ‐FT MS was used to compare the protein expression profiles between CRC and paired normal mucosa. We identified and quantified a total of 798 proteins including 137 that were differentially expressed by at least two‐fold between the two sample groups studied. The different expression levels of the 137 proteins were found to cover a wide range of subcellular localizations and biological processes. This illustrates the advantage of our strategy in tumor biomarker identification with an improvement in proteome coverage.
Among the differentially expressed proteins, many up‐regulated proteins in CRC such as macrophage migration inhibitory factor (MIF),( 17 ) heat shock protein 10 (HSP10),( 18 ) Mortalin,( 19 ) annexin A4,( 20 ) and S100A6( 21 ) have also been identified by other proteomic research efforts. These proteins represent potential markers of CRC. In addition, some down‐regulated proteins identified in this study have also been observed in previous studies on CRC, including selenium binding protein 1 (SELENBP1),( 22 ) alpha 1 antitrypsin (SERPIN1),( 23 ) and carbonic anhydrase I and II (CA1 and 2)( 3 ). Moreover, the down‐regulation of SELENBP1 has been proposed as a late event in colorectal carcinogenesis and may contribute to the rapid progression of CRC.
Besides finding agreement with the differential expression levels of particular proteins reported previously in CRC, a number of new findings were identified. In this study, a large number of up‐regulated differentially expressed proteins in CRC were related to signal transduction processes. The expression of RAB10 in CRC was three‐fold higher when compared with the levels in normal mucosa. As a member of the RAS oncogene family, RAB10 has also been observed to be up‐regulated in hepatocellular carcinoma (HCC).( 24 ) This result further implies the importance of the RAS pathway in CRC carcinogenesis. 14‐3‐3 proteins are a ubiquitous family of biomolecules that participate in positive regulation of the MAPK and the PI3K/AKT pathways. Both key growth promoting pathways are associated with the ability of cancer cells to proliferate in an uncontrolled manner.( 25 ) Of particular interest, elevated expression of four 14‐3‐3 protein isoforms (beta, gamma, eta, theta) were observed in our study, suggesting that 14‐3‐3 proteins may have important roles in CRC. Another major finding was that the ion transporters such as chloride intracellular channel protein 1 (CLIC1), SLC12A2, and voltage‐dependent anion‐selective channel proteins 1 and 3 (VDAC1 and VADC3) were all up‐regulated in CRC cells. CLIC1 over‐expression modulates cell division and apoptosis, resulting in cellular transformation.( 26 ) The over‐expression of SLC12A2 promotes cell proliferation and correlates with poor differentiation and metastasis of tumor cells.( 15 , 27 ) VDACs are essential for mitochondrial‐dependent apoptosis and are found to express at higher levels in cancer cells.( 28 ) The findings herein suggest that the disorder of ion transport may be an important factor in CRC carcinogenesis or progression.
Based on the GO analysis, a large number of the differentially expressed proteins were unknown, which may provide new resources for future development of tumor markers. TAGLN2 was significantly up‐regulated (four‐fold) in CRC and represents a potential biomarker that has previously not been identified. TAGLN2 contains a conserved actin‐binding domain also known as the calponin homolog (CH) domain. This indicates that TAGLN2 may be involved in cytoskeletal organization.( 29 ) Although the function of TAGLN2 is unknown, there have been a number of reports concerning the relationship between TAGLN2 expression and cancer. Huang et al. reported that TAGLN2 exhibited both an increase in genomic DNA copy numbers and the up‐regulation of transcripts in HCC.( 30 ) Chen et al. observed a significant increase in TAGLN2 expression in pancreatic cancer cells.( 12 ) In addition, transgelin, a homolog of TAGLN2, has been reported to be up‐regulated in some solid tumors including esophageal squamous cell carcinoma,( 31 ) gastric cancer,( 32 ) and colon cancer.( 33 ) As such, studies have implied that TAGLN2 may represent a potential tumor biomarker of CRC. Importantly, TAGLN2 was strongly expressed in CRC cells when compared with normal mucosa epithelia. As a precancerous disease, colorectal villous adenoma also exhibited higher expression levels of TAGLN2 (50%), suggesting that TAGLN2 may contribute to the carcinogenesis of CRC. Higher levels of TAGLN2 expression were found to be associated with lymph node metastasis, distant metastasis, advanced clinical stage, and poor survival in CRC. This indicates that TAGLN2 may represent a new biomarker for predicting progression and prognosis of CRC. The significant association of TAGLN2 levels with CRC clearly requires further investigation.
In conclusion, the strategy combining LCM, D0/D3 labeling analysis, and LTQ‐FT MS was employed to profile proteomic changes in CRC cells. Many previously reported potential CRC‐marker proteins were identified and this result supports the strategy employed here for searching for novel biomarkers. More importantly, this study identified a number of novel differentially expressed proteins in CRC compared with normal mucosa. In particular, the expression levels of the protein TAGLN2 differed significantly between the normal and CRC tissues. TAGLN2 was further evaluated in a large number of patients and was found to represent a potential biomarker in the clinical setting for predicting the progression and the prognosis of CRC.
Disclosure Statement
None of the authors of this study have a conflict of interest.
Supporting information
Fig. S1. Laser capture microdissection (LCM)of normal mucosa (a, c, e) and colorectal cancer (CRC) (b, d, f). (a,d) 10‐μm frozen sections stained with hematoxylin–eosin (H&E); (b,e) 10‐μm unstained frozen sections before LCM; (c,f) 10‐μm unstained frozen sections after LCM. Magnification, ×200.
Fig. S2. Quantification. The ratio distribution of all quantified proteins. The y‐axis represents the number of the proteins. The x‐axis is the ratio of protein quantity in the colorectal carcinoma (CRC) to normal mucosa using a log2 scale. The ratios of most proteins are distributed around 1.0 (log2 (ratio) = 0), indicating that whole cell proteins of CRC and normal mucosa cells were mixed equally and labeled fully.
Fig. S3. Cellular categorization of differentially expressed proteins based on the annotations of Gene Ontology (GO). (a) Subcellular localization of the various proteins. (b) Functional distribution of the various proteins.
Table S1. Clinical and pathological data of the 20 colorectal carcinoma (CRC) patients used in the laser capture microdissection (LCM).
Table S2. Clinical and pathological data of the 20 adenomas used in the tissue microarray.
Table S3. Clinical and pathological data of the 120 colorectal carcinoma (CRC) patients used in the tissue microarray.
Table S4. Significantly differential proteins identified.
Table S5. The IHC results of the tissue microarray analysis for transgelin‐2 (TAGLN2).
Table S6. The IHC results for transgelin‐2 (TAGLN2) in 20 colorectal carcinoma (CRC) patients for comparative proteomic analysis and eight hepatic metastases of CRC.
Please note: Wiley‐Blackwell are not responsible for the content or functionality of any supporting materials supplied by the authors. Any queries (other than missing material) should be directed to the corresponding author for the article.
Supporting info item
Supporting info item
Supporting info item
Supporting info item
Supporting info item
Supporting info item
Supporting info item
Supporting info item
Supporting info item
Acknowledgments
We thank Professor Xiaohong Qian (Beijing Proteome Research Center, Beijing, China) for technical assistance. This work was supported by the Capital Medical Development Foundation (2005–2010) of the Beijing Municipal Health Bureau, P.R. China.
References
- 1. Wolpin BM, Meyerhardt JA, Mamon HJ, Mayer RJ. Adjuvant treatment of colorectal cancer. CA Cancer J Clin 2007; 57: 168–85. [DOI] [PubMed] [Google Scholar]
- 2. Hanash S. Disease proteomics. Nature 2003; 422: 226–32. [DOI] [PubMed] [Google Scholar]
- 3. Alfonso P, Núñez A, Madoz‐Gurpide J et al. Proteomic expression analysis of colorectal cancer by two‐dimensional differential gel electrophoresis. Proteomics 2005; 5: 2602–11. [DOI] [PubMed] [Google Scholar]
- 4. Pei H, Zhu H, Zeng S et al. Proteome analysis and tissue microarray for profiling protein markers associated with lymph node metastasis in colorectal cancer. J Proteome Res 2007; 6: 2495–501. [DOI] [PubMed] [Google Scholar]
- 5. Loeffler‐Ragg J, Skvortsov S, Sarg B et al. Gefitinib‐responsive EGFR‐positive colorectal cancers have different proteome profiles from non‐responsive cell lines. Eur J Cancer 2005; 41: 2338–46. [DOI] [PubMed] [Google Scholar]
- 6. Uitto PM, Lance BK, Wood GR, Sherman J, Baker MS, Molloy MP. Comparing SILAC and two‐dimensional gel electrophoresis image analysis for profiling urokinase plasminogen activator signaling in ovarian cancer cells. J Proteome Res 2007; 6: 2105–12. [DOI] [PubMed] [Google Scholar]
- 7. Zhiyuan H, Leroy H, Qiang T. Quantitative proteomic approaches for biomarker discovery. Proteomics Clin Appl 2007; 1: 1036–41. [DOI] [PubMed] [Google Scholar]
- 8. Fang Q, Strand A, Law W et al. Brain‐specific proteins decline in the cerebrospinal fluid of humans with Huntington’s disease. Mol Cell Proteomics 2009; 8: 451–66. [DOI] [PMC free article] [PubMed] [Google Scholar]
- 9. Li N, Zhang J, Liang Y et al. A controversial tumor marker: is SM22 a proper biomarker for gastric cancer cells? J Proteome Res 2007; 6: 3304–12. [DOI] [PubMed] [Google Scholar]
- 10. Cheng AL, Huang WG, Chen ZC et al. Identificating cathepsin D as a biomarker for differentiation and prognosis of nasopharyngeal carcinoma by laser capture microdissection and proteomic analysis. J Proteome Res 2008; 7: 2415–26. [DOI] [PubMed] [Google Scholar]
- 11. Umar A, Luider TM, Foekens JA, Pasa‐Tolić L. NanoLC‐FT‐ICR MS improves proteome coverage attainable for approximately 3000 laser‐microdissected breast carcinoma cells. Proteomics 2007; 7: 323–9. [DOI] [PubMed] [Google Scholar]
- 12. Chen R, Yi EC, Donohoe S et al. Pancreatic cancer proteome: the proteins that underlie invasion, metastasis, and immunologic escape. Gastroenterology 2005; 129: 1187–97. [DOI] [PubMed] [Google Scholar]
- 13. Everley PA, Bakalarski CE, Elias JE et al. Enhanced analysis of metastatic prostate cancer using stable isotopes and high mass accuracy instrumentation. J Proteome Res 2006; 5: 1224–31. [DOI] [PubMed] [Google Scholar]
- 14. Nuan J, Liu X, Jun W et al. A proteomic method for analysis of CYP450s protein expression changes in carbon tetrachloride induced male rat liver microsomes. Toxicology 2007; 237: 1–11. [DOI] [PubMed] [Google Scholar]
- 15. Chen N, Sun W, Deng X et al. Quantitative proteome analysis of HCC cell lines with different metastatic potentials by SILAC. Proteomics 2008; 8: 5108–18. [DOI] [PubMed] [Google Scholar]
- 16. Liu YF, Xiao ZQ, Li MX et al. Quantitative proteome analysis reveals annexin A3 as a novel biomarker in lung adenocarcinoma. J Pathol 2009; 217: 54–64. [DOI] [PubMed] [Google Scholar]
- 17. Wilson JM, Coletta PL, Cuthbert RJ et al. Macrophage migration inhibitory factor promotes intestinal tumorigenesis. Gastroenterology 2005; 129: 1485–503. [DOI] [PubMed] [Google Scholar]
- 18. Melle C, Bogumil R, Ernst G, Schimmel B, Bleul A, Von Eggeling F. Detection and identification of heat shock protein 10 as a biomarker in colorectal cancer by protein profiling. Proteomics 2006; 6: 2600–8. [DOI] [PubMed] [Google Scholar]
- 19. Dundas SR, Lawrie LC, Rooney PH, Murray GI. Mortalin is over‐expressed by colorectal adenocarcinomas and correlates with poor survival. J Pathol 2005; 205: 74–81. [DOI] [PubMed] [Google Scholar]
- 20. Duncan R, Carpenter B, Main LC, Telfer C, Murray GI. Characterisation and protein expression profiling of annexins in colorectal cancer. Br J Cancer 2008; 98: 426–33. [DOI] [PMC free article] [PubMed] [Google Scholar]
- 21. Stulík J, Osterreicher J, Koupilová K et al. Differential expression of the Ca2+ binding S100A6 protein in normal, preneoplastic and neoplastic colon mucosa. Eur J Cancer 2000; 36: 1050–9. [DOI] [PubMed] [Google Scholar]
- 22. Li T, Yang W, Li M et al. Expression of selenium‐binding protein 1 characterizes intestinal cell maturation and predicts survival for patients with colorectal cancer. Mol Nutr Food Res 2008; 52: 1289–99. [DOI] [PubMed] [Google Scholar]
- 23. Bi X, Lin Q, Foo TW et al. Proteomic analysis of colorectal cancer reveals alterations in metabolic pathways: mechanism of tumorigenesis. Mol Cell Proteomics 2006; 5: 1119–30. [DOI] [PubMed] [Google Scholar]
- 24. He H, Dai F, Yu L, She X. Identification and characterization of nine novel human small GTPases showing variable expressions in liver cancer tissues. Gene Expr 2002; 10: 231–42. [DOI] [PMC free article] [PubMed] [Google Scholar]
- 25. Tzivion G, Gupta VS, Kaplun L, Balan V. 14‐3‐3 proteins as potential oncogenes. Semin Cancer Biol 2006; 16: 203–13. [DOI] [PubMed] [Google Scholar]
- 26. Huang JS, Chao CC, Su TL et al. Diverse cellular transformation capability of overexpressed genes in human hepatocellular carcinoma. Biochem Biophys Res Commun 2004; 315: 950–8. [DOI] [PubMed] [Google Scholar]
- 27. Panet R, Marcus M, Atlan H. Overexpression of the Na(1)/K(1)/Cl(‐) cotransporter gene induces cell proliferation and phenotypic transformation in mouse fibroblasts. J Cell Physiol 2000; 182: 109–18. [DOI] [PubMed] [Google Scholar]
- 28. Simamura E, Hirai K, Shimada H, Koyama J, Niwa Y, Shimizu S. Furanonaphthoquinones cause apoptosis of cancer cells by inducing the production of reactive oxygen species by the mitochondrial voltage‐dependent anion channel. Cancer Biol Ther 2006; 5: 1523–9. [DOI] [PubMed] [Google Scholar]
- 29. Marchler‐Bauer A, Anderson JB, Derbyshire MK et al. CDD: a conserved domain database for interactive domain family analysis. Nucleic Acids Res 2007; 35 (Database issue): D237–40. [DOI] [PMC free article] [PubMed] [Google Scholar]
- 30. Huang J, Sheng HH, Shen T et al. Correlation between genomic DNA copy number alterations and transcriptional expression in hepatitis B virus‐associated hepatocellular carcinoma. FEBS Lett 2006; 580: 3571–81. [DOI] [PubMed] [Google Scholar]
- 31. Qi Y, Chiu JF, Wang L, Kwong DL, He QY. Comparative proteomic analysis of esophageal squamous cell carcinoma. Proteomics 2005; 5: 2960–71. [DOI] [PubMed] [Google Scholar]
- 32. Huang Q, Huang Q, Chen W et al. Identification of transgelin as a potential novel biomarker for gastric adenocarcinoma based on proteomics technology. J Cancer Res Clin Oncol 2008; 134: 1219–27. [DOI] [PubMed] [Google Scholar]
- 33. Friedman DB, Hill S, Keller JW et al. Proteome analysis of human colon cancer by two‐dimensional difference gel electrophoresis and mass spectrometry. Proteomics 2004; 4: 793–811. [DOI] [PubMed] [Google Scholar]
Associated Data
This section collects any data citations, data availability statements, or supplementary materials included in this article.
Supplementary Materials
Fig. S1. Laser capture microdissection (LCM)of normal mucosa (a, c, e) and colorectal cancer (CRC) (b, d, f). (a,d) 10‐μm frozen sections stained with hematoxylin–eosin (H&E); (b,e) 10‐μm unstained frozen sections before LCM; (c,f) 10‐μm unstained frozen sections after LCM. Magnification, ×200.
Fig. S2. Quantification. The ratio distribution of all quantified proteins. The y‐axis represents the number of the proteins. The x‐axis is the ratio of protein quantity in the colorectal carcinoma (CRC) to normal mucosa using a log2 scale. The ratios of most proteins are distributed around 1.0 (log2 (ratio) = 0), indicating that whole cell proteins of CRC and normal mucosa cells were mixed equally and labeled fully.
Fig. S3. Cellular categorization of differentially expressed proteins based on the annotations of Gene Ontology (GO). (a) Subcellular localization of the various proteins. (b) Functional distribution of the various proteins.
Table S1. Clinical and pathological data of the 20 colorectal carcinoma (CRC) patients used in the laser capture microdissection (LCM).
Table S2. Clinical and pathological data of the 20 adenomas used in the tissue microarray.
Table S3. Clinical and pathological data of the 120 colorectal carcinoma (CRC) patients used in the tissue microarray.
Table S4. Significantly differential proteins identified.
Table S5. The IHC results of the tissue microarray analysis for transgelin‐2 (TAGLN2).
Table S6. The IHC results for transgelin‐2 (TAGLN2) in 20 colorectal carcinoma (CRC) patients for comparative proteomic analysis and eight hepatic metastases of CRC.
Please note: Wiley‐Blackwell are not responsible for the content or functionality of any supporting materials supplied by the authors. Any queries (other than missing material) should be directed to the corresponding author for the article.
Supporting info item
Supporting info item
Supporting info item
Supporting info item
Supporting info item
Supporting info item
Supporting info item
Supporting info item
Supporting info item