

Abstract
Regulatory T cells (Tregs) are major immunosuppressors in tumor‐bearing hosts. Although Treg‐depletion therapy has been shown to induce a complete cure in tumor‐bearing mice, this treatment is not always successful. Using 3‐methylcholanthrene‐induced primary mouse tumors, we examined the distinct regulation of Treg‐mediated immunosuppression between carcinomas and sarcomas. We showed that the number of Tregs was greatly increased in squamous cell carcinoma (SCC)‐bearing mice compared with sarcoma‐bearing mice. This appeared to be because SCC produced higher levels of active transforming growth factor (TGF)‐β, which is essential for inducing Tregs, compared with sarcoma. Moreover, SCC, but not sarcomas, were refractory to Treg‐depletion therapy by treatment with anti‐CD25 mAb. The refractoriness of SCC against Treg‐depletion therapy was due to the rapid recovery of Tregs in SCC‐bearing mice compared with sarcoma‐bearing mice. However, combination treatment of anti‐TGF‐β mAb with anti‐CD25 mAb caused a significant reduction in Treg recovery and induced a complete cure in SCC‐bearing mice. Thus, we showed the refractoriness of mouse carcinoma against Treg‐depletion therapy using anti‐CD25 mAb treatment. We also proposed a novel Treg‐blocking combination therapy using anti‐CD25 mAb and anti‐TGF‐β mAb to induce a complete cure of tumor‐bearing hosts.
(Cancer Sci 2010; 101: 855–861)
The accumulative evidence indicates that it is important to consider two immunological aspects for developing an efficient tumor immunotherapy. First, immunological help, such as an efficient adjuvant provoking type 1 immunity, should be introduced into tumor bearers for inducing and maintaining tumor‐specific CTLs.( 1 ) Second, immunosupressions in tumor bearers should be removed to induce full activation of tumor‐specific CTLs.( 1 , 2 , 3 , 4 , 5 ) Several immunosuppressive mechanisms in tumor bearers have been evaluated in animal experiments.( 2 , 3 , 5 , 6 , 7 , 8 , 9 , 10 ) However, the mechanisms evaluated in mice were not always applicable to clinical study.( 11 , 12 ) The difficulties arose because: (i) many investigators used long‐term cultured mouse tumor cell lines, possessing distinct properties from primary tumors; and (ii) most primary mouse tumors used for experiments are 3‐methylcholanthrene (MCA)‐induced sarcoma, even though more than 98% of human cancer consists of carcinoma, because it has been difficult to establish MCA‐induced carcinomas. Therefore, it is necessary to use primary mouse carcinoma to define their immunosuppressive tumor escape mechanisms, which might provide some light for evaluating the mechanisms underlying human carcinoma‐induced immunosuppression.
In previous published work,( 13 ) we established a novel carcinogenesis model to induce both squamous cell carcinoma (SCC) and fibrosarcoma by a single intradermal (i.d.) injection of MCA. Using this method, we could easily and quickly obtain two different types of primary tumors, SCC and sarcoma. Thus, now, it becomes possible to investigate the distinct immunosuppressive mechanisms between primary‐induced carcinoma and sarcoma.
Regulatory T cell (Treg)‐mediated immunosupression is one of the major obstacles to curing tumors by immunotherapy.( 2 , 5 , 6 , 14 , 15 , 16 , 17 , 18 , 19 , 20 , 21 , 22 , 23 , 24 , 25 , 26 , 27 , 28 ) Many investigators have tried to attenuate Treg‐mediated immunosuppression by targeting therapy using Treg‐associated molecules such as CD25, CTLA‐4, GITR, transforming growth factor (TGF)‐β, FR4, OX40. and TLR8.( 14 , 15 , 16 , 17 , 18 , 19 , 20 , 21 , 22 , 23 , 24 , 25 , 26 ) Although Treg‐depletion therapy by injecting anti‐CD25 mAb is a major strategy to remove Treg‐mediated immunosupression, this method is not always successful in inducing tumor rejection.( 15 , 16 , 27 , 28 ) However, it remains poorly understood why some tumors were refractory to Treg‐depletion therapy and escaped from host antitumor defense mechanisms.
Here, we show that MCA‐induced primary carcinomas are refractory to Treg‐depletion therapy, whereas MCA‐induced primary sarcomas are sensitive to it. This is because Tregs are rapidly recovered in carcinoma‐bearing mice by active TGF‐β, which is produced at high levels by carcinoma compared with sarcoma. Based on these findings, we show that combination treatment of SCC‐bearing mice with anti‐CD25 mAb and anti‐TGF‐β mAb caused a complete cure of tumor‐bearing mice by blocking the rapid recovery of Tregs. Thus, our paper initially indicates that there is a distinct regulation of Treg‐mediated immunosuppressive tumor escape between carcinoma and sarcoma.
Materials and Methods
Mice and tumor cell line. BALB/c mice were obtained from Charles River Laboratories Japan (Yokohama, Japan). All mice were female and were used at 6–8 weeks of age. SCCs and fibrosarcomas were obtained as described in our previous paper.( 13 ) In brief, we injected 500 μg MCA i.d. When the tumor reached >100 mm3, we minced the tumor and seeded to a 10 cm dish. The cells were subcultured when they became confluent. We characterized cytokeratin‐positive CMC‐1 and CMC‐9 as SCC, and vimentic‐positive CMS‐G2 and CMS‐G4 as sarcoma by immunohistochemistry.( 13 ) We cultured SCCs and sarcomas in RPMI‐1640 medium (Sigma‐Aldrich, Tokyo, Japan) containing 10% FCS (Nichirei Bioscience, Tokyo, Japan) and used within 10 passages. Mink lung epithelial cell line Mv1Lu was donated by the Cell Resource Center for Biomedical Research, Institute of Development, Aging and Cancer (Tohoku University, Japan) and was cultured in Minimum Essential Medium Eagle medium (M4655; Sigma‐Aldrich) containing 10% FCS.
Reagents. Anti‐Foxp3 polyclonal Ab for immunochemical staining was kindly donated by Dr. K. Matsushima (Tokyo University, Tokyo, Japan).( 29 ) Anti‐Foxp3 mAb (150D/E4) used with anti‐Ki67 mAb, and anti‐Foxp3 mAb (FJK‐16S) used along anti‐CD4 mAb were purchased from eBioscience (San Diego, CA, USA). FITC‐CD4 mAb (GK1.5) was purchased from BD Biosciences (Fukushima, Japan). Anti‐Ki‐67 mAb (TEC‐3) was purchased from Dako Japan (Tokyo, Japan) and its control IgG mAb was purchased from BD Biosciences. Anti‐TGF‐β mAb (1D11), its control IgG mAb (13C4), and anti‐CD25 mAb (PC61) were purified by Kitayama Labes (Nagano, Japan), and the hybridomas were purchased from American Type Culture Collection (Manassas, VA, USA). Control IgG mAb of PC61 was purchased from BD Biosciences. Recombinant human (rh)TGF‐β1 was purchased from PeproTech (Rocky Hill, NJ, USA). Recombinant human interleukin (IL)‐2 was kindly donated by T. Yamada (Shionogi & Co., Osaka, Japan).
Immunochemical staining. Snap‐frozen lymph nodes embedded in Tissue‐Tek OTC Compound (Sakura Finetek, Tokyo, Japan) were cut at 5–7 μm, fixed for 10 min in cold acetone and used for immunohistochemical analysis. We used an already established double‐immunofluorescence staining protocol for Foxp3 and CD4.( 29 ) Briefly, the primary antibodies were diluted in 1% BSA (polyclonal rabbit Ab against murine Foxp3 at a concentration of 5 mg/mL and anti‐CD4 mAb [diluted 1:500]). The secondary Ab was applied at a 1:500 dilution (anti‐rat IgG‐Alexa 546, anti‐rabbit IgG‐Alexa 488; Alexa, Leiden, the Netherlands). The samples were then analyzed with an Olympus FV500 confocal laser scanning microscope system (Olympus Optical, Tokyo, Japan).
3[H]‐thymidine incorporation assay. Cell proliferation was evaluated as described previously.( 1 ) Briefly, 3[H]‐thymidine was added to culture medium for 4 h and the radioactivity incorporated in cells was measured as a representation of proliferation of the T cells.
Mv1Lu assay. We detected the levels of active TGF‐β in tumor supernatant (sup) by slightly modifying a method described in a previous paper.( 30 ) In short, Mv1Lu (5 × 10³) were scattered in a 96‐well flat plate (Nunc, Roskilde, Denmark) in 100 μL Minimum Essential Medium Eagle. We removed 50 μL supernatant 12 h later and added 50 μL diluted tumor supernatants. Then, 24 h later, Mv1Lu growth inhibition was evaluated in a 3[H]‐thymidine incorporation assay. We defined the inhibition rate (%) as an inhibition index of active TGF‐β. The inhibition rate was calculated as: Inhibition rate (%) = 100 × [count per minute (cpm) without sup – cpm with sup]/[cpm without sup], where cpm is count per minute. In preparing sup, tumor cells (2 × 10⁵) were scattered in a 12‐well plate (Corning, Tokyo, Japan) and changed the supernatant 12 h later to fresh medium of 1 mL. The supernatants were collected 24 h later and used after exerting SpinX (Corning).
Antibody staining and flow cytometry. For analyzing the cell growth of Treg cells, we targeted Ki‐67, which was expressed in dividing cells. Lymphocytes from the draining lymph node (DLN), distal LN, and spleen cells were treated with fixation/permeabilization buffer attached with a Foxp3 staining set (eBioscience). Two hours later, they were washed with permeabilizing solution buffer and stained with anti‐Ki67 mAb (50 μg/mL) for 20 min. Cells were washed with permeabilizing solution buffer and stained with anti‐rat IgG‐Alexa 488 for 20 min. Cells were washed again with permeabilizing solution buffer and stained with phycoerythrin‐conjugated anti‐Foxp3 mAb (150D/E4). FITC‐CD4/phycoerythrin‐Foxp3 staining was carried out according to the manufacturer’s instructions. Data were acquired on a Becton Dickinson FACSCalibur (Becton Dickinson, Franklin Lakes, NJ, USA). Data were analyzed using CellQuest software (Becton Dickinson).
Treg‐depletion therapy model. Anti‐CD25 mAb (50 μg/head; PC61) or control rat IgG was injected i.v. 24 h before tumor inoculation. Anti‐TGF‐β mAb (500 μg/head; 1D11) or control mouse IgG (13C4) was given i.p. simultaneously with tumor inoculation and another five times at 2‐day intervals. The tumor cells (2 × 10⁶ or 2 × 10⁵) were inoculated i.d. in the left flank. The axillary LNs were collected and analyzed as DLNs. Tumor volume was calculated by the following formula: tumor volume = 0.4 × length (mm) × [width (mm)]2.
Statistical analyses. Mean values and SD were calculated for data from representative experiments and are shown in the figures. Significant differences in the results were determined by Student’s t‐test. P < 0.05 was considered significant.
Results
Numbers of Foxp3+ CD4+ T cells increased in DLN, but neither distal LN nor spleen in MCA‐induced carcinoma‐bearing mice. We established a novel carcinogenesis model to induce both sarcoma and SCC by a single i.d. injection of MCA into BALB/c mice, as described in ‘Materials and Methods’.( 13 ) Using this simple and valuable method, we investigated the functional regulation of Tregs in SCC‐bearing hosts. We first analyzed the changes in absolute numbers of Foxp3+ CD4+ Tregs during tumor growth. The absolute numbers of Tregs in DLN, but neither spleen nor distal LN, gradually increased within 16 days after inoculation of the SCC cell line, CMC‐1 (Fig. 1A). We also confirmed a similar increase of Tregs in DLN, but not distal LN or spleen, by immunohistochemical analysis (Fig. 1B). In tumor tissue, Tregs were scattered in low density over the tumor area (Fig. S1).
Figure 1.
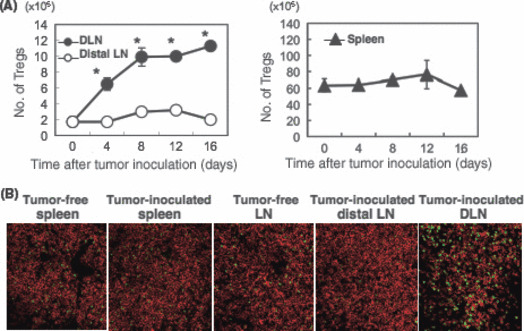
Regulatory T cells (Tregs) were increased in draining lymph node (DLN), but not distal LN or spleen, in squamous cell carcinoma (SCC)‐bearing host mice. (A) CMC‐1 (2 × 10⁶; representative SCC) was inoculated intradermally. The numbers of CD4 + Foxp3 + T cells in tumor‐side axillary DLN (filled circle), contralateral axillary LN (distal LN; open circle), and spleen (filled triangle) was analyzed 0, 4, 8, 12, and 16 days after CMC‐1 inoculation. The data shown are mean ± SD of three mice in each experimental group. *P < 0.05 DLN versus distal LN. Similar results were obtained in two separate experiments. (B) Tregs were detected in LN and spleen of normal mice, and DLN, distal LN, and spleen of tumor‐bearing mice by immunohistochemical analysis. Representative data are shown. Green, Foxp3; red, CD4. Magnification, ×200.
We further addressed whether Tregs existing in DLN, distal LN, and spleen had differing abilities to suppress T cell responses. Purified CD4 + CD25 + T cells from DLN, distal LN, and spleen were co‐cultured with naïve CD4 + T cells in the presence of anti‐CD3 mAb, and cell growth was measured. As shown in Figure S2, functional differences were not observed between the Tregs prepared from each organ.
Squamous cell carcinoma but not sarcoma induced a great increase of absolute numbers of Tregs in tumor DLN. We established several MCA‐induced primary sarcoma and carcinoma cell lines,( 13 ) and used them for experiments within 10 passages. To investigate the different regulation of Treg‐mediated immunosuppression between MCA‐induced sarcoma and SCC, we examined the increase of Tregs in DLN of mice bearing carcinoma or sarcoma. Two weeks after the inoculation of 2 × 10⁶ sarcoma cells (CMS‐G2 and CMS‐G4) or SCC (CMC‐1 and CMC‐9), the numbers of Tregs in DLN were counted immunohistochemically. Interestingly, mice bearing SCC, but not sarcoma, showed a great increase in the numbers of Tregs (Fig. 2). There was no significant difference in the tumor volume between SCC and sarcoma (data not shown). These results indicated that MCA‐induced primary SCC, but not sarcoma, promoted the expansion of Tregs in DLN.
Figure 2.
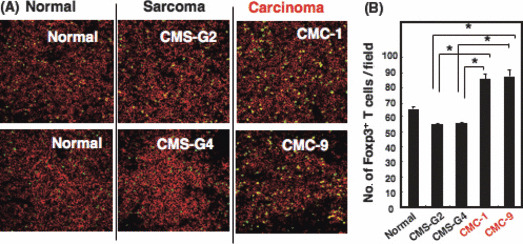
The number of regulatory T cells (Tregs) in draining lymph node (DLN) increases in 3‐methylcholanthrene (MCA)‐induced squamous cell carcinoma (SCC)‐bearing mice, but not in sarcoma‐bearing mice. (A) BALB/c mice were inoculated intradermally with primary sarcoma lines (CMS‐G2 and CMS‐G4; 2 × 10⁶) and primary SCC lines (CMC‐1 and CMC‐9; 2 × 10⁶). DLN of the tumor‐bearing mice were immunostained with anti‐CD4 mAb and anti‐Foxp3 mAb. Distributions of CD4 + Foxp3 + Tregs in the tumor DLN were evaluated by immunohistochemical observation. Green, Foxp3; red, CD4. Magnification, ×200. (B) The numbers of Foxp3 + Tregs of the sections were counted. The data shown are mean ± SD of five fields of each DLN. *P < 0.02 sarcoma versus SCC.
Superior induction of Tregs in SCC‐bearing mice by active TGF‐β, highly produced by SCC but not sarcoma. In previous work,( 20 , 21 ) it was shown that TGF‐β was essential for the induction of Foxp3 + Tregs in vitro, and we also confirmed it (data not shown). In addition to such Treg regulation activity in vitro, we showed that TGF‐β had Treg regulation activity in vivo (Fig. 3A,B). When BALB/c mice inoculated with CMC‐1 cells (2 × 10⁶) were treated with anti‐TGF‐β mAb (1D11) by i.p. injection four times at 2‐day intervals for 10 days, the numbers of Tregs in DLN of the tumor‐bearing mice significantly decreased compared with those of control IgG‐treated mice (Fig. 3A). Similar results were also obtained in immunohistochemical analysis (Fig. 3B). These results indicated that TGF‐β plays a pivotal role for the induction of Tregs in SCC‐bearing mice. Therefore, it was speculated that Treg accumulation in SCC‐bearing mice might be due to their ability to produce higher levels of active TGF‐β, compared with sarcoma‐bearing mice. To demonstrate our working hypothesis, the producibility of active TGF‐β from SCC and sarcoma was determined by Mv1Lu assay. Several kinds of primary SCC or sarcoma lines were cultured and TGF‐β activity in their culture supernatants was measured, as described in ‘Materials and Methods’. Interestingly, most SCC lines showed a higher ability to produce active TGF‐β than sarcoma lines (Fig. 3C). These results indicated that a higher ability to produce active TGF‐β in MCA‐induced carcinoma might explain why larger numbers of Tregs were increased in DLN of carcinoma‐bearing hosts compared with sarcoma‐bearers.
Figure 3.
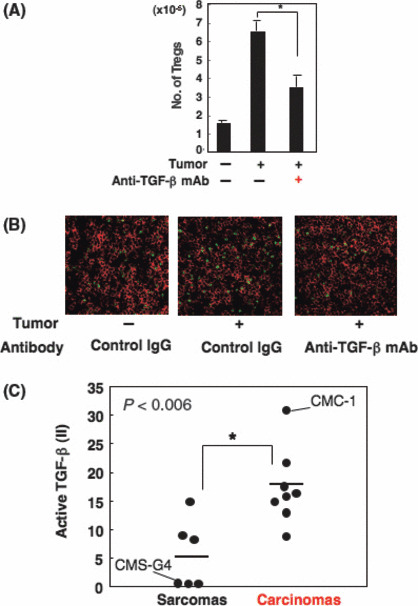
Squamous cell carcinomas (SCCs) predominantly induce regulatory T cells (Tregs) by their ability to produce high levels of active transforming growth factor (TGF)‐β. (A) CMC‐1 (SCC; 2 × 10⁶) was inoculated intradermally into BALB/c mice (day 0). Anti‐TGF‐β mAb (500 μg/mL) was i.p. injected at days 0, 3, 6, and 9. At day 10, we evaluated the number of Tregs by FACSCalibur. The number was calculated as follows: total cell number × rate of Tregs among total cells. The data shown are the mean ± SD of three mice. Similar results were obtained in three separate experiments. (B) Draining lymph nodes of mice treated with anti‐TGF‐β or control IgG mAb were immunostained with anti‐CD4 mAb and anti‐Foxp3 mAb 13 days after tumor inoculation. (C) TGF‐β activities in the culture supernatants of six kinds of sarcoma lines and eight kinds of SCC lines were determined by growth inhibition assay of Mv1Lu cells. We defined the inhibition rate (%) as an inhibition index (II) of active TGF‐β. Similar results were obtained in three separate experiments. *P < 0.006 between the two indicated groups.
Carcinoma induced by MCA more resistant to anti‐CD25 mAb treatment than sarcoma following a rapid recovery of Tregs. In order to assess the immunosuppressive effects of Tregs on antitumor immunity in vivo, we depleted Tregs by treatment with anti‐CD25 mAb before inoculation of several SCC lines or sarcoma lines at 2 × 10⁶ cells/mouse. Surprisingly, anti‐CD25 mAb showed no significant effect on the growth of SCCs, but it completely inhibited the growth of all sarcoma lines through the elimination of Treg‐mediated immunosuppression (Fig. 4A,B). For analyzing the regulation of Tregs between both types of tumor‐bearing mice, we selected representative SCC (CMC‐1) and sarcoma (CMS‐G4), which showed contrasting TGF‐β production (Fig. 3C) and almost the same growth rates in vitro and in vivo (data not shown). We counted the number of Tregs in CMS‐G4‐ and CMC‐1‐bearing mice after treatment with anti‐CD25 mAb. As shown in Figure 5, tumor‐free mice treated with anti‐CD25 mAb had a great reduction in naturally occurring Tregs (0.9 ± 0.2 × 10⁵). The decreased numbers of Tregs were slightly recovered (2.6 ± 0.6 × 10⁵) 7 days after the inoculation of 2 × 10⁶ CMS‐G4 sarcoma cells. However, in contrast with the case of sarcoma, mice inoculated with 2 × 10⁶ or 2 × 10⁵ CMC‐1 cells, which could not be rejected, showed a rapid and significant recovery of Tregs in tumor DLN (8.9 ± 0.4 × 10⁵ and 7.2 ± 1.0 × 10⁵). Thus, SCC induced a rapid recovery of Tregs in DLN of their bearing mice compared with sarcoma‐bearing mice after Treg‐depletion therapy.
Figure 4.
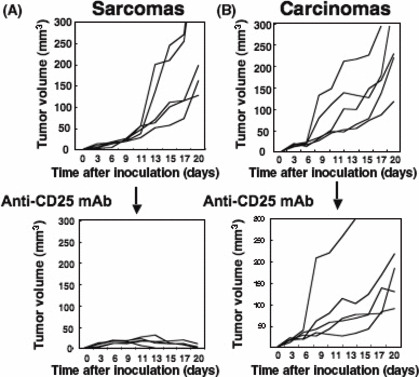
3‐Methylcholanthrene‐induced carcinomas, not sarcomas, are resistant to anti‐CD25 mAb treatment. Five kinds of primary sarcoma (A) or squamous cell carcinoma (B) cell lines (2 × 10⁶) were intradermally inoculated into BALB/c mice pre‐treated with control mAb or anti‐CD25 mAb (50 μg/mouse). Effects of the regulatory T cell depletion were evaluated by monitoring subsequent tumor growth. Similar results were obtained in two separate experiments.
Figure 5.
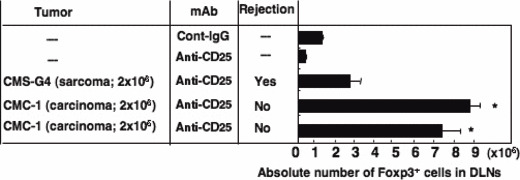
Number of regulatory T cells rapidly restored in non‐rejected tumor‐bearing mice treated with anti‐CD25 mAb. CMS‐G4 (sarcoma; 2 × 10⁶) and CMC‐1 (carcinoma; 2 × 10⁶ or 2 × 10⁵) cells were intradermally inoculated into mice pre‐treated with anti‐CD25 mAb. Seven days after tumor inoculation, we evaluated absolute numbers of CD4 + Foxp3 + T cells in draining lymph nodes (DLNs) of the tumor‐bearing mice by flow cytometric analysis. As controls (Cont), we analyzed tumor‐free mice treated with control IgG or anti‐CD25 mAb. The data shown are the mean ± SD of four mice. Similar results were obtained in three separate experiments. –, tumor free or not applicable. *P < 0.03 versus CMS‐G4‐bearing mice group.
Mice bearing SCC resistant to Treg‐depletion therapy cured from tumor by combined treatment with anti‐TGF‐β mAb. The results of Figure 5 suggested that SCC‐derived TGF‐β might accelerate the recovery of Tregs after depletion, which might induce refractoriness to anti‐CD25 mAb treatment. To examine the critical role of TGF‐β in the rapid recovery of Tregs, we gave anti‐TGF‐β mAb (1D11) to CMC‐1‐bearing mice after injection of anti‐CD25 mAb (PC61). As shown in Table 1, the numbers of Tregs were recovered (1.9 ± 0.3 × 10⁵) in CMC‐1 bearing mice after treatment with anti‐CD25 mAb (PC61) alone. However, the recovery were significantly inhibited (1.1 ± 0.1 × 10⁵) when mice were treated with anti‐CD25 mAb (PC61) and anti‐TGF‐β mAb (1D11) 5 days after tumor inoculation. To examine the antitumor effect of the combination therapy, we next evaluated tumor growth in mice treated with both mAbs. As shown in Figure 6, CMC‐1‐bearing mice treated with anti‐CD25 mAbcontrol IgG of 1D11 (blue triangle) showed a slight decrease in tumor growth compared with control IgG of PC61 + control IgG of 1D11 (white circle), but no mice were completely cured from tumor. However, when mice were treated with anti‐TGF‐β mAb combined with anti‐CD25 mAb, a complete rejection of SCC was induced (red circle). These results indicate that blocking the recovery of Tregs by anti‐TGF‐β mAb during Treg‐depletion therapy led to the complete cure of carcinoma‐bearing mice.
Table 1.
Anti‐transforming growth factor (TGF)‐β mAb treatment inhibited the recovery of regulatory T cells (Tregs) after anti‐CD25 mAb treatment
| Tumor | Day 5 | |||
|---|---|---|---|---|
| − | + | |||
| Anti‐CD25 | − | + | + | + |
| Anti‐TGF‐β | − | − | − | + |
| No. of Tregs (×105) | 1.6 ± 0.4 | 0.4 ± 0.1 | 1.9 ± 0.3* | 1.1 ± 0.1* |
CMC‐1 carcinoma cells (2 × 10⁵) were inoculated into BALB/c mice. The number of Tregs in draining lymph nodes was counted 5 days after tumor inoculation (*P < 0.03). Unit, number of Tregs ± SD (n = 5).
Figure 6.
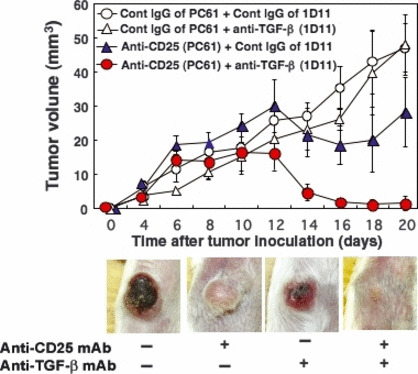
Inhibiting regulatory T cell recovery by treatment with anti‐transforming growth factor (TGF)‐β mAb leads to complete rejection of carcinoma. CMC‐1 (2 × 10⁵) cells were inoculated at day 0 into BALB/c mice pre‐treated with control IgG of PC61 (open circle, open triangle) or anti‐CD25 mAb (PC61; filled circle, filled triangle). Anti‐TGF‐β mAb (1D11; open triangle, filled circle) or control IgG of 1D11 (open circle, filled triangle) was injected i.p. six times at 2‐day intervals. Effects of the anti‐CD25 mAb and anti‐TGF‐β treatment were evaluated by monitoring subsequent tumor growth. The data shown are the mean ± SD of four mice. Photographs are representative at day 14. Similar results were obtained in three separate experiments.
Discussion
In this work, we show the distinct regulation of the immunosuppressive mechanism mediated by Tregs between MCA‐induced carcinoma and sarcoma. Although sarcomas are rejected by Treg‐depletion therapy, SCCs are resistant to anti‐CD25 mAb therapy because Tregs are rapidly recovered in DLN of SCC‐bearing mice by highly produced, active TGF‐β by SCC. However, combination treatment of SCC‐bearing mice with anti‐CD25 mAb (Treg‐depletion) and anti‐TGF‐β mAb (Treg‐recovery blockade) results in a complete rejection of SCCs.
It has been an important issue to resolve the mechanisms through which tumors exert their fatal growth in hosts.( 31 , 32 ) Recent published works have indicated that tumors can escape from immune surveillance mechanisms by inducing suppressive immunoregulatory cells, such as Tregs and myeloid‐derived suppressor cells.( 3 , 5 , 7 , 8 , 14 , 15 , 16 , 17 , 18 , 19 , 20 , 21 , 22 ) The critical role of Tregs, in particular, for immunosuppression of antitumor immunity has been shown by the Sakaguchi group of researchers.( 15 , 16 , 17 , 18 , 24 ) They indicated that anti‐CD25 mAb caused the depletion of Tregs and, in turn, activated host antitumor immunity to reject the established tumor.( 16 ) They also indicated that attenuating the effect of Tregs by targeting for GITR or CTLA‐4 enhanced the efficacy of antitumor activity even in mice bearing large‐established tumor.( 17 , 18 ) However, it has also been reported that natural killer (NK) cell‐sensitive RL‐male 1 and MethA sarcoma were completely rejected by Treg‐depletion therapy, whereas B16 melanoma, colon carcinoma, and lung carcinoma cells were refractory to the treatment, although slight growth inhibition was observed.( 15 , 16 , 27 , 28 ) It remains poorly understood why some tumors are resistant to Treg‐depletion therapy.
As shown in Figure 4, we initially found that there is a clear difference in the sensitivity against Treg‐depletion therapy between primary SCC and sarcomas, induced by a single injection of MCA.( 13 ) We consider that it is very valuable to evaluate the reason why mouse carcinomas are more refractory to Treg‐depletion therapy than sarcomas, in order to develop an efficient strategy to treat human cancers, most of which are carcinomas, not sarcomas.
In MCA‐induced SCC‐bearing mice, the number of Foxp3 + CD4 + T cells was increased in DLN, but neither spleen nor distal LN (Fig. 1). In tumor site, Foxp3 + T cells existed, as shown in Figure S1, but it was not easy to compare with LN and spleen simply because they were scattered in low density. As there was no difference in the immunosuppressive ability of Tregs in DLN, distal LN, and spleen (Fig. S1), the number of Tregs might be essential for assessing the inhibition they mediate. In previous papers,( 33 , 34 ) we showed that tumor‐vaccination combined with CpG adjuvant or Th1 cells caused a great accumulation of tumor‐specific CTL in DLN, but not in distal LN or spleen. Therefore, not only positive but also negative immunoregulatory cells appear to be activated at DLN of tumor‐bearing mice. Indeed, we confirmed that Tregs were actively divided in DLN by Ki‐67 staining (data not shown). Thus, the vigorous increase in Treg numbers in DLN of tumor‐bearing mice might be rational for supporting tumor escape from antitumor immunity. The great increase of Tregs in DLN of SCC‐bearing mice, but not sarcoma‐bearing mice (Fig. 2), indicates that SCCs have stronger immunosuppressive activity than sarcomas through their profound Treg induction.
The numbers of Tregs in DLN of SCC‐bearing mice were higher than those of sarcoma‐bearing mice even when the mice were treated with anti‐CD25 mAb to deplete Tregs before inoculation of tumors (Fig. 5). Moreover, Treg‐depletion therapy induces the rejection of sarcomas but not SCCs (Fig. 4). Judging from these results, we hypothesized that TGF‐β, produced at higher levels by SCC than sarcoma, might influence the rapid recovery of Tregs during tumor growth in Treg‐depleted mice. As expected, it was shown that the refractoriness of SCC‐bearing mice was overcome by the combination of anti‐TGF‐β mAb and anti‐CD25 mAb (Fig. 6). By this combined treatment, the replenishment of Tregs was blocked, resulting in a complete cure of mice from SCC, which was refractory to anti‐CD25 mAb treatment alone (Table 1 and Fig. 6). Although we succeeded in the complete rejection of CMC‐1, which produces high levels of TGF‐β, by combination therapy of anti‐CD25 mAb and anti‐TGF‐β mAb, it remains to be addressed whether the same strategy might be applicable to other carcinomas.
In this work, we showed that TGF‐β‐producing SCC were resistant to Treg‐depletion therapy because of rapid Treg recovery mediated by TGF‐β derived from SCC (4, 5, 6). However, despite the result that some sarcoma lines produced the same level of TGF‐β as carcinomas (Fig. 3C), all sarcomas were rejected by Treg‐depletion therapy. To explain the contradiction, we further sought to investigate whether other mechanisms, such as NK/CTL sensitivity, immunosuppression mediated by Mφ/CD11b+Gr‐1 + cells, IL‐10, and IL‐6, were involved in the phenomenon. We did obtain evidence of higher NK sensitivity in sarcomas than SCCs (data not shown). Importantly, in some published reports,( 16 , 35 , 36 ) NK cells were suppressed by Tregs as well as CTL, and were partly responsible for the rejection of some kinds of tumor when Tregs were depleted by anti‐CD25 mAb.
The final goal of tumor immunotherapy is to induce fully activated tumor‐specific CTLs in tumor‐bearers. In previous papers,( 1 , 33 ) we showed that Th1 cell therapy is critical to overcome immunosuppressive tumor escape and induce antitumor immunity in vivo. The elimination of Treg from peripheral blood mononuclear lymphocytes caused the augmented induction of NY‐ESO‐1‐specific Th1 cells, which enhance the generation of tumor‐specific antitumor immunity.( 37 ) It has been shown that tumor antigen‐specific Tregs played a critical role for the primary mouse tumor system and for human tumor systems.( 38 , 39 ) Therefore, the control of tumor‐specific Tregs will become important to induce a complete cure of tumor‐bearers accompanied with the induction of antitumor immunity in tumor‐bearing hosts. Here, we indicate that combination treatment of carcinoma‐bearing mice with Treg‐depletion therapy and Treg‐recovery blockade using anti‐CD25 mAb and anti‐TGF‐β mAb, respectively, is an efficient strategy to induce a strong antitumor immunity and a complete rejection of tumor. We have already developed Th1 cell therapy, which can accelerate the generation of tumor‐specific CTLs concomitantly with blocking the accumulation of Tregs in DLN of tumor‐bearing mice.( 40 ) We are now exerting the experiment by combination of the Th1 cell therapy with Treg ‐ depletion and anti–TGF‐β mAb treatment.
Supporting information
Fig. S1. Functional assay of regulatory T cells derived from tumor in draining lymph node (DLN), distal LN, and spleen.
Fig. S2. Ratio of regulatory T cells analyzed by immunochemical staining (green, Foxp3; red, CD4).
Please note: Wiley‐Blackwell are not responsible for the content or functionality of any supporting materials supplied by the authors. Any queries (other than missing material) should be directed to the corresponding author for the article.
Supporting info item
Supporting info item
Acknowledgments
We thank Takuko Sawada (Shionogi Pharmaceutical Institute, Osaka, Japan) for the kind donation of IL‐2. This work was partly supported by a Grant‐in‐Aid for National Project ‘Knowledge Cluster Initiative’ (2nd stage, Sapporo Biocluster Bio‐S) from the Ministry of Education, Culture, Sports, Science, and Technology (MEXT), Japan, a Grant‐in‐Aid for Scientific Research on Priority Areas, and a Grant‐in‐Aid for Young Scientists (B) from MEXT, the Akiyama Foundation, and the Osaka Cancer Research Foundation.
References
- 1. Nishimura T, Iwakabe K, Sekimoto M et al. Distinct role of antigen‐specific T helper type 1 (Th1) and Th2 cells in tumor eradication in vivo. J Exp Med 1999; 190: 617–27. [DOI] [PMC free article] [PubMed] [Google Scholar]
- 2. Colombo MP, Piconese S. Regulatory T‐cell inhibition versus depletion: the right choice in cancer immunotherapy. Nat Rev Cancer 2007; 7: 880–7. [DOI] [PubMed] [Google Scholar]
- 3. Gabrilovich DI, Nagaraj S. Myeloid‐derived suppressor cells as regulators of the immune system. Nat Rev Immunol 2009; 9: 162–74. [DOI] [PMC free article] [PubMed] [Google Scholar]
- 4. Ikeda H, Chamoto K, Tsuji T et al. The critical role of type‐1 innate and acquired immunity in tumor immunotherapy. Cancer Sci 2004; 95: 697–703. Review. [DOI] [PMC free article] [PubMed] [Google Scholar]
- 5. Johansson M, Denardo DG, Coussens LM. Polarized immune responses differentially regulate cancer development. Immunol Rev 2008; 222: 145–54. Review. [DOI] [PMC free article] [PubMed] [Google Scholar]
- 6. Stewart CA, Trinchieri G. Reinforcing suppression using regulators: a new link between STAT3, IL‐23, and Tregs in tumor immunosuppression. Cancer Cell 2009; 15: 81–3. [DOI] [PubMed] [Google Scholar]
- 7. Hanson EM, Clements VK, Sinha P, Ilkovitch D, Ostrand‐Rosenberg S. Myeloid‐derived suppressor cells down‐regulate L‐selectin expression on CD4+ and CD8+ T cells. J Immunol 2009; 183: 937–44. [DOI] [PMC free article] [PubMed] [Google Scholar]
- 8. Egen JG, Kuhns MS, Allison JP. CTLA‐4: new insights into its biological function and use in tumor immunotherapy. Nat Immunol 2002; 3: 611–8. Review. [DOI] [PubMed] [Google Scholar]
- 9. Iwai Y, Ishida M, Tanaka Y, Okazaki T, Honjo T, Minato N. Involvement of PD‐L1 on tumor cells in the escape from host immune system and tumor immunotherapy by PD‐L1 blockade. Proc Natl Acad Sci U S A 2002; 17: 12293–7. [DOI] [PMC free article] [PubMed] [Google Scholar]
- 10. Ohta A, Gorelik E, Prasad SJ et al. A2A adenosine receptor protects tumors from antitumor T cells. Proc Natl Acad Sci U S A 2006; 103: 13132–7. [DOI] [PMC free article] [PubMed] [Google Scholar]
- 11. Engell‐Noerregaard L, Hansen TH, Andersen MH, Thor Straten P, Svane IM. Review of clinical studies on dendritic cell‐based vaccination of patients with malignant melanoma: assessment of correlation between clinical response and vaccine parameters. Cancer Immunol Immunother 2009; 58: 1–14. Review [DOI] [PMC free article] [PubMed] [Google Scholar]
- 12. Rosenberg SA, Yang JC, Restifo NP. Cancer immunotherapy: moving beyond current vaccines. Nat Med 2004; 10: 909–15. [DOI] [PMC free article] [PubMed] [Google Scholar]
- 13. Wakita D, Chamoto K, Ohkuri T et al. IFN‐γ‐dependent type 1 immunity is crucial for immunosurveillance against squamous cell carcinoma in a novel mouse carcinogenesis model. Carcinogenesis 2009; 30: 1408–15. [DOI] [PubMed] [Google Scholar]
- 14. Grauer OM, Sutmuller RP, van Maren W et al. Elimination of regulatory T cells is essential for an effective vaccination with tumor lysate‐pulsed dendritic cells in a murine glioma model. Int J Cancer 2008; 122: 1794–802. [DOI] [PubMed] [Google Scholar]
- 15. Onizuka S, Tawara I, Shimizu J, Sakaguchi S, Fujita T, Nakayama E. Tumor rejection by in vivo administration of anti‐CD25 (interleukin‐2 receptor alpha) monoclonal antibody. Cancer Res 1999; 59: 3128–33. [PubMed] [Google Scholar]
- 16. Shimizu J, Yamazaki S, Sakaguchi S. Induction of tumor immunity by removing CD25 + CD4 + T cells: a common basis between tumor immunity and autoimmunity. J Immunol 1999; 163: 5211–8. [PubMed] [Google Scholar]
- 17. Wing K, Onishi Y, Prieto‐Martin P et al. CTLA‐4 control over Foxp3+ regulatory T cell function. Science 2008; 322: 271–5. [DOI] [PubMed] [Google Scholar]
- 18. Shimizu J, Yamazaki S, Takahashi T, Ishida Y, Sakaguchi S. Stimulation of CD25(+)CD4(+) regulatory T cells through GITR breaks immunological self‐tolerance. Nat Immunol 2002; 3: 135–42. [DOI] [PubMed] [Google Scholar]
- 19. Huber S, Schramm C, Lehr HA et al. Cutting edge: TGF‐β signaling is required for the in vivo expansion and immunosuppressive capacity of regulatory CD4+CD25+ T cells. J Immunol 2004; 173: 6526–31. [DOI] [PubMed] [Google Scholar]
- 20. Chen W, Jin W, Hardegen N et al. Conversion of peripheral CD4+CD25− naive T cells to CD4 + CD25 + regulatory T cells by TGF‐β induction of transcription factor Foxp3. J Exp Med 2003; 198: 1875–86. [DOI] [PMC free article] [PubMed] [Google Scholar]
- 21. Fantini MC, Becker C, Monteleone G, Pallone F, Galle PR, Neurath MF. Cutting edge: TGF‐ β induces a regulatory phenotype in CD4 + CD25 + T cells through Foxp3 induction and down‐regulation of Smad7. J Immunol 2004; 172: 5149–53. [DOI] [PubMed] [Google Scholar]
- 22. Ghiringhelli F, Puig PE, Roux S et al. Tumor cells convert immature myeloid dendritic cells into TGF‐beta‐secreting cells inducing CD4 + CD25 + regulatory T cell proliferation. J Exp Med 2005; 202: 919–29. [DOI] [PMC free article] [PubMed] [Google Scholar]
- 23. Gorelik L, Flavell RA. Transforming growth factor‐beta in T‐cell biology. Nat Rev Immunol 2002; 2: 46–53. [DOI] [PubMed] [Google Scholar]
- 24. Yamaguchi T, Hirota K, Nagahama K et al. Control of immune responses by antigen‐specific regulatory T cells expressing the folate receptor. Immunity 2007; 27: 145–59. [DOI] [PubMed] [Google Scholar]
- 25. Valzasina B, Guiducci C, Dislich H, Killeen N, Weinberg AD, Colombo MP. Triggering of OX40 (CD134) on CD4+ CD25+ T cells blocks their inhibitory activity: a novel regulatory role for OX40 and its comparison with GITR. Blood 2005; 105: 2845–51. [DOI] [PubMed] [Google Scholar]
- 26. Peng G, Guo Z, Kiniwa Y et al. Toll‐like receptor 8‐mediated reversal of CD4 + regulatory T cell function. Science 2005; 309: 1380–4. [DOI] [PubMed] [Google Scholar]
- 27. Liu A, Hu P, Khawli LA, Epstein AL. Combination B7‐Fc fusion protein treatment and Treg cell depletion therapy. Clin Cancer Res 2005; 11: 8492–502. [DOI] [PubMed] [Google Scholar]
- 28. Imai H, Saio M, Nonaka K et al. Depletion of CD4 + CD25 + regulatory T cells enhances interleukin‐2‐induced antitumor immunity in a mouse model of colon adenocarcinoma. Cancer Sci 2007; 98: 416–23. [DOI] [PMC free article] [PubMed] [Google Scholar]
- 29. Hontsu S, Yoneyama H, Ueha S et al. Visualization of naturally occurring Foxp3 + regulatory T cells in normal and tumor‐bearing mice. Int Immunopharmacol 2004; 4: 1785–93. [DOI] [PubMed] [Google Scholar]
- 30. Takiuchi H, Tada T, Li XF et al. Particular types of tumor cells have the capacity to convert transforming growth factor beta from a latent to an active form. Cancer Res 1992; 52: 5641–6. [PubMed] [Google Scholar]
- 31. van der Bruggen P, Traversari C, Chomez P et al. A gene encoding an antigen recognized by cytolytic T lymphocytes on a human melanoma. Science 1991; 254: 1643–7. [DOI] [PubMed] [Google Scholar]
- 32. Simpson A, Caballero O, Jungbluth A, Chen Y, Old L. Cancer/testis antigens, gametogenesis and cancer. Nat Rev Cancer 2005; 5: 615–25. [DOI] [PubMed] [Google Scholar]
- 33. Chamoto K, Wakita D, Narita Y et al. An essential role of antigen‐presenting cell/T‐helper type 1 cell‐cell interactions in draining lymph node during complete eradication of class II‐negative tumor tissue by T‐helper type 1 cell therapy. Cancer Res 2006; 66: 1809–17. [DOI] [PubMed] [Google Scholar]
- 34. Wakita D, Chamoto K, Zhang Y et al. An indispensable role of type‐1 IFNs for inducing CTL‐mediated complete eradication of established tumor tissue by CpG‐liposome co‐encapsulated with model tumor antigen. Int Immunol 2006; 18: 425–34. [DOI] [PubMed] [Google Scholar]
- 35. Nishikawa H, Kato T, Tawara I et al. Accelerated chemically induced tumor development mediated by CD25 + CD4 + regulatory T cells in wild‐type hosts. Proc Natl Acad Sci USA 2005; 102: 9253–7. [DOI] [PMC free article] [PubMed] [Google Scholar]
- 36. Ghiringhelli F, Ménard C, Martin F, Zitvogel L. The role of regulatory T cells in the control of natural killer cells: relevance during tumor progression. Immunol Rev 2006; 214: 229–38. Review. [DOI] [PubMed] [Google Scholar]
- 37. Nishikawa H, Tsuji T, Jäger E et al. Induction of regulatory T cell‐resistant helper CD4+ T cells by bacterial vector. Blood 2008; 111: 1404–12. [DOI] [PubMed] [Google Scholar]
- 38. Nishikawa H, Kato T, Tawara I et al. Definition of target antigens for naturally occurring CD4(+) CD25(+) regulatory T cells. J Exp Med 2005; 201: 681–6. [DOI] [PMC free article] [PubMed] [Google Scholar]
- 39. Wang HY, Lee DA, Peng G et al. Tumor‐specific human CD4+ regulatory T cells and their ligands: implications for immunotherapy. Immunity 2004; 20: 107–18. [DOI] [PubMed] [Google Scholar]
- 40. Zhang Y, Wakita D, Chamoto K et al. Th1 cell adjuvant therapy combined with tumor vaccination: a novel strategy for promoting CTL responses while avoiding the accumulation of Tregs. Int Immunol 2007; 19: 151–61. [DOI] [PubMed] [Google Scholar]
Associated Data
This section collects any data citations, data availability statements, or supplementary materials included in this article.
Supplementary Materials
Fig. S1. Functional assay of regulatory T cells derived from tumor in draining lymph node (DLN), distal LN, and spleen.
Fig. S2. Ratio of regulatory T cells analyzed by immunochemical staining (green, Foxp3; red, CD4).
Please note: Wiley‐Blackwell are not responsible for the content or functionality of any supporting materials supplied by the authors. Any queries (other than missing material) should be directed to the corresponding author for the article.
Supporting info item
Supporting info item