

Abstract
Midkine, a heparin‐binding growth factor, is up‐regulated in many types of cancer. The aim of this study was to measure plasma midkine levels in patients with breast cancer and to assess its clinical significance. We examined plasma midkine levels in 95 healthy volunteers, 11 patients with ductal carcinoma in situ (DCIS), 111 patients with primary invasive breast cancer without distant metastasis (PIBC), and 25 patients with distant metastatic breast cancer (MBC), using an automatic immunoasssay analyzer (TOSOH AIA system). In PIBC, we studied the correlation between plasma midkine levels and clinicopathological factors. Immunoreactive midkine was detectable in the plasma of healthy volunteers, and a cut‐off level of 750 pg/mL was established. In breast cancer patients, plasma midkine levels were increased above normal values. These elevated levels of midkine were seen in one (9.1%) of 11 patients with DCIS, 36 (32.4%) of 111 patients with PIBC, and 16 (64.0%) of 25 patients with MBC. Increased levels of midkine were correlated with menopausal status (P = 0.0497) and nuclear grade (P = 0.0343) in PIBC. Cancer detection rates based on midkine levels were higher than those based on three conventional markers including CA15‐3 (P < 0.0001), CEA (P = 0.0077), and NCCST‐439 (P < 0.0001). Detection rates of breast cancer using a combination of two conventional tumor markers (CA15‐3/CEA, CA15‐3/NCCST‐439, or CEA/NCCST‐439) with midkine is significantly higher than those using combination of three conventional tumor markers. Midkine may be a useful novel tumor marker for detection of breast cancer, superior to conventional tumor markers. (Cancer Sci 2009; 100: 1735–1739)
Multiple growth factors have been identified that are up‐regulated in malignant tumors, and these factors play crucial roles in tumorigenesis and tumor progression, including tumor survival, growth, invasion, angiogenesis, and metastasis.
Midkine, a heparin‐binding growth factor, was originally reported to be a product of a retinoic acid‐responsive gene in embryonal carcinoma cells.( 1 , 2 ) The human midkine gene is located on chromosome 11q11,( 2 , 3 ) and encodes a 13‐kDa protein rich in a basic amino acids and cysteine.( 4 ) Midkine is highly expressed during the mid‐gestational period of embryogenesis in mice and plays an important role in the development of tooth,( 5 ) lung,( 6 ) kidney,( 7 , 8 ) bone,( 9 , 10 ) and nerve tissue.( 11 )
Biological activities of midkine in cancer include the transformation of fibroblasts,( 12 ) cell growth,( 11 , 13 ) cell survival,( 11 , 13 ) cell migration,( 14 ) and angiogenesis.( 15 ) Overexpression of midkine mRNA and the protein itself were reported a variety of human malignancies such as oral,( 16 ) gastrointestinal,( 17 , 18 ) hepatobiliary,( 19 , 20 ) lung,( 21 ) thyroid,( 22 ) bladder,( 23 ) cervical,( 24 ) ovarian,( 25 ) and prostate cancer.( 26 ) Garber et al. demonstrated that 19 of 24 breast malignant tissue expressed midkine transcripts by reverse transcription–polymerase chain reaction (RT‐PCR) assay.( 27 ) Miyashiro et al. also showed that midkine expression in breast cancer tissue was detected using RT‐PCR, northern blot analysis, and immunohistochemistry.( 28 ) Midkine overexpression is also significantly correlated with prognosis in neuroblastoma,( 29 ) glioblastoma,( 30 ) and bladder carcinoma.( 23 ) On the other hand, antisense midkine oligodeoxyribonucleotides show anti‐tumor activity for neurofibroma derived–cells( 31 ) and mouse rectal carcinoma cells.( 32 ) In addition, siRNA inhibition of midkine expression has an antitumor effect in prostate( 33 ) and gastric cancer.( 34 ) Taken together, these results show that midkine may effect tumorigenesis and tumor progression.
In addition, increased midkine levels in blood have been reported in patients with several kinds of malignancy.( 35 , 36 , 37 , 38 ) In esophageal cancer, preoperative serum midkine concentration was an independent prognostic factor( 39 ) and was superior to conventional tumor markers for cancer detection.( 40 ) It is suggested that midkine levels in blood can be a novel tumor marker for cancer patients. However, little is known about circulating levels of midkine in patients with breast cancer.
In this study, we measured midkine concentrations in plasma from breast cancer patients as well as healthy individuals with a novel automated ELISA system using a combination of anti‐midkine monoclonal antibodies. To clarify the clinical usefulness of plasma midkine measurements, we examined the correlation between plasma midkine levels and clinicopathological parameters in operable invasive breast cancer patients. In addition, to evaluate the potential of midkine as a tumor marker, we compared the positive rate of midkine in patients with those of conventional tumor markers, such as CA15‐3, CEA, and NCC‐ST435.
Materials and Methods
Healthy controls and patients. A total of 104 healthy volunteers (48 females, 56 males) without any evidence of disease (e.g. liver dysfunction, rheumatoid arthritis, diabetes, etc.), and 147 female breast cancer patients (11 ductal carcinoma in situ, 111 primary invasive cancer, and 25 metastatic cancer) were enrolled in this study. Patients were treated at the Kumamoto University Hospital from 2002 to 2006. Breast cancer patients with liver dysfunction, rheumatoid arthritis, and other inflammatory diseases were excluded from this study. Informed consent was obtained from all of the patients and healthy volunteers. Clinical stages were determined according to the criteria of the Japanese Breast Cancer Society, which is based on the International Union Against Cancer (UICC) Criteria. Operable breast cancer patients were treated with curative operation and standard chemo‐endocrine therapy according to treatment recommendations such as the St. Gallen expert consensus meeting.( 41 , 42 ) This study protocol was approved by institutional review board at Kumamoto University Hospital and all patients and healthy volunteers provided written and informed consent.
Measurement of plasma midkine. Venous blood samples for measurement of midkine were drawn into sterile tubes containing ethylenediaminotetraacetic acid at detection of primary breast cancer or recurrent cancer, and centrifuged at 3000 g for 10 min. The plasma samples were stored at –80°C until they were used for determinations of midkine.
The midkine assay is a two‐site immunoenzymometric assay requiring 50 µL of plasma sample, which is performed automatically by an AIA‐600II immunoassay analyzer (Tosoh Corporation, Tokyo, Japan). This method has been previously described elsewhere.( 16 ) Briefly, Midkine in a sample is simultaneously reacted with mouse anti‐midkine monoclonal antibody (SC‐2) immobilized on magnetizable beads and with alkaline phosphatase–labeled mouse anti‐midkine monoclonal antibody (SC‐4) to form a sandwich structure. After 10 min of incubation at 37°C, beads are washed to remove unbound materials. A fluorogenic substrate, 4‐methylumbelliferyl phosphate, is added for enzyme‐substrate reaction at 37°C for 5 min. The rate of fluorescence increase due to release of 4‐methylumbelliferone is directly proportional to the midkine concentration in the samples. Intra‐assay coefficient of variation (CV) was 2.5–3.9% and inter‐assay CV was less than 3.2–5.8% in this automatic immunoasssay analyzer.
Measurement of CA15‐3, CEA, and NCCST‐439. Venous blood samples were drawn into sterile vacuum tubes at the same time of venous sampling for measurement of midkine. They were centrifuged 3000 g for 10 min and the serum samples were immediately used for CA15‐3 and carcinoembryonic antigen (CEA) determination or transferred to SRL (Tokyo, Japan) for NCC‐ST‐439 determination. Serum CA15‐3 and CEA were measured using commercial kits in the laboratory division of Kumamoto University Hospital. Serum CEA levels were analyzed by a solid phase ELISA method using an Architect CEA kit (Abbott Japan, Chiba, Japan) based on the quantitative ‘sandwich’ technique. Serum CA15‐3 values were measured using a chemiluminescent enzyme immunoassay with a Lumipalse CA15‐3 kit (Fujirebio Diagnostics, Malvern, PA, USA) based on the quantitative ‘sandwich’ technique. Serum NCC‐ST‐439 levels were analysed using an enzyme immunoassay with a commercially available kit (Lanazyme ST‐439 plate; Nippon Kayaku, Tokyo, Japan at SRL). Quality control and calibration for all the tumor marker measurements were strictly performed using commercial reference control sera. The coeffcients of intra‐ and inter‐assay variability for all the tumor markers were less than 10%. Following the laboratory's recommendation, the upper normal limits for the CEA, CA 15‐3 levels, and NCC‐ST‐439 were 2 ng/mL, 30 U/mL, and 7.0 U/mL, respectively.
All samples of serum were measured immediately after blood sampling. All specimen measurements were performed blinded to the clinical details.
Histology. Paraffin‐embedded samples were cut into 4‐µm sections, stained with hematoxylin–eosin and examined according to the criteria of the Japanese Breast Cancer Society.
Immunohistochemical analysis of hormone receptors and HER2. The expression of estrogen receptor (ER), progesterone receptor (PgR), and human epidermal growth factor receptor‐2 (HER2) were determined immunohistochemically in paraffin‐embedded tissue specimens. The expression of ER, PgR, and HER2 was studied in all primary invasive cancers. In addition, histological sections (4 µm in thickness) were transferred to silane‐coated slides and were air‐dried overnight at 37°C. The sections were deparaffinized in xylene and rehydrated through a graded series of decreasing ethanol concentrations. To block endogenous peroxidase activity, slides were incubated for 10 min in methanol containing 0.3% hydrogen peroxide and then rinsed with Tris‐buffered saline (TBS) solution.
We used mouse monoclonal antibody against ER (1D5, 1:50 dilution; Dako Japan, Tokyo, Japan) and PgR (PgR636, 1:800; Dako Japan, Tokyo, Japan) for detection of hormone receptors, and rabbit polyclonal antibody (1:200; Dako Japan) for detection of HER2. Expression of ER, PgR, and HER2 were determined by the recently developed Histofine Simple Stain MAX‐PO (Nichirei, Tokyo Japan) method. This method has been previously described elsewhere.( 43 ) Peroxidase activities were detected with 3,3‐diaminobenzideine (Dako Japan) for 5 min at room temperature. The sections were counter‐stained with hematoxylin and dehydrated in alcohol and xylene before the sections were mounted. Negative controls were performed using non‐immune serum or PBS in place of the primary antibodies.
Statistical analysis. For metric variables, the Mann–Whitney U‐test or Kruskal–Wallis test were used to assess the statistical significance of correlations between plasma midkine levels and tumor characteristics. The Steel and Steel–Dwass test was also used for multiple comparisons between normal controls and patients with breast cancer including ductal carcinoma in situ (DCIS), primary invasive cancer without distant metastasis, and metastatic breast cancer. For categorical variables, χ2‐test or Fisher's exact test were used to determine the significance of differences between groups. The McNeman test was also used for comparison between detection rates of breast cancer with tumor markers and midkine. All analyses except the Steel and Steel–Dwass test were performed with the JMP IN version 5.1 software package (SAS Institute Japan, Tokyo, Japan). The Steel and Steel–Dwass test was done with the KyPlot version 5.0 (KyenseLab incorpotated, Tokyo, Japan). P‐values of less than 0.05 were regarded as statistically significant. All statistical tests were two‐sided.
Results
Plasma levels of midkine in normal controls. Plasma midkine levels in 104 healthy volunteers varied from 302 to 1068 pg/mL (mean, 489 pg/mL; 25th percentile, 411 pg/mL; 75th percentile 542 pg/mL). No significant differences were observed between age or between women (n= 48; mean, 488 pg/mL; 25th percentile, 415 pg/mL; 75th percentile, 543 pg/mL) and men (n= 56; mean, 501 pg/mL; 25th percentile, 409 pg/mL; 75th percentile, 542 pg/mL). A box plot of midkine levels in all healthy volunteers showed four outliners (1067.9, 865.0, 762.7, 751.4 pg/mL, respectively) (data not shown). The cut‐off values of midkine levels were determined, with 750 pg/mL almost the lowest outliner. The positive rate was only 3.8% (4/104) in healthy volunteers.
Plasma levels of midkine in breast cancer patients. Plasma midkine levels in breast cancer patients and normal controls are shown in Figure 1. Immunoreactive plasma midkine in patients with breast cancer were elevated compared to normal controls (DCIS: n= 11, P < 0.05; primary invasive cancer without distant metastasis: n= 111, P < 0.001; metastatic disease: n = 25, P < 0.00; Steel test). Furthermore, plasma midkine levels in metastatic cancer patients were significantly higher than those levels in DCIS (P < 0.001) and primary invasive cancer (P < 0.001, Steel–Dwass test). However, those levels did not differ significantly between DCIS and primary cancer. The positive rate was 9.1% (1/11), 32.4% (36/111), and 64% (16/25) in DCIS, primary, and metastatic cancer patients, respectively.
Figure 1.
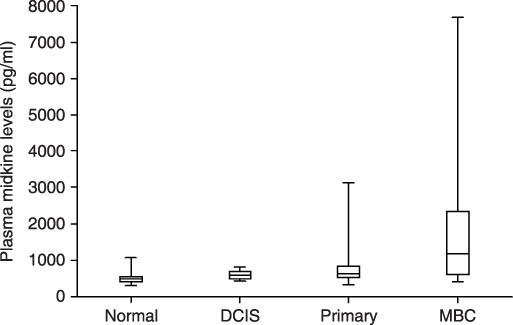
Plasma midkine levels in normal controls, ductal carcinoma in situ (DCIS) patients, primary invasive breast cancer patients, and metastatic breast cancer patients. Levels are expressed in pg/mL. Box, center bar in the box, and error bar show interquartile range, median of midkine levels, and range from minimum to maximum value. Normal: healthy volunteers; n = 104; median midkine levels = 489 pg/mL; 25th percentile = 411 pg/mL; 75th percentile = 542 pg/mL; minimum levels = 302 pg/mL; maximum levels = 1068 pg/mL; positive rate = 3.8% (4/104). DCIS: ductal carcinoma in situ, n = 11; median midkine levels = 589 pg/mL; 25th percentile = 493 pg/mL; 75th percentile = 704 pg/mL; minimum levels = 423 pg/mL; maximum levels = 817 pg/mL; positive rate = 9.1% (1/11). Primary: primary invasive breast cancer without distant metastasis; n = 11; median midkine levels = 645 pg/mL; 25th percentile = 523 pg/mL; 75th percentile = 826 pg/mL; minimum levels = 323 pg/mL; maximum levels = 3120 pg/mL; positive rate = 32.4% (36/111). Metastatic: metastatic breast cancer; n = 25; median midkine levels = 1252 pg/mL; 25th percentile = 602 pg/mL; 75th percentile = 2543 pg/mL; minimum levels = 414 pg/mL; maximum levels = 7665 pg/mL; positive rate = 64% (16/25). The Steel test showed significant difference between healthy volunteers and patients with breast cancer including DCIS (P < 0.05), primary invasive cancer (P < 0.001), and metastatic breast cancer (P < 0.001). The Steel–Dwass test also showed significant difference between DCIS and metastatic disease (P < 0.05), and between primary invasive cancer and metastatic disease (P < 0.01), but no significant difference between DCIS and primary invasive cancer.
Association between plasma midkine levels and clinicopathological parameaters in primary invasive breast cancer. Among 111 primary invasive breast cancer patients, plasma midkine levels were significantly higher in postmenopausal patients than premenopausal ones (P = 0.0497, Mann–Whitney U‐test). Plasma midkine levels were also significantly higher in patients with poorly differentiated tumors than those with well‐differentiated tumors (P = 0.0343, Mann–Whitney U‐test). However, there were no significant differences with respect to tumor size, nodal status, clinical stage, vascular permeations, hormone receptor status, and HER2 status (Table 1).
Table 1.
Plasma midkine levels according to clinical parameters in patients with primary breast cancer
| Clinical parameters | No. of patients | Mean midkine levels (pg/mL) Median (25th,75th percentile) | P‐values | Positive rate (750 pg/mL) | |
|---|---|---|---|---|---|
| Menopause | Pre‐ | 28 | 558 (472, 726) | 0.0497 | 17.9% |
| Post‐ | 83 | 688 (555, 860) | 39.8% | ||
| Tumor size (mm) | ≤20 | 64 | 690 (555, 854) | n.s. | 40.6% |
| >20 | 47 | 597 (500, 763) | 25.5% | ||
| Nodal status | – | 70 | 603 (521, 812) | n.s. | 30.0% |
| + | 41 | 697 (528, 861) | 41.5% | ||
| Stage | I | 44 | 652 (531, 816) | 34.1% | |
| II | 55 | 604 (500, 831) | n.s. | 29.1% | |
| III | 12 | 743 (545, 849) | 58.3% | ||
| Nuclear grade | 1 | 65 | 601 (491, 783) | 29.6% | |
| 2 | 26 | 636 (534, 766) | 0.0343 | 26.9% | |
| 3 | 20 | 835 (581, 1006) | 60.0% | ||
| Lymphatic invasion | – | 80 | 640 (518, 794) | n.s. | 31.3% |
| + | 31 | 645 (528, 844) | 41.9% | ||
| Vessel invasion | – | 102 | 646 (523, 824) | n.s. | 34.3% |
| + | 9 | 605 (520, 866) | 33.3% | ||
| ER | – | 24 | 668 (563, 849) | n.s. | 41.6% |
| + | 87 | 608 (511, 824) | 32.2% | ||
| PgR | – | 47 | 658 (544, 835) | n.s. | 38.3% |
| + | 64 | 606 (493, 825) | 31.3% | ||
| HER2 | – | 95 | 625 (519, 826) | n.s. | 33.7% |
| + | 16 | 652 (563, 836) | 38.3% | ||
ER, estrogen receptor; HER2, human epidermal growth factor receptor 2; n.s., not significant; PgR, progesterone receptor.
Plasma midkine and conventional tumor markers. To evaluate the usefulness of plasma midkine as a tumor marker for detecting breast cancer, its positive rates were compared with those of three conventional tumor markers for breast cancer. The positivity for midkine was significantly higher than for CA15‐3 (P < 0.001), CEA (P = 0.0094), and NCCST‐439 (P < 0.001, McNeman test) in all cancer patients (Table 2). Notably, cancer detection rates of midkine were significantly superior to those of the three conventional markers in patients with primary invasive cancer without distant metastasis. The positivity of midkine was significantly correlated with that of CA15‐3 (P = 0.0006, χ2‐test), CEA (P < 0.0001, χ2‐test), and NCCST‐439 (P = 0.0031, Fisher's exact test) (Table 3). Aberrant midkine elevation was observed in 36.1% (53/147) patients with breast cancer. Single midkine could detect 22 patients (21.4%) with breast cancer which was not detected in 103 patients with cancer using a combination of three conventional tumor markers. On the other hand, a combination of three conventional tumor markers detected 22 patients (10.8%) with cancer which was not detected in 94 patients with cancer without midkine elevation.
Table 2.
Detection of breast cancer according to midkine and conventional tumor markers for breast cancer
| No. of patients | Midkine | CA15‐3 | CEA | NCCST‐439 | |
|---|---|---|---|---|---|
| DCIS | 11 | 1 (9.1%) | 0 (0%) | 1 (9.1%) | 1 (9.1%) |
| Primary | 111 | 36 (32.4%) | 2 (5.3%)* | 20 (18.0%)** | 5 (4.5%)* |
| Metastatic | 25 | 16 (64.0%) | 16 (64.0%) | 16 (64.0%) | 9 (36%)*** |
| All | 147 | 53 (36.1%) | 18 (12.2%)* | 37 (25.2%)**** | 15 (10.7%)* |
P‐values when the positivity of midkine was significantly higher than conventional tumor marker are *P < 0.0001, **P = 0.0077, ***P = 0.0082, and ****P = 0.0094 (McNeman test). DCIS, ductal carcinoma in situ.
Table 3.
Correlation between the aberrant expression levels of midkine and conventional tumor markers in patients with breast cancer (n = 147)
|
(a) Midkine and CA15‐3 | ||
|---|---|---|
| CA15‐3 elevation (–) | CA15‐3 elevation (+) | |
| Midkine elevation (–) | 89 (60.1%) | 5 (3.4%) |
| Midkine elevation (+) | 40 (27.2%) | 13 (8.8%) |
|
(b) Midkine and CEA | ||
|---|---|---|
| CEA elevation (–) | CEA elevation (+) | |
| Midkine elevation (–) | 83 (56.5%) | 11 (7.5%) |
| Midkine elevation (+) | 27 (18.4%) | 26 (17.7%) |
|
(c) Midkine and NCCST‐439 | ||
|---|---|---|
| NCCST‐439 elevation (–) | NCCST‐439 elevation (+) | |
| Midkine elevation (–) | 90 (61.2%) | 4 (2.7%) |
| Midkine elevation (+) | 42 (28.6%) | 11 (7.5%) |
P = 0.0006 (χ2‐test).
P < 0.0001 (χ2‐test).
P = 0.0031 (Fisher's exact test).
Cancer detection rate with a combination of two conventional tumor markers and midkine in patients with breast cancer. The detection rate of breast cancer with a combination of three conventional tumor markers, CA15‐3, CEA, and NCC‐ST 439, was in 29.9% patients with breast cancer. On the other hand, the cancer detection rate of three markers which are two conventional tumor markers (CA15‐3/CEA, CA15‐3/NCCST‐439, and CEA/NCCST‐439) and midkine were significantly higher than that of three conventional tumor markers (44.9%, P < 0.0001; 41.5%, P = 0.0031; 44.9%, P < 0.0001, respectively, Table 4).
Table 4.
Detection rates of primary and metastatic breast cancer (n = 147) using a combination of three tumor markers
| Combination of tumor markers | No. of cases (%) |
|---|---|
| 1. CA15‐3/CEA/NCCST‐439 positive | 44 (29.9%) |
| 2. Midkine/CA15‐3/CEA positive | 66 (44.9%) |
| 3. Midkine/CA15‐3/NCCST‐439 positive | 61 (41.5%) |
| 4. Midkine/CEA/NCCST‐439 positive | 66 (44.9%) |
1 vs 2, P < 0.0001; 1 vs 3, P = 0.0031; 1 vs 4, P < 0.0001 (McNeman test).
Discussion
In these present experiments, we used an automatic immunoassay system with a combination of monoclonal antibodies. This approach offers superior quality control compared to methods based on polyclonal antibodies. Furthermore, this automatic immunoassay system could be useful for screening large numbers of people for cancer.
Growth factors, expressed by tumor cells and/or stroma cells acting in autocrine and/or paracrine fashion, greatly contribute to tumorigenesis and tumor progression. In addition, numerous studies have demonstrated that circulating levels of growth factors in cancer patients are increased compared to healthy individuals, and these growth factors may function in an endocrine fashion to promote metastatic foci.( 44 ) Midkine is a multifunctional growth factor, which can induce various effects on target cells, including nerve cells, neutrophils, macrophages, smooth muscle cells, fibroblasts, and tumor cells.( 11 , 13 ) Midkine not only transforms fibroblasts( 12 ) but also exerts mitogenic,( 14 ) antiapoptotic,( 11 , 13 ) and proangiogenic effects( 15 ) in cancer development. Recently, we demonstrated the clinical significance of midkine levels in the blood in oral squamous cell carcinoma. Protein and mRNA expression of midkine were detected, and serum concentration of midkine had prognostic value in oral squamous cell carcinoma.( 16 ) In breast cancer, midkine is overexpressed in cancerous tissues.( 27 , 28 ) Shimada et al. showed that midkine expression in esophageal carcinoma tissues was significantly associated with increased levels in the serum.( 39 ) We therefore speculated that midkine could be secreted into the blood circulation from tumor tissue, and that plasma midkine levels could be clinically relevant. In this study, we showed that plasma midkine levels were abnormally elevated in breast cancer patients, especially in metastatic cases. Measurement of plasma midkine levels may be useful for detection of primary invasive cancer and metastatic cancer, although the levels were not significantly elevated in patients with DCIS.
In primary invasive cancer, plasma midkine levels were significantly correlated with menopausal status although the reason for this remains to be elucidated. Previous reports demonstrated no significant correlation between serum midkine concentrations and age in healthy individuals.( 36 ) Likewise, we found no age‐related differences in plasma midkine concentrations among healthy volunteers ranging from 18 to 60 years old. The levels in plasma were significantly correlated with nuclear grade, but not clinical stage, tumor size, or nodal status, in primary invasive cancer. Nuclear grade is an indicator of tumor differentiation and malignant potential, and high nuclear grade is an aggressive phenotype that has poor prognosis compared with low nuclear grade.( 45 ) Plasma midkine levels may depend on malignant potential rather than tumor burden in primary invasive cancer patients.
Shimada et al. also demonstrated that the serum midkine positive rate for detecting esophageal cancer was significantly higher than those of CEA, squamous cell carcinoma antigen, and cytokeratin 19 fragment.( 40 ) To evaluate its potential as a marker for breast cancer, we compared the positive rates of midkine and other conventional tumor markers, including CA15‐3, CEA and NCCST‐439. CA15‐3 and CEA have been shown to be clinically useful and are recommended for use in clinical practice.( 46 ) NCC‐ST‐439 antigen (ST‐439) is a tumor‐related carbohydrate antigen, which is superior in sensitivity but inferior in specificity to CA15‐3 and CEA.( 47 ) Their levels in serum show no correlation with the levels of CEA or CA15‐3. The positive rate of midkine in detecting breast cancer was significantly higher than those of CA15‐3, CEA, and NCCST‐439 particularly in patients with primary invasive cancer. Furthermore, detection rates of breast cancer using a combination of two conventional tumor markers (CA15‐3/CEA, CA15‐3/NCCST‐439, or CEA/NCCST‐439) with midkine is significantly higher than those using a combination of three conventional tumor markers. Thus, midkine can be as good or better than conventional markers in detecting breast cancer.
In conclusion, plasma midkine levels were abnormally elevated in patients with breast cancer compared to healthy controls. Plasma levels of midkine may be more valuable than currently used tumor markers in the detection of primary and metastatic breast cancer, although large clinical validation studies are needed to establish the clinical significance of midkine in the plasma of patients with breast cancer.
Supporting information
Fig. S1. The receiver–operator (ROC) curve for detecting breast cancer using plasma midkine levels. The ROC curve indicated 555 pg/mL as a cut‐off value of plasma midkine levels. The sensitivity and the false negative rates were 71% and 22% for detecting breast cancer using this cut‐off value, respectively. The area under the curve (AUC) of this ROC was 0.80 and showed that plasma midkine clearly divided healthy volunteers and malignancy.
Fig. S2. Frequency distribution and box plot of plasma midkine levels among healthy volunteers. Dots above bar represent four outliners (1067.9, 865.0, 762.7, 751.4 pg/mL, respectively) in the box plot.
Fig. S3. Distribution of plasma midkine levels according to age.
Please note: Wiley‐Blackwell are not responsible for the content or functionality of any supporting materials supplied by the authors. Any queries (other than missing material) should be directed to the corresponding author for the article.
Supporting info item
References
- 1. Kadomatsu K, Tomomura M, Muramatsu T. cDNA cloning and sequencing of a new gene intensely expressed in early differentiation stages of embryonal carcinoma cells and in mid‐gestation period of mouse embryogenesis. Biochem Biophys Res Commun 1988; 151: 1312–8. [DOI] [PubMed] [Google Scholar]
- 2. Matsubara S, Tomomura M, Kadomatsu K, Muramatsu T. Structure of a retinoic acid‐responsive gene, MK, which is transiently activated during the differentiation of embryonal carcinoma cells and the mid‐gestation period of mouse embryogenesis. J Biol Chem 1990; 265: 9441–3. [PubMed] [Google Scholar]
- 3. Kaname T, Kuwano A, Murano I et al . Midkine gene (MDK), a gene for prenatal differentiation and neuroregulation, maps to band 11p11.2 by fluorescence in situ hybridization. Genomics 1993; 17: 514–5. [DOI] [PubMed] [Google Scholar]
- 4. Murasugi A, Tohma‐Aiba Y. Production of native recombinant human midkine in the yeast, Pichia pastoris. Protein Expr Purif 2003; 27: 244–52. [DOI] [PubMed] [Google Scholar]
- 5. Mitsiadis TA, Muramatsu T, Muramatsu H, Thesleff I. Midkine (MK), a heparin‐binding growth/differentiation factor, is regulated by retinoic acid and epithelial‐mesenchymal interactions in the developing mouse tooth, and affects cell proliferation and morphogenesis. J Cell Biol 1995; 129: 267–81. [DOI] [PMC free article] [PubMed] [Google Scholar]
- 6. Toriyama K, Muramatsu H, Hoshino T, Torii S, Muramatsu T. Evaluation of heparin‐binding growth factors in rescuing morphogenesis of heparitinase‐treated mouse embryonic lung explants. Differentiation 1997; 61: 161–7. [DOI] [PubMed] [Google Scholar]
- 7. Sakurai H, Bush KT, Nigam SK. Identification of pleiotrophin as a mesenchymal factor involved in ureteric bud branching morphogenesis. Development 2001; 128: 3283–93. [DOI] [PubMed] [Google Scholar]
- 8. Vilar J, Lalou C, Duong VH et al . Midkine is involved in kidney development and in its regulation by retinoids. J Am Soc Nephrol 2002; 13: 668–76. [DOI] [PubMed] [Google Scholar]
- 9. Dreyfus J, Brunet‐de Carvalho N, Duprez D, Raulais D, Vigny M. HB‐GAM/pleiotrophin but not RIHB/midkine enhances chondrogenesis in micromass culture. Exp Cell Res 1998; 241: 171–80. [DOI] [PubMed] [Google Scholar]
- 10. Imai S, Kaksonen M, Raulo E et al . Osteoblast recruitment and bone formation enhanced by cell matrix‐associated heparin‐binding growth‐associated molecule (HB‐GAM). J Cell Biol 1998; 143: 1113–28. [DOI] [PMC free article] [PubMed] [Google Scholar]
- 11. Kadomatsu K, Muramatsu T. Midkine and pleiotrophin in neural development and cancer. Cancer Lett 2004; 204: 127–43. [DOI] [PubMed] [Google Scholar]
- 12. Kadomatsu K, Hagihara M, Akhter S et al . Midkine induces the transformation of NIH3T3 cells. Br J Cancer 1997; 75: 354–9. [DOI] [PMC free article] [PubMed] [Google Scholar]
- 13. Muramatsu T. Midkine and pleiotrophin: two related proteins involved in development, survival, inflammation and tumorigenesis. J Biochem 2002; 132: 359–71. [DOI] [PubMed] [Google Scholar]
- 14. Qi M, Ikematsu S, Maeda N et al . Haptotactic migration induced by midkine. Involvement of protein‐tyrosine phosphatase zeta. Mitogen‐activated protein kinase, and phosphatidylinositol 3‐kinase. J Biol Chem 2001; 276: 15868–75. [DOI] [PubMed] [Google Scholar]
- 15. Choudhuri R, Zhang HT, Donnini S, Ziche M, Bicknell R. An angiogenic role for the neurokines midkine and pleiotrophin in tumorigenesis. Cancer Res 1997; 57: 1814–9. [PubMed] [Google Scholar]
- 16. Ota K, Fujimori H, Ueda M et al . Midkine as a prognostic biomarker in oral squamous cell carcinoma. Br J Cancer 2008; 99: 655–62. [DOI] [PMC free article] [PubMed] [Google Scholar]
- 17. Aridome K, Tsutsui J, Takao S et al . Increased midkine gene expression in human gastrointestinal cancers. Jpn J Cancer Res 1995; 86: 655–61. [DOI] [PMC free article] [PubMed] [Google Scholar]
- 18. Ye C, Qi M, Fan QW et al . Expression of midkine in the early stage of carcinogenesis in human colorectal cancer. Br J Cancer 1999; 79: 179–84. [DOI] [PMC free article] [PubMed] [Google Scholar]
- 19. Kato M, Shinozawa T, Kato S, Awaya A, Terada T. Increased midkine expression in hepatocellular carcinoma. Arch Pathol Lab Med 2000; 124: 848–52. [DOI] [PubMed] [Google Scholar]
- 20. Kato M, Shinozawa T, Kato S, Endo K, Terada T. Increased midkine expression in intrahepatic cholangiocarcinoma: immunohistochemical and in situ hybridization analyses. Liver 2000; 20: 216–21. [DOI] [PubMed] [Google Scholar]
- 21. Garver RI Jr, Chan CS, Milner PG. Reciprocal expression of pleiotrophin and midkine in normal versus malignant lung tissues. Am J Respir Cell Mol Biol 1993; 9: 463–6. [DOI] [PubMed] [Google Scholar]
- 22. Kato M, Maeta H, Kato S, Shinozawa T, Terada T. Immunohistochemical and in situ hybridization analyses of midkine expression in thyroid papillary carcinoma. Mod Pathol 2000; 13: 1060–5. [DOI] [PubMed] [Google Scholar]
- 23. O'Brien T, Cranston D, Fuggle S, Bicknell R, Harris AL. The angiogenic factor midkine is expressed in bladder cancer, and overexpression correlates with a poor outcome in patients with invasive cancers. Cancer Res 1996; 56: 2515–8. [PubMed] [Google Scholar]
- 24. Moon HS, Park WI, Sung SH et al . Immunohistochemical and quantitative competitive PCR analyses of midkine and pleiotrophin expression in cervical cancer. Gynecol Oncol 2003; 88: 289–97. [DOI] [PubMed] [Google Scholar]
- 25. Nakanishi T, Kadomatsu K, Okamoto T, Tomoda Y, Muramatsu T. Expression of midkine and pleiotropin in ovarian tumors. Obstet Gynecol 1997; 90: 285–90. [DOI] [PubMed] [Google Scholar]
- 26. Konishi N, Nakamura M, Nakaoka S et al . Immunohistochemical analysis of midkine expression in human prostate carcinoma. Oncology 1999; 57: 253–7. [DOI] [PubMed] [Google Scholar]
- 27. Garver RI Jr, Radford DM, Donis‐Keller H, Wick MR, Milner PG. Midkine and pleiotrophin expression in normal and malignant breast tissue. Cancer 1994; 74: 1584–90. [DOI] [PubMed] [Google Scholar]
- 28. Miyashiro I, Kaname T, Shin E et al . Midkine expression in human breast cancers: expression of truncated form. Breast Cancer Res Treat 1997; 43: 1–6. [DOI] [PubMed] [Google Scholar]
- 29. Nakagawara A, Milbrandt J, Muramatsu T et al . Differential expression of pleiotrophin and midkine in advanced neuroblastomas. Cancer Res 1995; 55: 1792–7. [PubMed] [Google Scholar]
- 30. Mishima K, Asai A, Kadomatsu K et al . Increased expression of midkine during the progression of human astrocytomas. Neurosci Lett 1997; 233: 29–32. [DOI] [PubMed] [Google Scholar]
- 31. Mashour GA, Ratner N, Khan GA et al . The angiogenic factor midkine is aberrantly expressed in NF1‐deficient Schwann cells and is a mitogen for neurofibroma‐derived cells. Oncogene 2001; 20: 97–105. [DOI] [PubMed] [Google Scholar]
- 32. Takei Y, Kadomatsu K, Matsuo S et al . Antisense oligodeoxynucleotide targeted to Midkine, a heparin‐binding growth factor, suppresses tumorigenicity of mouse rectal carcinoma cells. Cancer Res 2001; 61: 8486–91. [PubMed] [Google Scholar]
- 33. Takei Y, Kadomatsu K, Goto T, Muramatsu T. Combinational antitumor effect of siRNA against midkine and paclitaxel on growth of human prostate cancer xenografts. Cancer 2006; 107: 864–73. [DOI] [PubMed] [Google Scholar]
- 34. Wang Q, Huang Y, Ni Y, Wang H, Hou Y. siRNA targeting midkine inhibits gastric cancer cells growth and induces apoptosis involved caspase‐3,8,9 activation and mitochondrial depolarization. J Biomed Sci 2007; 14: 783–95. [DOI] [PubMed] [Google Scholar]
- 35. Ikematsu S, Yano A, Aridome K et al . Serum midkine levels are increased in patients with various types of carcinomas. Br J Cancer 2000; 83: 701–6. [DOI] [PMC free article] [PubMed] [Google Scholar]
- 36. Krzystek‐Korpacka M, Matusiewicz M, Diakowska D et al . Serum midkine depends on lymph node involvement and correlates with circulating VEGF‐C in oesophageal squamous cell carcinoma. Biomarkers 2007; 12: 403–13. [DOI] [PubMed] [Google Scholar]
- 37. Muramatsu H, Song XJ, Koide N et al . Enzyme‐linked immunoassay for midkine, and its application to evaluation of midkine levels in developing mouse brain and sera from patients with hepatocellular carcinomas. J Biochem 1996; 119: 1171–5. [DOI] [PubMed] [Google Scholar]
- 38. Obata Y, Kikuchi S, Lin Y et al . Serum midkine concentrations and gastric cancer. Cancer Sci 2005; 96: 54–6. [DOI] [PMC free article] [PubMed] [Google Scholar]
- 39. Shimada H, Nabeya Y, Tagawa M et al . Preoperative serum midkine concentration is a prognostic marker for esophageal squamous cell carcinoma. Cancer Sci 2003; 94: 628–32. [DOI] [PMC free article] [PubMed] [Google Scholar]
- 40. Shimada H, Nabeya Y, Okazumi S et al . Increased serum midkine concentration as a possible tumor marker in patients with superficial esophageal cancer. Oncol Rep 2003; 10: 411–4. [PubMed] [Google Scholar]
- 41. Goldhirsch A, Glick JH, Gelber RD, Coates AS, Senn HJ. Meeting highlights: International Consensus Panel on the Treatment of Primary Breast Cancer. Seventh International Conference on Adjuvant Therapy of Primary Breast Cancer. J Clin Oncol 2001; 19: 3817–27. [DOI] [PubMed] [Google Scholar]
- 42. Goldhirsch A, Wood WC, Gelber RD et al . Meeting highlights: updated international expert consensus on the primary therapy of early breast cancer. J Clin Oncol 2003; 21: 3357–65. [DOI] [PubMed] [Google Scholar]
- 43. Yamamoto Y, Ibusuki M, Okumura Y et al . Hypoxia‐inducible factor 1alpha is closely linked to an aggressive phenotype in breast cancer. Breast Cancer Res Treat 2008; 110: 465–75. [DOI] [PubMed] [Google Scholar]
- 44. Kuroi K, Toi M. Circulating angiogenesis regulators in cancer patients. Int J Biol Markers 2001; 16: 5–26. [DOI] [PubMed] [Google Scholar]
- 45. Trudeau ME, Pritchard KI, Chapman J‐AW et al . Prognostic factors affecting the natural history of node‐negative breast cancer. Breast Cancer Research and Treatment 2005; 89: 35–45. [DOI] [PubMed] [Google Scholar]
- 46. Harris L, Fritsche H, Mennel R et al . American Society of Clinical Oncology 2007 update of recommendations for the use of tumor markers in breast cancer. J Clin Oncol 2007; 25: 5287–312. [DOI] [PubMed] [Google Scholar]
- 47. Narita T, Funahashi H, Satoh Y, Imai T, Takagi H. Serum and immunohistochemical studies of NCC‐ST‐439 in breast cancer. J Surg Oncol 1993; 54: 5–8. [DOI] [PubMed] [Google Scholar]
Associated Data
This section collects any data citations, data availability statements, or supplementary materials included in this article.
Supplementary Materials
Fig. S1. The receiver–operator (ROC) curve for detecting breast cancer using plasma midkine levels. The ROC curve indicated 555 pg/mL as a cut‐off value of plasma midkine levels. The sensitivity and the false negative rates were 71% and 22% for detecting breast cancer using this cut‐off value, respectively. The area under the curve (AUC) of this ROC was 0.80 and showed that plasma midkine clearly divided healthy volunteers and malignancy.
Fig. S2. Frequency distribution and box plot of plasma midkine levels among healthy volunteers. Dots above bar represent four outliners (1067.9, 865.0, 762.7, 751.4 pg/mL, respectively) in the box plot.
Fig. S3. Distribution of plasma midkine levels according to age.
Please note: Wiley‐Blackwell are not responsible for the content or functionality of any supporting materials supplied by the authors. Any queries (other than missing material) should be directed to the corresponding author for the article.
Supporting info item