Abstract
Foxp3+ CD4+CD25+ regulatory T (Treg) cells and immunoregulatory enzyme indoleamine 2,3‐dioxygenase (IDO) play an important role in immunoregulation. Accumulating evidence shows that IDO and Treg cells have potent regulatory properties for immune escape in cancer. To evaluate the expression of IDO and the localization of Foxp3+ Treg cells in the development and progression of uterine cervical cancer, IDO expression and Foxp3+ Treg cells in the primary and metastatic lesions were studied using immunohistochemistry. IDO expression in tumor cells appeared in cervical intraepithelial neoplasia (CIN)‐3 of the uterine cervix and marked expression in microinvasive cancer cells was observed. Interestingly, IDO expression in invasive cancer was confined to the cancer cells at the invasive front. Moreover, antigen‐presenting cells (APC) at the invasive front in primary and metastatic lesions were also expressing IDO. Stromal Foxp3+ Treg cells appeared in CIN‐3 and increased in microinvasive and invasive cancer. Intraepithelial Foxp3+ Treg cells were restricted within microinvasive and invasive cancer. No significant differences in the proportion of Foxp3+/CD4+ in the stroma or epithelium, or between non‐metastatic and metastatic invasive cancers, were observed in primary lesions of cervical cancer, while there was a significant increase (P < 0.005) in the proportion of Foxp3+/CD4+ in metastatic lymph nodes compared with non‐metastatic lymph nodes. Some of the Foxp3+ Treg cells in metastatic lymph nodes contacted the IDO+ APC. IDO expression at the invasive front of cancer cells and APC, and the localization of Foxp3+ Treg cells in front of cancer tissues, may create a network between IDO and Treg for the induction of immune escape. (Cancer Sci 2007; 98: 874–881)
Uterine cervical cancer is considered to be an important immunogenic tumor because human papillomavirus (HPV) causes multistep carcinogenesis (dysplasia–carcinoma in situ–invasive cancer–metastatic cancer) in normal cervical cells. HPV‐induced carcinogenesis allows cervical cancer cells to escape immune surveillance, and to achieve the peripheral tolerance of cancer cells.
Immune escape is a crucial feature of cancer progression.( 1 , 2 ) However, the mechanisms by which tolerance is created are still largely unknown. Recent studies suggest that one mechanism contributing to this phenomenon could be tryptophan catabolism, carried out by the immunoregulatory enzyme, indoleamine 2,3‐dioxygenase (IDO).( 3 , 4 , 5 ) IDO is a catalyzing enzyme of tryptophan along the kynurenine pathway.( 6 ) The activity of IDO in the mouse placenta has an important role in preventing the rejection of allogenic fetuses.( 7 ) IDO seems to block the proliferation of alloreactive T lymphocytes by the local depletion of tryptophan. T lymphocytes are extremely sensitive to tryptophan shortage, which causes their arrest in the G1 phase of the cell cycle.( 8 ) These observations introduced the concept that IDO expression could suppress immune responses locally by blocking T cells and natural killer (NK) cells.( 9 ) Moreover, most human tumors also constitutively express IDO, the expression of which in cervical cancer has also been reported.( 3 , 10 )
Recently, an additional cell population with immunosuppressive activities has been implicated in the induction of T‐cell tolerance. CD4+CD25+ Treg cells, which constitute 5–10% of CD4+ peripheral T cells, play an important role in the regulation of immune reactivity against self‐antigens and non‐self‐antigens.( 11 , 12 , 13 ) Treg cells proliferate extensively in response to dendritic cells (DC), processing protein antigens in the steady state or after maturation in vivo in lymph nodes.( 14 ) IDO+ DC efficiently suppressed all T‐cell responses to a particular antigen, despite the fact that the same antigen was presented by many other IDO− antigen‐presenting cells (APC).( 15 , 16 ) IDO+ cells might promote Treg cells development in the tumor‐draining lymph node.( 12 , 17 ) Little is known about the natural signals and APC responsible for inducing and maintaining Treg cells in the host‐bearing tumor cells. Furthermore, little is known about the localization of Treg cells during the progression of cancer,( 14 , 18 , 19 ) because immunostaining of a specific marker for Treg, Foxp3, is very difficult to perform in paraffin‐embedded samples. We recently established the process of immunostaining for Foxp3 in paraffin‐embedded tissues.( 20 ) The localization of IDO and Foxp3+ Treg cells in cancer and other diseases has not been reported yet. In the present study, we investigated the idea that the expression pattern of IDO and Foxp3+ Treg cells in multistep carcinogenesis (dysplasia–carcinoma in situ–invasive cancer–metastatic cancer) of cervical cancer may be involved in the control of the local immune response against the invasion of and metastasis to the draining lymph nodes of cervical cancer.
We found that the IDO expression of cancer cells and the recruitment of Foxp3+ Treg cells were detected in cervical intraepithelial neoplasia (CIN)‐3 and were clearly detected in the invasive front of cervical cancer. Particularly, the frequency of Foxp3+ Treg cells increased in metastatic lymph nodes compared with tumor‐free satellite lymph nodes. These Foxp3+ Treg cells in metastatic lymph nodes displayed a communication with IDO+ APC in a cell‐contact‐dependent manner. Our observation suggests both Treg cells and IDO expression in the invasive front of cancer might be a very attractive mechanism of tolerance to cervical cancer and provides evidence that the recruitment of Foxp3+ Treg cells and the IDO expression of cancer cells may be associated with the invasion and metastasis of cervical cancer.
Materials and Methods
Tissues. We studied 24 patients with normal uterine cervix and benign disease (uterine myoma and adenomyosis), 13 patients with CIN‐1–2, 31 patients with CIN‐3 in the uterine cervix, 10 patients with microinvasive uterine cervical cancer and 18 patients with invasive uterine cervical cancer and their lymph nodes. Individuals gave written, informed consent. Specimens were collected from the patients operated on at the Toyama University Hospital from 1999 to 2005. Eighteen patients were clinically diagnosed as having invasive cervical cancer stage Ib1–IIIb and were treated with radical hysterectomy. Eight of 18 patients had lymph node metastasis.
Immunohistochemistry. Samples were fixed in 10% formalin and embedded in paraffin. Sections (4 µm) were deparaffined in xylene and rehydrated. Antigens of sections were retrieved by autoclaving in 0.01 M citrate (pH 6.0) at 121°C for 15 min. Endogenous peroxidase was blocked with 3% H2O2 for 5 min and non‐specific staining was prevented by soaking in 5% bovine serum albumin (BSA; Nacalai Tesque, Japan). Sections were incubated overnight at 4°C with either purified IDO specific mouse monoclonal antibodies (IgG1),( 21 ) or normal mouse IgG (Vector Laboratories, Burlingame, CA, USA) as a negative control, and stained using an Envision system (DakoCytomation, Kyoto, Japan) and diaminobenzidine (Sigma, St Louis, Missouri, USA). For two‐color immunofluorescent staining, mouse monoclonal antibody (IgG3) to CD68 (PGM1, DakoCytomation), rabbit antibody to protein S100 (DakoCytomation) was used as the marker of macrophages and dendritic cells.( 22 ) IDO was detected using goat antimouse IgG1‐specific antibody conjugated to Alexa‐488 (Molecular Probes, Eugene, OR, USA), CD68 was detected using goat antimouse IgG3‐specific antibody conjugated to Alexa‐594 (Molecular Probes), S100 was detected using goat antirabbit IgG‐specific antibody conjugated to Alexa‐568 (Molecular Probes), and nuclei were counterstained with 4′,6‐diamidine‐2′‐phenylindole dihydrochloride (DAPI) (Vector Laboratories, Burlingame, CA, USA). Fluorescence microscopy analysis was performed on a PROVIS AX 80 (Olympus, Japan).
For Foxp3 and CD25 staining, antigens were retrieved by autoclaving in 0.01 M citrate (pH 6.0) at 121°C for 15 min and cooling down to 70°C gradually in the autoclave. After that, tissue samples were cooled down to 37°C at room temperature. This procedure is very important for immunostaining for Foxp3. For CD3, CD4 and CD8 staining, specimens were immersed in 0.01 M ethylene diamine tetra‐acetic acid (EDTA) and cooked in a pressure cooker and irradiated with standard microwave equipment (maximum 500 W; Sharp, Tokyo, Japan) for 15 min.( 23 ) Primary antibodies were diluted with 5% bovine serum albumin (BSA, Nacalai Tesque, Japan), goat polyclonal antibody to Foxp3 (1:100 dilution; Abcam, Cambridge, UK), mouse monoclonal antibody to human CD3 (1:100; Novocastra, Tyne, UK), mouse monoclonal antibody to human CD4 (1:10; Novocastra), mouse monoclonal antibody to human CD8 (1:100; DakoCytomation), mouse monoclonal antibody to human CD25 (1:100; Novocastra). Endogenous peroxidase was blocked with 3% H2O2 for 5 min and non‐specific staining was prevented by soaking in 5% BSA. Sections were irradiated intermittently (4 s on and 3 s off) using specialized microwave equipment (MI‐33, Azumaya, Tokyo, Japan) for 15 min and then incubated overnight at 4°C with primary antibodies. This intermittent microwave irradiation enhanced immunostaining for Foxp3 in the nucleus. Immunohistochemistry was performed using the Envision system (DakoCytomation) and diaminobenzidine (DAB; Sigma). We also used intermittent microwave irradiation during incubation with the second antibody for 15 min and immersion in DAB for 5–8 min.
For two color immunofluorescent staining, Foxp3 was detected with donkey antigoat IgG specific antibody conjugated to Alexa‐568 (Molecular Probes), mouse antibodies were detected with donkey antimouse IgG specific antibody conjugated to Alexa‐488 (Molecular Probes), and nuclei were counterstained with DAPI (Vector Laboratories, Burlingame, CA, USA) Fluorescence microscopy analysis was performed on a PROVIS AX 80 (Olympus, Tokyo, Japan).
Statistical analysis. The number of Foxp3+ cells, CD3+ cells and CD8+ cells were counted in 10–20 high‐power fields (HPF; ×400), and the average number of cells in each HPF was calculated. CD4+ cells were calculated as CD8+ cells minus CD3+ cells. Foxp3+ cells and Foxp3+ cells/CD4+ cells were analyzed using the Mann–Whitney U‐test and a paired Student's t‐test (using StatView ver.5.0).
Results
IDO expression in the development of cervical cancer. Cervical cancer develops after infection by HPV with multistep carcinogenesis (dysplasia–carcinoma in situ–invasive cancer–metastatic cancer) in normal cervical cells. IDO expression in normal–CIN 1, CIN‐2–3, microinvasive cancer and invasive cervical cancer were analyzed using immunohistochemistry (Fig. 1, Table 1). The expression of IDO was not detected in the epithelial cells of normal cervix–CIN 1 (Fig. 1i). IDO expression was detected in only a focal spot area (focal) of the dysplastic cells in CIN 2‐3 (Fig. 1j). In the microinvasive cancer of the cervix, IDO staining was clearly detected in the whole invasive area (whole) of the invasive front (Fig. 1k). In invasive cancer, IDO staining was not detected in the whole area, but was detected only at the invasive front of the cancer (Fig. 1l). All the invasive cancers 100% (17/17 cases) expressed IDO at the invasive front, 50% (4/8 cases) of the microinvasive cancer cases expressed it in the whole invasive area and 50% (4/8 cases) of the microinvasive cancer cases expressed IDO in the focal spot area of the invasive area. In 33.3% (7/21 cases) of cases of CIN‐2–3 of the cervix, IDO was expressed only in the focal spot area. No expression of IDO was detected in the normal–CIN‐1 cases (Table 1).
Figure 1.
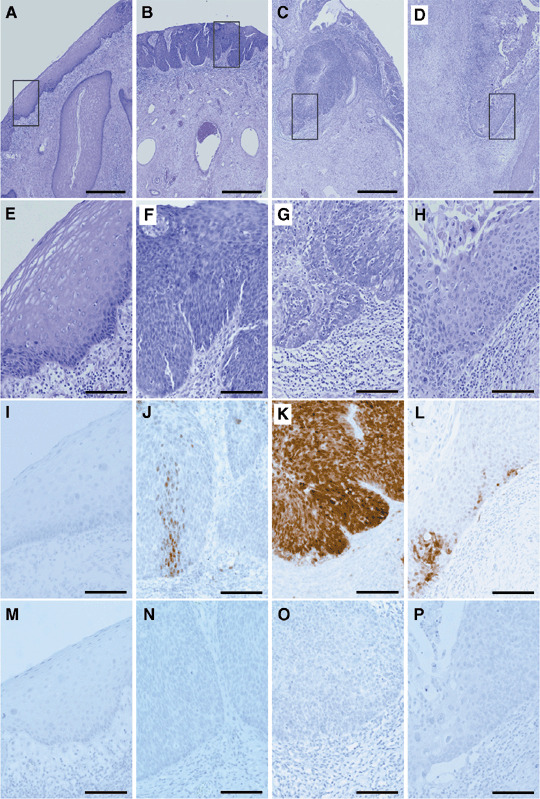
Indoleamine 2,3‐dioxygenase (IDO) expression in development of cervical cancer. (A–H) are H&E stains, (I–L) are IDO stains and (M–P) are normal mouse IgG stains as the control. (A,E,I,M) Epithelial lesions of the normal cervix–cervical intraepithelial neoplasia (CIN)‐1. (B,F,J,N) Epithelial lesions of CIN‐2–3. (C,G,K,O) Microinvasive cancer of the cervix. (D,H,L,P) Invasive cancer of the cervix. (A–D) Bar = 500 µm. (E–P) Bar = 100 µm. (J) The pattern of focal staining of IDO in CIN‐3. (K) The pattern of whole staining of the invasive area of IDO in microinvasive cancer. (L) The pattern of invasive front staining of IDO in the invasive cancer.
Table 1.
Analysis of the IDO expression pattern in normal–CIN‐1, CIN‐2–3, microinvasive cancer and invasive cancer
| Negative | Focal | Whole | Front | (Total) | |
|---|---|---|---|---|---|
| Normal–CIN‐1 | 19 | 0 | 0 | 0 | 19 |
| CIN‐2–3 | 14 | 7 | 0 | 0 | 21 |
| Microinvasive cancer | 0 | 4 | 4 | 0 | 8 |
| Invasive cancer | 0 | 0 | 0 | 17 | 17 |
100% (19/19 cases) of normal–cervical intraepithelial neoplasia (CIN)‐1 of the cervix showed no expression (negative) of indoleamine 2,3‐dioxygenase (IDO). 33.3% (7/21 cases) of CIN‐2–3 of the cervix expressed IDO only in the focal spot area (focal). 50% (4/8 cases) of microinvasive cancer expressed IDO in the focal spot area (focal) of the invasive area as CIN‐2–3 and 50% (4/8 cases) of microinvasive cancer expressed IDO in the whole invasive area (whole). 100% (17/17 cases) of invasive cancers expressed IDO at the invasive front (front).
IDO expression of APC in the primary and metastatic lymph node. Mononuclear cells (MNC) expressing IDO were recruited at the front of the invasive cancer of the primary lesion (Fig. 2b) and metastatic lymph node (Fig. 2g). MNC in the invasive front area of the primary lesion expressed CD68 (Fig. 2e) and IDO (Fig. 2d), and some of these cells were positive for both, indicating that IDO‐expressing cells are APC (Fig. 2c, white arrow head). These cells were CD68+ cells (Fig. 2e), but not S100 cells (data not shown) showing macrophages. MNC in the metastatic area of the lymph node expressed S100,( 22 ) (Fig. 2j) and IDO (Fig. 2i), and they have dendrons, suggesting that both positive cells are IDO‐expressing DC (Fig. 2h, white arrow head).
Figure 2.
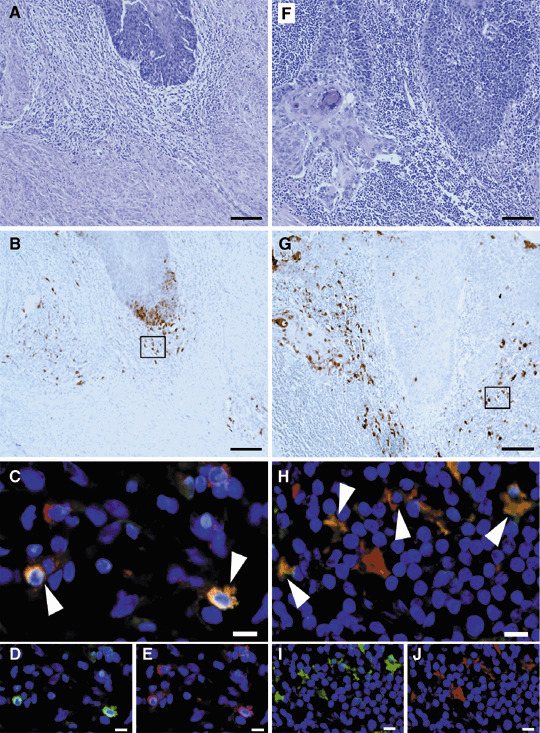
Indoleamine 2,3‐dioxygenase (IDO) expression of antigen‐presenting cells (APC) in the primary and metastatic lymph nodes of invasive cancer. (A–E) Primary lesions of invasive cancer. (F–J) metastatic lymph nodes. (A,F) H&E stains and (B,G) indoleamine 2,3‐dioxygenase (IDO) stains. (C–E) The two‐color immunofluorescent stain of IDO and CD68. (D) IDO stains, (E) CD68 stains and (C) double stains of IDO and CD68, which indicate the part of the macrophage that expressed IDO in the invasive front area of the primary lesion. (H–J) The two‐color immunofluorescent stain of IDO and S100. (I) IDO stains, (J) S100 and (H) double stain of IDO and S100, which indicate the part of the dendritic cells that expressed IDO in the metastatic lymph node. (A,B,F,G) Bar = 100 µm. (C–E,H–J) Bar = 10 µm.
Two‐color immunofluorescent staining for Foxp3 and CD3, CD4, CD8 and CD25 in the metastatic lymph nodes of cervical cancer patients. The surface phenotypes of human CD4+CD25+ regulatory T cells have been reported to be CD3+CD4+CD8−CD25bright cells.( 24 ) A subset of CD4+CD25bright T cells exhibit a strong immunoregulatory function, although the CD4+CD25low cells have no ability for immunoregulation in humans. The most specific and reliable marker for CD4+CD25+ Treg cells is the transcription factor, Foxp3.( 25 , 26 ) Immunostaining for Foxp3 is useful for detecting CD4+CD25bright Treg cells in various tissues; however, only a few reports presenting the clear immunohistochemistry of Foxp3 in mice( 25 ) and humans( 19 , 27 ) have been published. We have also successfully achieved immunostaining in the metastatic area of cervical cancer in lymph nodes for Foxp3 using the two‐color immunofluorescent staining method. Foxp3 was localized in the nucleus (red color nuclear staining) (Fig. 3), and some CD3+ cells (Fig. 3a) and some CD4+ cells (Fig. 3c) positively expressed Foxp3, but CD8+ cells did not express Foxp3 in the nucleus (Fig. 3b). Interestingly, CD25 strongly positive cells (Fig. 3d) expressed Foxp3 in the nucleus and CD25 weakly positive cells did not express Foxp3 in the nucleus, suggesting that nuclear Foxp3 was expressed in CD3+CD4+CD25bright cells (Fig. 3a–d). These findings are completely consistent with the characterization of human CD4+CD25bright Treg cells using the flow cytometry method that has been described previously.( 24 )
Figure 3.
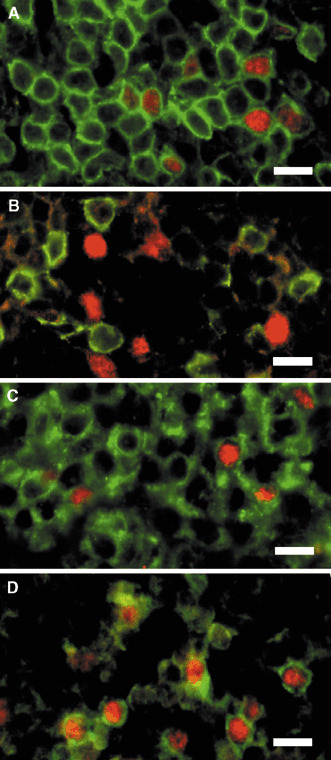
Two‐color immunofluorescent staining for Foxp3 and CD3, CD4, CD8 and CD25 in the metastatic lymph nodes of cervical cancer patients. (A–D) Foxp3 was localized in the nucleus (red color nuclear staining). (A) The two‐color stain of Foxp3 and CD3. (B) Foxp3 and CD8 stain. (C) Foxp3 and CD4 stains. (D) Foxp3 and CD25 stains, which demonstrated that CD25 strongly positive cells expressed Foxp3 in the nucleus. (A,C,D) Nuclear Foxp3 was expressed in CD3+CD4+CD25bright cells. (A–D) Bar = 10 µm.
Localization of Foxp3+ cells, CD3+ cells and CD8+ cells in the invasive front area and metastatic lymph nodes of cervical cancer patients. Significant quantities of CD3‐positive cells were detected in the invasive front area of the cervical cancer in the primary lesion (Fig. 4c,g) and the surrounding metastatic cancer mass in the lymph node, showing that the metastatic tumor elicits lymphocyte infiltrations (Fig. 4k,o). The CD8+ cells were detected in the invasive front area of cervical cancer in the primary lesion (Fig. 4d,h) and the surrounding metastatic cancer mass in the lymph node (Fig. 4l,p). These findings suggest that cervical cancer cells are immunogenic to provoke nascent host responses. The Foxp3+ cells were detected in the invasive front area of the cervical cancer in the primary lesion (Fig. 4b,f) and the surrounding metastatic cancer mass in the lymph nodes (Fig. 4j,n). The Foxp3+ cells were detected in the stroma close to invasive cancer (Fig. 4f,n, arrows) and the front area of the intratumoral tissue (Fig. 4f,n, open arrow heads). No Foxp3+ cells were detected in the area without invasive cancer.
Figure 4.
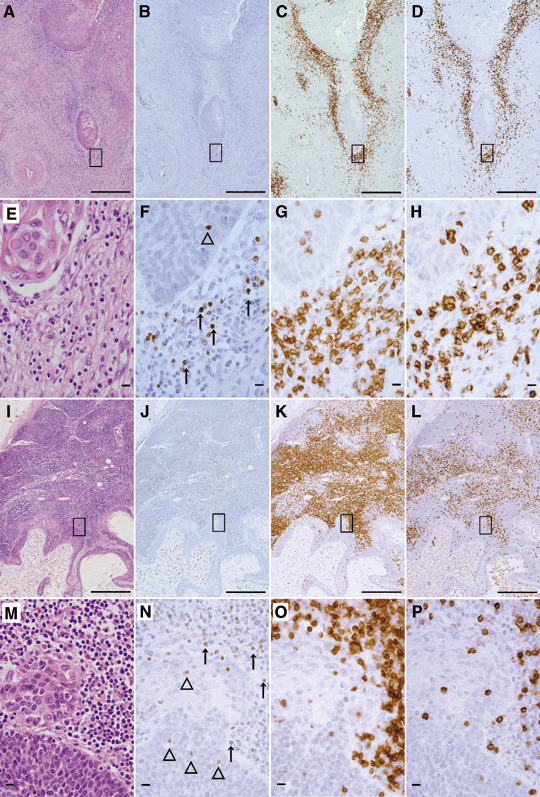
Localization of Foxp3+ cells, CD3+ cells and CD8+ cells at the invasive front area of primary lesions and metastatic lymph nodes of cervical cancer patients. (A–H) Primary lesions of invasive cancer. (I–P) Metastatic lymph nodes. (A,E,I,M) H&E stains. (B,F,J,N) Foxp3 stain. (C,J,K,O) CD3 stain. (D,H,L,P) CD8 stain. (F,N) Open arrow head indicates the intratumoral Foxp3+ cells, and the arrow indicates the stromal Foxp3+ cells. (A–D,I–L) Bar = 500 µm. (E–H,M–P) Bar = 10 µm.
The number of Foxp3+ cells and the ratio of Foxp3+/CD4 at the uterine cervix of normal subjects, CIN cases and cervical cancer cases. We examined the relation between cervical cancer progression and the localization of Treg cells. The Foxp3+, CD3+ and CD8+ cells were detected using immunohistochemistry in the normal cervix of benign diseases, CIN‐1–2, CIN‐3, microinvasive and invasive cervical cancer primary lesions with metastatic and non‐metastatic lymph nodes. In the stroma, the Foxp3+ cells were detected as 0.02 cells/HPF as the mean in each normal cervical lesion, 0.43 cells/HPF as the mean in CIN‐1–2, 2.29 cells/HPF as the mean in CIN‐3, 10.54 cells/HPF as the mean in microinvasive cancer and 8.54 cells/HPF as the mean in invasive cancer using an immunostaining method (Fig. 5). Foxp3+ Treg cells were increased in invasive cancer, particularly during invasion into the basement membrane. However, the Foxp3+ cells in CIN‐3 were also detected significantly more than normal and CIN‐1–2 (P < 0.0001). Foxp3+ cells in microinvasive and invasive cancer were detected apparently more than normal, CIN‐1–2 and CIN‐3 (P < 0.0001). In contrast, no significant recruitment of Foxp3+ cells in CIN‐1–2 was detected when compared with the normal cervix (P = 0.2521); nor was a significant increase in invasive cancer detected when compared with microinvasive cancer (P = 0.5331).
Figure 5.
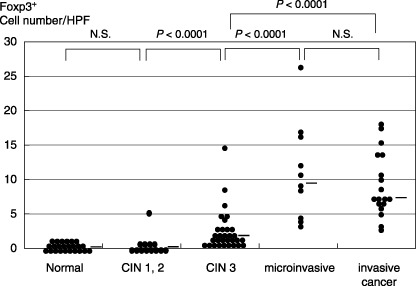
The number of Foxp3+ cells at the uterine cervix of normal subjects, cervical intraepithelial neoplasia (CIN) cases and cervical cancer cases. The relation between cervical cancer progression and the localization of Foxp3+ cells in the stroma and intratumoral area is shown. The Foxp3+ cells in CIN‐3 were also detected to be significantly more numerous than in CIN‐1–2 (P < 0.0001). Foxp3+ cells in microinvasive and invasive cancer were detected to be apparently more than in CIN‐3 (P < 0.0001). No significant recruitment of Foxp3+ cells in CIN‐1–2 was detected when compared with the normal cervix (NS, not significant: P = 0.2521); nor was a significant increase in invasive cancer detected when compared with microinvasive cancer (NS: P = 0.5331). The data were analyzed using the Mann–Whitney U‐test. The bar indicates the median.
Next, the ratio of the Foxp3+ cells/CD4+ cells was detected as 0.13, 0.62, 4.97, 13.15 and 16.12% as the mean in each normal cervical lesion, CIN‐1–2, CIN‐3, microinvasive cancer and invasive cancer (figure not shown).
The ratio of Foxp3+/CD4 in the primary and lymph node lesions of metastatic and non‐metastatic cervical cancer cases. The proportion of Foxp3+ cells that were detected using the immunostaining method was a mean of 14.13% in the CD4+ cells in the primary cervical cancer lesion with non‐metastatic lymph nodes (Fig. 6a). In contrast, the primary cervical cancer lesion with metastatic lymph node showed a mean of 18.61% of Foxp3+ cells/CD4+cells. The number of Foxp3+ cells and the ratio of the Foxp3+/CD4+ cells in the primary lesion showed no significant difference between the patients with lymph node metastasis‐positivity and ‐negativity (P = 0.3284; Fig. 6a).
Figure 6.
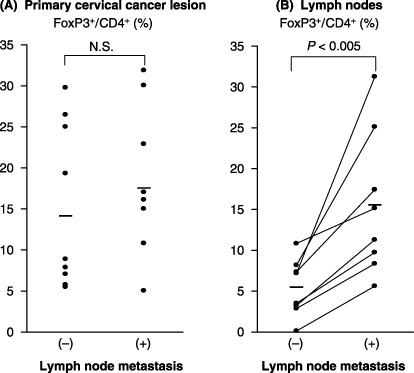
The ratio of Foxp3+/CD4 in primary lesions and lymph nodes of metastatic and non‐metastatic cervical cancer cases. (A) The proportion of Foxp3+ cells in the CD4+ cells was in the primary lesion both of non‐metastatic cervical cancer and of the metastatic cervical cancer. The ratio of the Foxp3+/CD4+ cells in the primary lesion showed no significant difference between the patients with lymph node metastasis‐positivity and ‐negativity (NS, not significant: P = 0.3284) when analyzed using Mann–Whitney U‐test. The bar indicates the median. (B) A comparison of the proportion of Foxp3+ cells in the CD4+ cells between the metastatic lymph node and non‐metastatic lymph node in the same patients. The ratio of Foxp3+ cells/CD4+ cells in the metastatic lymph node was significantly higher than in the non‐metastatic lymph node (P < 0.005) when analyzed using paired Student's t‐test. The bar indicates the mean.
Next, we made a comparison of Foxp3+ cells between metastatic lymph nodes and non‐metastatic lymph nodes in the same patients. The ratio of Foxp3+ cells/CD4+ cells was detected to be a mean of 15.47% in the metastatic lymph nodes, significantly higher than a mean of 5.37% in the non‐metastatic lymph nodes (P < 0.005; Fig. 6b).
Comparison of the number of intratumoral Foxp3+ cells. We compared the number of intratumoral Foxp3+ cells that were detected as a mean of 0.33 cells/HPF in microinvasive cancer and as a mean of 1.01 cells/HPF in invasive cancer. No intratumoral Foxp3+ cells were detected in the group with CIN‐3 of the cervix. The number of intratumoral Foxp3+ cells in the primary lesion with lymph node metastasis‐positivity showed a mean of 1.26 cells/HPF, and those with lymph node metastasis‐negativity showed a mean of 0.70 cells/HPF, suggesting no significant difference between the patients (figure not shown).
Two‐color immunofluorescent staining of Foxp3 and IDO. In the metastatic area of cervical cancer in lymph nodes, the Foxp3+ cells and IDO+ cells were detected using the two‐color immunofluorescent staining method. Interestingly, one of the Foxp3+ Treg cells was in contact with IDO+ APC in the metastatic lymph node (Fig. 7). IDO expressing APC were identified as dendritic cells according to the morphological findings and S100 expression.( 22 ) These interactions might demonstrate evidence that communication between IDO+APC and Treg cell might induce tolerance to the cancer cells specific antigens.
Figure 7.
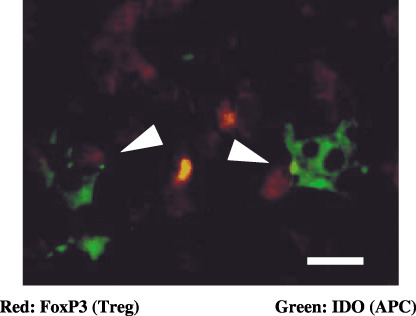
Two‐color immunofluorescent staining of Foxp3 and indoleamine 2,3‐dioxygenase (IDO) in the metastatic lymph node. The white arrow head indicates that the Foxp3+ T‐reg cells (red nuclear staining) were in contact with IDO+ antigen‐presenting cells (APC; green cytoplasmic staining) in the metastatic lymph node. IDO expressing APC were identified to be dendritic cells by their morphological findings and S100 expression (as shown in Fig. 2H–J). Bar = 10 µm.
Discussion
Tumors create an abnormal state of tolerance toward themselves and their antigens. One mechanism that might contribute to this tolerance is the immunoregulatory enzyme, IDO.( 3 , 4 , 5 , 6 , 7 , 8 , 9 ) IDO‐expressing APC are found in tumor‐draining lymph nodes, where they can create a tolerogenic microenvironment.( 4 , 15 , 28 ) IDO can also be expressed within the tumor itself, by tumor cells or host stromal cells, where it can inhibit the effector phase of the immune response. Finally, emerging evidence suggests that IDO might also constitute a significant counter‐regulatory mechanism, induced by clinically relevant pro‐inflammatory signals, such as interferon (IFN)‐γ, IFN‐α, CpG oligodeoxynucleotides, and 4‐1BB ligation.( 29 )
Tumors also create another mechanism by which to escape immune surveillance, and that could lead to malignant progression. CD4+CD25+ Treg cells play pivotal roles in the host response to tumors.( 11 , 12 , 18 , 19 , 27 , 30 ) In murine tumor models, the depletion of CD4+CD25+ Treg promotes tumor rejection or the inhibition of tumor growth. In human cancer patients, CD4+CD25+ Treg cells are increased in tumors, and increased CD4+CD25+ Treg cells are associated with reduced survival,( 19 , 27 , 30 ) suggesting that CD4+CD25+ Treg cells suppress antitumor immune response. Indeed, vaccine‐mediated antitumor immunity in cancer patients enhances after the depletion of CD4+CD25+ Treg cells in humans.( 31 )
In the present study, we first showed that both the invading cervical cancer cells, particularly in microinvasive cancer and APC at the invasive front, expressed IDO, and that the Foxp3+ Treg cells are recruited to the invasive front of primary lesions of cervical cancer and metastatic lymph nodes. We also demonstrated that not only in invasive and metastatic cancer, but also in some CIN‐3 cases, IDO was expressed focally, and stromal Foxp3+ Treg cells in CIN‐3 patients were significantly increased compared with those from CIN‐1–2 individuals, which retained regulatory T cells to an extent similar to that of normal individuals. These results are also new findings. Our results gave us one idea, that a part of carcinoma in situ (CIN‐3) has already acquired the ability of immunoregulation, and another idea that the cancer cells themselves in carcinoma in situ have begun the expression of chemokines that recruit the Foxp3+ Treg cells. The expression of CCL22 (MDC) in tumor cells and microenvironment macrophages mediates the trafficking of Treg cells to the tumor in ovarian cancer.( 30 ) Histological staining has demonstrated the expression of CCL22 in five of nine human bladder tumor specimens.( 32 ) However, our immunostaining analysis showed that cervical cancer cells did not express CCL22, but macrophages at the invasion front did (data not shown). However, there was no correlation between the numbers of CCL22‐positive macrophages and the numbers of Foxp3+ Treg cells in our study. Further studies are needed to clarify this mechanism.
It has been reported that recombinant CTLA4‐immunogloblin fusion protein and native CTLA4 on Treg were ligands for CD80/CD86 on DC which induced IDO expression and suppressed adaptive T‐cell‐mediated immunity.( 16 , 33 , 34 ) We have reported that the Foxp3+ Treg cells were in contact with IDO+ APC in the metastatic lymph nodes according to an immunohistochemical study. This interaction between the Treg cells and APC means that APC might induce tumor‐specific Treg selective accumulation in the peripheral metastatic lymph nodes. CD4+CD25+ Treg cells constitutively express cytotoxic T‐lymphocyte‐associated antigen 4 (CTLA‐4). CD4+CD25+ Treg cells induce IDO expression in dendritic cells through a CTLA‐4‐dependent mechanism.( 33 , 35 ) We have showed that Foxp3+ Treg cells contacted the IDO ± DC in metastatic lymph nodes. Foxp3+ Treg cells might enhance IDO expression in DC via a CTLA‐4 and B7 complex pathway. As another mechanism, mature antigen‐bearing DC are capable of stimulating and expanding CD4+CD25+ Treg cells.( 12 , 17 ) This co‐operation between CD4+CD25+ Treg cells and IDO‐expressing DC may induce immune tolerance in cancer patients.
Indeed, IDO significantly contributes to disease progression and overall survival in patients with colorectal cancer and ovarian cancer.( 36 , 37 ) A high number of Foxp3+ Treg cells was also described to be associated with poor survival in ovarian cancer.( 27 , 30 ) A high CD8+/Treg ratio has been associated with a favorable prognosis in ovarian cancer.( 19 ) However, opposite results have also been reported.( 38 , 39 , 40 ) Our results showed that in cervical cancer, the number of Foxp3+ Treg cells and the level of IDO expression in local tumor sites were not correlated with the prognosis of patients (data not shown), although we detected the accumulation of Foxp3+ Treg cells and IDO+ APC, and the expression of IDO in cancer cells at the invasive front. In Hodgkin's lymphoma, increased Treg cells are associated with a good prognosis,( 38 ) and there is no prognostic value of tumor‐infiltrating CD4+CD25+ Treg cells in head and neck cancers.( 39 ) Various factors can explain the different effect of the presence of CD4+CD25+ Treg cells and IDO‐expressing DC in the clinical course.
In conclusion, IDO expression in tumor cells appeared in CIN‐3, and the number of CD4+CD25+ Treg cells increased in CIN‐3 cases. A focal lesion of carcinoma in situ of the cervix may begin to influence the host immune system. Marked staining of IDO in microinvasive cancer cells suggests that tumor cells acquire an immune escape mechanism in the process of carcinogenesis. However, IDO expression is limited to the invasive front of invasive cancer patients. IDO‐expressing cancer cells and host APC in the area of the invasive front degrade tryptophan, and cancer cells are protected by host immune cells.
Another interesting finding is that Foxp3+ Treg cells contact IDO‐expressing DC in the draining lymph node. The cross talk between CD4+CD25+ Treg cells and IDO‐expressing DC might induce cancer antigen‐specific tolerance in cancer patients.
Acknowledgments
We thank Ms Tomiko Kuroda for her help in typing the manuscripts and for her dedicated assistance.
References
- 1. Rosenberg SA. Progress in human tumour immunology and immunotherapy. Nature 2001; 411: 380–4. [DOI] [PubMed] [Google Scholar]
- 2. Gerloni M, Zanetti M. CD4 T cells in tumor immunity. Springer Semin Immunopathol 2005; 27: 37–48. [DOI] [PubMed] [Google Scholar]
- 3. Uyttenhove C, Pilotte L, Theate I et al. Evidence for a tumoral immune resistance mechanism based on tryptophan degradation by indoleamine 2,3‐dioxygenase. Nat Med 2003; 9: 1269–74. [DOI] [PubMed] [Google Scholar]
- 4. Friberg M, Jennings R, Alsarraj M et al. Indoleamine 2,3‐dioxygenase contributes to tumor cell evasion of T cell‐mediated rejection. Int J Cancer 2002; 101: 151–5. [DOI] [PubMed] [Google Scholar]
- 5. Muller AJ, DuHadaway JB, Donover PS, Sutanto‐Ward E, Prendergast GC. Inhibition of indoleamine 2,3‐dioxygenase, an immunoregulatory target of the cancer suppression gene Bin1, potentiates cancer chemotherapy. Nat Med 2005; 11: 312–19. [DOI] [PubMed] [Google Scholar]
- 6. Mellor AL, Munn DH. IDO expression by dendritic cells: tolerance and tryptophan catabolism. Nat Rev Immunol 2004; 4: 762–74. [DOI] [PubMed] [Google Scholar]
- 7. Munn DH, Zhou M, Attwood JT et al. Prevention of allogeneic fetal rejection by tryptophan catabolism. Science 1998; 281: 1191–3. [DOI] [PubMed] [Google Scholar]
- 8. Munn DH, Shafizadeh E, Attwood JT, Bondarev I, Pashine A, Mellor AL. Inhibition of T cell proliferation by macrophage tryptophan catabolism. J Exp Med 1999; 189: 1363–72. [DOI] [PMC free article] [PubMed] [Google Scholar]
- 9. Frumento G, Rotondo R, Tonetti M, Damonte G, Benatti U, Ferrara GB. Tryptophan‐derived catabolites are responsible for inhibition of T and natural killer cell proliferation induced by indoleamine 2,3‐dioxygenase. J Exp Med 2002; 196: 459–68. [DOI] [PMC free article] [PubMed] [Google Scholar]
- 10. Sedlmayr P, Semlitsch M, Gebru G et al. Expression of indoleamine 2,3‐dioxygenase in carcinoma of human endometrium and uterine cervix. Adv Exp Med Biol 2003; 527: 91–5. [DOI] [PubMed] [Google Scholar]
- 11. Sakaguchi S, Sakaguchi N, Shimizu J et al. Immunologic tolerance maintained by CD25+CD4+ regulatory T cells: their common role in controlling autoimmunity, tumor immunity, and transplantation tolerance. Immunol Rev 2001; 182: 18–32. [DOI] [PubMed] [Google Scholar]
- 12. Wang HY, Lee DA, Peng G et al. Tumor‐specific human CD4+ regulatory T cells and their ligands: implications for immunotherapy. Immunity 2004; 20: 107–18. [DOI] [PubMed] [Google Scholar]
- 13. Karim M, Bushell AR, Wood KJ. Regulatory T cells in transplantation. Curr Opin Immunol 2002; 14: 584–91. [DOI] [PubMed] [Google Scholar]
- 14. Steinman RM, Hawiger D, Nussenzweig MC. Tolerogenic dendritic cells. Annu Rev Immunol 2003; 21: 685–711. [DOI] [PubMed] [Google Scholar]
- 15. Munn DH, Sharma MD, Hou D et al. Expression of indoleamine 2,3‐dioxygenase by plasmacytoid dendritic cells in tumor‐draining lymph nodes. J Clin Invest 2004; 114: 280–90. [DOI] [PMC free article] [PubMed] [Google Scholar]
- 16. Mellor AL, Baban B, Chandler P et al. Cutting edge: induced indoleamine 2,3 dioxygenase expression in dendritic cell subsets suppresses T cell clonal expansion. J Immunol 2003; 171: 1652–5. [DOI] [PubMed] [Google Scholar]
- 17. Yamazaki S, Iyoda T, Tarbell K et al. Direct expansion of functional CD25+CD4+ regulatory T cells by antigen‐processing dendritic cells. J Exp Med 2003; 198: 235–47. [DOI] [PMC free article] [PubMed] [Google Scholar]
- 18. Hontsu S, Yoneyama H, Ueha S et al. Visualization of naturally occurring Foxp3+ regulatory T cells in normal and tumor‐bearing mice. Int Immunopharmacol 2004; 4: 1785–93. [DOI] [PubMed] [Google Scholar]
- 19. Sato E, Olson SH, Ahn J et al. Intraepithelial CD8+ tumor‐infiltrating lymphocytes and a high CD8+/regulatory T cell ratio are associated with favorable prognosis in ovarian cancer. Proc Natl Acad Sci USA 2005; 102: 18 538–43. [DOI] [PMC free article] [PubMed] [Google Scholar]
- 20. Lan RY, Cheng C, Lian ZX et al. Liver‐targeted and peripheral blood alterations of regulatory T cells in primary biliary cirrhosis. Hepatology 2006; 43: 729–37. [DOI] [PubMed] [Google Scholar]
- 21. Takikawa O, Kuroiwa T, Yamazaki F, Kido R. Mechanism of interferon‐gamma action. Characterization of indoleamine 2,3‐dioxygenase in cultured human cells induced by interferon‐gamma and evaluation of the enzyme‐mediated tryptophan degradation in its anticellular activity. J Biol Chem 1988; 263: 2041–8. [PubMed] [Google Scholar]
- 22. Perez L, Shurin MR, Collins B, Kogan D, Tourkova IL, Shurin GV. Comparative analysis of CD1a, S‐100, CD83, and CD11c human dendritic cells in normal, premalignant, and malignant tissues. Histol Histopathol 2005; 20: 1165–72. [DOI] [PubMed] [Google Scholar]
- 23. Kumada T, Tsuneyama K, Hatta H, Ishizawa S, Takano Y. Improved 1‐h rapid immunostaining method using intermittent microwave irradiation: practicability based on 5 years application in Toyama Medical and Pharmaceutical University Hospital. Mod Pathol 2004; 17: 1141–9. [DOI] [PubMed] [Google Scholar]
- 24. Baecher‐Allan C, Brown JA, Freeman GJ, Hafler DA. CD4+CD25 high regulatory cells in human peripheral blood. J Immunol 2001; 167: 1245–53. [DOI] [PubMed] [Google Scholar]
- 25. Fontenot JD, Gavin MA, Rudensky AY. Foxp3 programs the development and function of CD4+CD25+ regulatory T cells. Nat Immunol 2003; 4: 330–6. [DOI] [PubMed] [Google Scholar]
- 26. Hori S, Nomura T, Sakaguchi S. Control of regulatory T cell development by the transcription factor Foxp3. Science 2003; 299: 1057–61. [DOI] [PubMed] [Google Scholar]
- 27. Wolf D, Wolf AM, Rumpold H et al. The expression of the regulatory T cell‐specific forkhead box transcription factor FoxP3 is associated with poor prognosis in ovarian cancer. Clin Cancer Res 2005; 11: 8326–31. [DOI] [PubMed] [Google Scholar]
- 28. Lee JR, Dalton RR, Messina JL et al. Pattern of recruitment of immunoregulatory antigen‐presenting cells in malignant melanoma. Laboratory Invest 2003; 83: 1457–66. [DOI] [PubMed] [Google Scholar]
- 29. Munn DH. Indoleamine 2,3‐dioxygenase, tumor‐induced tolerance and counter‐regulation. Curr Opin Immunol 2006; 18: 220–5. [DOI] [PubMed] [Google Scholar]
- 30. Curiel TJ, Coukos G, Zou L et al. Specific recruitment of regulatory T cells in ovarian carcinoma fosters immune privilege and predicts reduced survival. Nat Med 2004; 10: 942–9. [DOI] [PubMed] [Google Scholar]
- 31. Dannull J, Su Z, Rizzieri D et al. Enhancement of vaccine‐mediated antitumor immunity in cancer patients after depletion of regulatory T cells. J Clin Invest 2005; 115: 3623–33. [DOI] [PMC free article] [PubMed] [Google Scholar]
- 32. Yamada H, Odonnell MA, Matsumoto T, Luo Y. Interferon‐gamma up‐regulates toll‐like receptor 4 and cooperates with lipopolysaccharide to produce macrophage‐derived chemokine and interferon‐gamma inducible protein‐10 in human bladder cancer cell line RT4. J Urol 2005; 174: 1119–23. [DOI] [PubMed] [Google Scholar]
- 33. Grohmann U, Orabona C, Fallarino F et al. CTLA‐4‐Ig regulates tryptophan catabolism in vivo. Nat Immunol 2002; 3: 1097–101. [DOI] [PubMed] [Google Scholar]
- 34. Miwa N, Hayakawa S, Miyazaki S et al. IDO expression on decidual and peripheral blood dendritic cells and monocytes/macrophages after treatment with CTLA‐4 or interferon‐gamma increase in normal pregnancy but decrease in spontaneous abortion. Mol Hum Reprod 2005; 11: 865–70. [DOI] [PubMed] [Google Scholar]
- 35. Fallarino F, Grohmann U, Hwang KW et al. Modulation of tryptophan catabolism by regulatory T cells. Nat Immunol 2003; 4: 1206–12. [DOI] [PubMed] [Google Scholar]
- 36. Brandacher G, Perathoner A, Ladurner R et al. Prognostic value of indoleamine 2,3‐dioxygenase expression in colorectal cancer: effect on tumor‐infiltrating T cells. Clin Cancer Res 2006; 12: 1144–51. [DOI] [PubMed] [Google Scholar]
- 37. Okamoto A, Nikaido T, Ochiai K et al. Indoleamine 2,3‐dioxygenase serves as a marker of poor prognosis in gene expression profiles of serous ovarian cancer cells. Clin Cancer Res 2005; 11: 6030–9. [DOI] [PubMed] [Google Scholar]
- 38. Alvaro T, Lejeune M, Salvado MT et al. Outcome in Hodgkin's lymphoma can be predicted from the presence of accompanying cytotoxic and regulatory T cells. Clin Cancer Res 2005; 11: 1467–73. [DOI] [PubMed] [Google Scholar]
- 39. Badoual C, Hans S, Rodriguez J et al. Prognostic value of tumor‐infiltrating CD4+ T‐cell subpopulations in head and neck cancers. Clin Cancer Res 2006; 12: 465–72. [DOI] [PubMed] [Google Scholar]
- 40. Ishio T, Goto S, Tahara K, Tone S, Kawano K, Kitano S. Immunoactivative role of indoleamine 2,3‐dioxygenase in human hepatocellular carcinoma. J Gastroenterol Hepatol 2004; 19: 319–26. [DOI] [PubMed] [Google Scholar]


