Abstract
Gallbladder cancer (GBC) is a highly fatal malignancy in humans. Genetic alterations in KRAS or TP53 as well as overexpression of ERBB2 have been shown to contribute to the development of certain types of GBC. However, many cases of GBC do not harbor such genetic changes, with other transforming events awaiting discovery. We here tried to identify novel cancer‐promoting genes in GBC, with the use of a retroviral cDNA expression library. A retroviral cDNA expression library was constructed from a surgically resected clinical specimen of GBC, and was used to infect 3T3 fibroblasts in a focus formation assay. cDNA incorporated into the transformed foci was rescued by PCR. One such cDNA was found to encode free fatty acid receptor 2 (FFAR2), a G protein‐coupled receptor for short‐chain fatty acids. The oncogenic potential of FFAR2 was confirmed both in vitro with the focus formation assay and by evaluation of cell growth in soft agar as well as in vivo with a tumorigenicity assay in nude mice. The isolated FFAR2 cDNA had no sequence alterations, suggesting that upregulation of FFAR2 expression may contribute to malignant transformation. Indeed, all of quantitative RT‐PCR, in situ hybridization, and immunohistochemical analyses showed that the amount of FFAR2 mRNA and its protein product was increased in digestive tract cancer specimens. Furthermore, short‐chain fatty acids potentiated the mitogenic action of FFAR2 in 3T3 cells. Our data thus, for the first time, implicate FFAR2 in carcinogenesis of the digestive tract. (Cancer Sci 2009)
Gallbladder cancer (GBC) is a highly fatal malignancy in humans, being most prevalent in South America and Asia. In most cases, GBC is not diagnosed until it has reached an advanced stage, when the 5‐year survival rate is ∼10%.( 1 , 2 ) In the USA, ∼8000 new cases of biliary tract cancer (BTC) are diagnosed each year, with ∼4000 of the affected individuals subsequently dying of GBC.( 3 ) Several risk factors have been identified for GBC, including cholelithiasis( 4 ) and anomalous pancreaticobiliary duct junction.( 5 ) Genetic alterations in KRAS or TP53 as well as overexpression of ERBB2 have been shown to contribute to the development of certain types of GBC. However, many cases of GBC do not harbor such genetic changes, with other transforming events awaiting discovery.
The focus formation assay with 3T3 or RAT1 fibroblasts has been used extensively to screen for transforming genes in various carcinomas.( 6 ) In such screening, genomic DNA is isolated from cancer specimens and used to transfect fibroblasts, potentially resulting in the development of transformed cell foci. However, given that expression of the introduced genes is controlled by their own promoters or enhancers, oncogenes in cancer cells may exert effects in fibroblasts only when their control regions are active in these cells, which is not guaranteed.
Adequate expression of cDNA in fibroblasts can be achieved by placing them under the control of an exogenous promoter fragment. Toward this goal, we have recently established a retroviral cDNA expression library system that is sensitive enough to generate libraries with a high complexity even from small amounts of materials such as clinical specimens.( 7 , 8 , 9 ) With this system, we have successfully discovered a fusion‐type protein tyrosine kinase EML4–ALK in non‐small cell lung cancer.( 7 )
In this manuscript, we have applied this technology to a surgically resected clinical specimen of GBC, and used this library to screen for transforming genes in GBC. Unexpectedly, transforming ability has been discovered for free fatty acid receptor 2 (FFAR2, also known as GPR43), which functions as a cellular receptor for short‐chain fatty acids (SCFA).( 10 ) Further, tumor‐specific expression of FFAR2 has been proven among a panel of clinical specimens for GBC, gastric cancer, and colorectal cancer (CRC) by in situ hybridization and immunohistochemical analyses, indicating tumor‐promoting activity among digestive tract cancers.
Materials and Methods
Clinical specimens and cells lines. Resected clinical materials were obtained from individuals who underwent surgery at Jichi Medical University Hospital. Written informed consent was obtained from each subject according to the protocols approved by the ethics committees of Jichi Medical University. Mouse 3T3 and BOSC23 cell lines were obtained from American Type Culture Collection (Manassas, VA, USA), and maintained in Dulbecco’s modified Eagle medium/F12 (DMEM/F12; Invitrogen, Carlsbad, CA, USA) containing 10% fetal bovine serum (Invitrogen) and 2 mm l‐glutamine.
Construction of retroviral cDNA expression library. The retroviral cDNA library was constructed as described previously.( 7 , 8 , 9 , 11 ) Briefly, first‐strand cDNA was synthesized from the RNA with the use of PowerScript reverse transcriptase, the SMART IIA oligonucleotide, and CDS primer IIA (all from Clontech, Mountain View, CA, USA). The resulting cDNA was then amplified by PCR with 5′‐PCR primer IIA (Clontech) and PrimeSTAR HS DNA polymerase (Takara Bio, Otsu, Shiga, Japan) for 17 cycles of 98°C for 10 s and 68°C for 6 min. The PCR products were ligated to a BstXI adapter (Invitrogen) and then incorporated into the pMXS retroviral plasmid (kindly provided by T. Kitamura of the Institute of Medical Science, University of Tokyo).
Recombinant retroviruses were produced by introduction of the plasmid library into the packaging cell line BOSC23( 12 ) and were used to infect 3T3 cells in the presence of polybrene (4 μg/mL; Sigma, St Louis, MO, USA). The cells were cultured for 2 weeks, after which transformed foci were isolated, expanded, and subjected to extraction of genomic DNA. Insert cDNA was recovered from the genomic DNA by PCR with 5′‐PCR primer IIA and PrimeSTAR HS DNA polymerase. Amplified products were then ligated to the plasmid pT7Blue‐2 (Novagen, Madison, WI, USA) and subjected to nucleotide sequencing.
Transformation assay. For a focus formation assay, recombinant retrovirus was used to infect 3T3 cells for 48 h. The culture medium of 3T3 cells was then changed to DMEM/F12 supplemented with 5% calf serum and 2 mm l‐glutamine, and incubated for 2 weeks. To examine anchorage‐independent growth in soft agar, 3T3 cells infected with retrovirus were resuspended in culture medium containing 0.4% agar (SeaPlaque GTG agarose; Cambrex, East Rutherford, NJ, USA), and seeded onto a base layer of complete medium containing 0.5% agar. Cell growth was assessed after 3 weeks of incubation.
For an in vivo tumorigenicity assay, 3T3 cells (2 × 10⁶) infected with the retrovirus expressing FFAR2 were resuspended in 500 μL PBS, and injected into each shoulder of nu/nu BALBc mice (6 weeks old). Tumor formation was assessed after 3 weeks.
Quantitation with real‐time RT‐PCR. Oligo(dT)‐primed cDNA was synthesized from the clinical specimens with PowerScript reverse transcriptase, and subjected to quantitative PCR with a QuantiTect SYBR Green PCR kit (Qiagen, Valencia, CA, USA) and an amplification protocol consisting of incubations at 94°C for 15 s, 60°C for 30 s, and 72°C for 60 s. Incorporation of the SYBR Green dye into PCR products was monitored in real time with an ABI PRISM 7900HT sequence detection system (Applied Biosystems, Foster City, CA, USA), thereby allowing determination of the threshold cycle (C T) at which exponential amplification of products begins. The C T values for cDNA corresponding to the β‐actin gene (ACTB) and FFAR2 were used to calculate the abundance of the latter mRNA relative to that of the former. The oligonucleotide primers used for PCR were 5′‐CCATCATGAAGTGTGACGTGG‐3′ and 5′‐GTCCGCCTAGAAGCATT‐TGCG‐3′ for ACTB and 5′‐CACTCAACGCCAGTCTGGAC‐3′ and 5′‐TGGCATCCCTTCTCCTTGAC‐3′ for FFAR2.
In situ hybridization with sense or antisense riboprobes corresponding to the 3′ region (nucleotides 867–1229) of the FFAR2 cDNA isolated in this study was conducted as described previously.( 13 )
Immunohistochemistry. Human tissues were fixed in 4% formaldehyde in PBS at room temperature overnight, embedded in paraffin, and sectioned at a thickness of 3 μm. Sections were mounted on glass slides, deparaffinized through three changes of xylene for 4 min each, and rehydrated in distilled water through a series of graded alcohols. For histological evaluation, sections were stained with hematoxylin–eosin solutions. For immunohistochemical experiments, antigenicity was enhanced by boiling the sections in 10 mm citrate buffer (pH 6.0) in a microwave oven for 15 min, and the endogenous peroxidase activity was blocked by incubation in methanol containing 0.3% H2O2 for 30 min. After two washes with PBS containing 1% Triton X‐100, the sections were preincubated with the blocking buffer (#X0909; Dako, Glostrup, Denmark) in a humidified chamber for 20 min at room temperature, and then incubated with anti‐FFAR2 antibody (SP4226P; Acris Antibodies, Schillerstaβe, Herford, Germany) at 4°C overnight. Next, the sections were washed in PBS and incubated with horseradish peroxidase (HRP)‐labeled polymers conjugated to goat antirabbit immunoglobulin (#K4003; Dako) at 37°C for 30 min. Color development was carried out by incubating the sections with 3,3‐diaminobenzidine tetrahydrochloride (Wako Pure Chemical Industries, Osaka, Japan) as a chromogenic substrate. Finally, the sections were lightly counterstained with hematoxylin, mounted, and viewed under a light microscope.
Cell proliferation assay. Mouse 3T3 cells expressing FFAR2 or not expressing FFAR2 were seeded into 96‐well plates at a concentration of 4 × 10³ cells/well, and incubated for 24 h with DMEM‐F12 medium and 1% charcoal‐treated fetal bovine serum (Invitrogen). Cells were further cultured for 48 h with 100 mm sodium acetate or 1 mm sodium butyrate, and were subjected to the cell proliferation assay with the WST‐1 reagent (Clontech).
Results
Focus formation assay with a GBC library. To screen for transforming genes in digestive tract cancers, we constructed a retroviral cDNA expression library from a surgically resected GBC specimen, and obtained a total of 3.2 × 10⁵ colony‐forming units of independent plasmid clones, from which we randomly selected 20 clones and examined the incorporated cDNA. An insert of ≥500 bp was present in 16 (80%) of the plasmid clones, and the average size of these inserts was 1.48 kbp (data not shown). Infection of mouse NIH 3T3 fibroblasts with the recombinant retroviral library generated a total of 89 transformed foci (Fig. 1a). No foci were obtained for cells infected with the empty virus, whereas numerous foci were readily apparent for cells infected with a virus encoding the v‐Ras oncoprotein.
Figure 1.
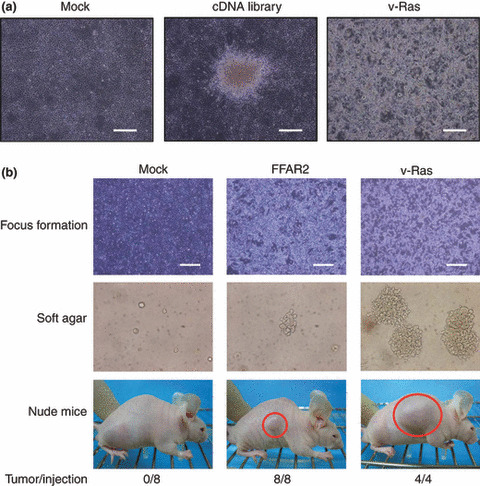
Transforming activity of free fatty acid receptor 2 (FFAR2). (a) A retroviral cDNA expression library was constructed from a gallbladder cancer specimen isolated from a 64‐year‐old man. Mouse 3T3 cells were infected with the retroviral cDNA library, a virus encoding v‐Ras, or the empty virus (Mock), and were photographed after culture for 2 weeks for the analysis of focus formation. Scale bars = 1 mm. (b) 3T3 cells were infected with viruses encoding FFAR2 or v‐Ras or with the empty virus (Mock) and were then cultured for 5 days for analysis of focus formation (top panels: scale bars = 1 mm). The same batches of 3T3 cells were also assayed for anchorage‐independent growth in soft agar over 17 days (middle panels) and for tumorigenicity in nude mice over 3 weeks (bottom panels). Tumors formed in the shoulders of mice injected subcutaneously with 1 × 10⁵ cells are indicated by red circles. The frequency of tumor formation (tumor/injection) is also indicated.
Each focus obtained with the cDNA expression library was isolated, expanded independently, and used to prepare genomic DNA for recovery of retroviral inserts by PCR with the primers used originally to amplify the cDNA in construction of the library.( 7 ) We recovered a total of 45 cDNA fragments by PCR, each of which was subjected to nucleotide sequencing in both directions. Screening of the 45 cDNA sequences against the public nucleotide sequence databases revealed that they corresponded to 19 independent genes (Supporting Information Table S1). To confirm the transforming potential of the isolated cDNA, we ligated each cDNA clone to pMXS and used the resulting retroviruses to infect 3T3 cells. The focus formation assay was carried out for cDNA corresponding to 19 independent genes, revealing reproducible transforming activity for: clone ID #2, corresponding to ARHGEF1 (GenBank accession number NM_004706); clone ID #6, corresponding to TBC1D3 (GenBank accession number NM_032258); clone ID #7, corresponding to FGF4 (GenBank accession number NM_002007); and clone ID #14, corresponding to FFAR2 (GenBank accession number NM_005306) (Fig. 1b).
FFAR2 as an oncogene. FFAR2 functions as a cellular receptor for SCFA,( 10 ) and is expressed in the digestive tract.( 14 ) It is thought to respond to fatty acids released in the digestive tract, but has not previously been shown to possess transforming potential. We therefore focused on FFAR2 in our subsequent analyses. Given that nucleotide sequencing of clone ID #14 did not reveal any sequence alterations compared to the published cDNA sequence of FFAR2 (GenBank accession number NM_005306), we hypothesized that overexpression of FFAR2 might contribute to malignant transformation.
We then assessed the transforming activity of FFAR2 in 3T3 cells with a soft‐agar assay. Whereas cells infected with the empty virus did not grow in soft agar, those infected with a virus encoding v‐Ras grew readily (Fig. 1b). Cells infected with a virus encoding FFAR2 also formed multiple foci in repeated experiments, indicative of the ability of FFAR2 to confer the property of anchorage‐independent growth on 3T3 cells. We further tested the activity of FFAR2 in an in vivo tumorigenicity assay with athymic nude mice. 3T3 cells infected with the empty virus or with retroviruses encoding FFAR2 or v‐Ras were thus injected subcutaneously into the mice. Tumor formation was readily apparent for the cells expressing FFAR2 or v‐Ras (Fig. 1b).
Overexpression of FFAR2 in digestive tract cancers. Given that our data revealed an unexpected transforming potential of FFAR2 (at least, when it is abundantly expressed), we examined whether FFAR2 might be overexpressed in human cancer specimens. We prepared oligo(dT)‐primed cDNA from seven specimens of BTC, 89 specimens of gastric cancer, and 80 specimens of CRC by reverse transcription and then subjected the cDNA preparations to quantitative PCR analysis in order to measure the amount of FFAR2 cDNA. For comparison, we also analyzed specimens of normal gallbladder (n = 6) and biliary duct (n = 1) as well as paired noncancerous tissue for all specimens of gastric cancer and CRC. Whereas the mean expression level of FFAR2 seemed higher in BTC compared to normal gallbladder/biliary duct, a large standard deviation in the expression level made the difference insignificant (P > 0.05) (Fig. 2a). However, the FFAR2 level was significantly increased (P < 0.05) in gastric cancer (Fig. 2b) and CRC (Fig. 2c) compared with the corresponding paired normal tissue specimens.
Figure 2.
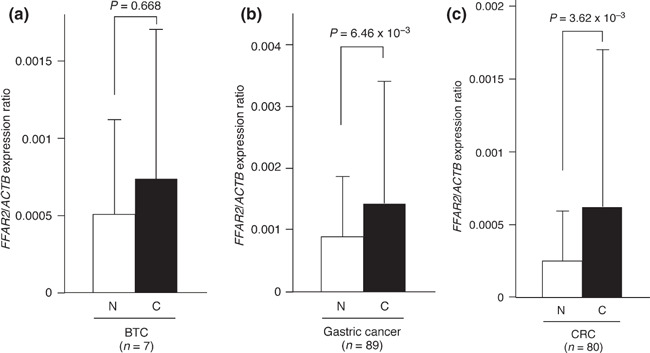
Expression of free fatty acid receptor 2 (FFAR2) in digestive tract cancers. Oligo(dT)‐primed cDNA was synthesized from (a) clinical specimens of biliary tract cancer (C) or normal gallbladder and biliary tract tissue (N), or from paired cancerous (C) and noncancerous (N) tissue specimens from patients with (b) gastric cancer or (c) colorectal cancer. The resultant cDNA was subjected to quantitative PCR analysis. Data are means + SD for the indicated n values, and P‐values for the indicated comparisons were determined by Student’s t‐test. ACTB, β‐actin.
To examine further the site and extent of FFAR2 expression, we carried out in situ hybridization analysis with a series of cancer specimens. First, a section of a CRC specimen was subjected to hybridization with sense or antisense probe for FFAR2 mRNA. Only the antisense probe yielded clear signals in the cytoplasm and nucleus of the cancer cells (Fig. 3a), thus confirming the specificity of this probe. A series of cancer specimens was then subjected to hybridization with the antisense probe for FFAR2 mRNA. GBC cells exhibited an increased level of hybridization compared with the normal cells in the same section (Fig. 3b). However, epithelial cells of normal gallbladder were also stained with the probe, possibly explaining why the amount of FFAR2 mRNA did not differ significantly between GBC and normal tissue by quantitative RT‐PCR analysis (Fig. 2a). In contrast, the hybridization signal for FFAR2 mRNA was markedly greater both in gastric cancer cells in eight of 10 specimens examined than in gland cells of the normal stomach (Fig. 3c), as well as in CRC cells in 13 of 14 specimens examined compared with the corresponding normal cells (Fig. 3d), consistent with the data obtained by quantitative RT‐PCR analysis (Fig. 2b,c).
Figure 3.
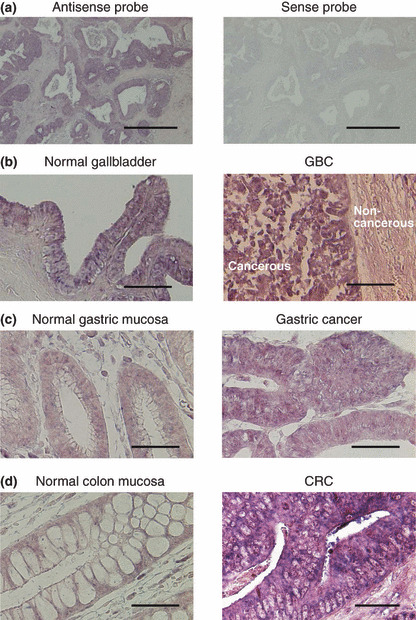
In situ hybridization analysis of free fatty acid receptor 2 (FFAR2) expression. (a) A section of colorectal cancer (CRC) was subjected to in situ hybridization with sense or antisense riboprobes corresponding to the 3′ region (nucleotides 867–1229) of the FFAR2 cDNA isolated in this study. (b–d) Sections of (b) normal gallbladder and gallbladder cancer (GBC), (c) paired normal gastric mucosa and gastric cancer, and (d) paired normal colon mucosa and CRC were also subjected to in situ hybridization with the antisense probe for FFAR2 mRNA. Scale bars = 1 mm (a), 100 μm (b), or 50 μm (c,d).
Additionally, we further examined the FFAR2 protein level by immunohistochemistry with anti‐FFAR2 antibody among digestive tract cancers. As shown in Figure 4, FFAR2 was apparently induced in a GBC specimen (from which the cDNA library was generated) compared to normal gallbladder, in a gastric cancer specimen compared to its paired normal mucosa, and in a CRC specimen compared to the paired normal mucosa.
Figure 4.
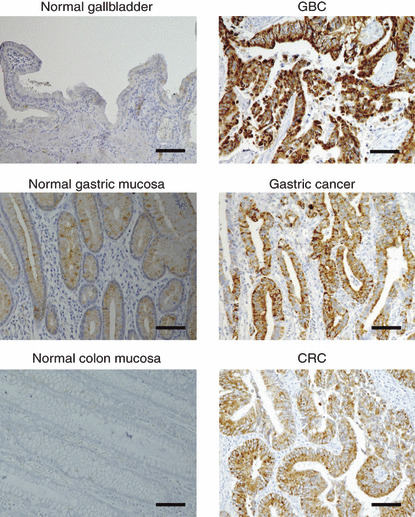
Immunohistochemical analysis of free fatty acid receptor 2 (FFAR2) expression. Sections of normal gallbladder and gallbladder cancer (GBC) (upper panel), of paired normal gastric mucosa and gastric cancer (middle panel), and of paired normal colon mucosa and colorectal cancer (CRC) (lower panel) were subjected to immunohistochemical staining with antibody to FFAR2. Scale bars = 100 μm.
Ligand‐mediated mitogenic signals of FFAR2. Given that SCFA are the presumptive ligands for FFAR2, we next examined whether the transforming activity of FFAR2 might be stimulated by its binding of such ligands. Toward this end, we incubated 3T3 cells expressing FFAR2 cDNA in the absence or presence of the SCFA sodium acetate or sodium butyrate. Forced expression of FFAR2 induced a small increase in the growth rate of 3T3 cells even in the absence of the SCFA, whereas the SCFA had no effect on the growth of cells not expressing FFAR2. In contrast, sodium acetate (100 mm) induced a pronounced increase in the growth rate of cells expressing FFAR2 (Fig. 5a). A smaller but still significant increase in the growth rate of cells expressing FFAR2 was also induced by the addition of 1 mm sodium butyrate (Fig. 5b).
Figure 5.
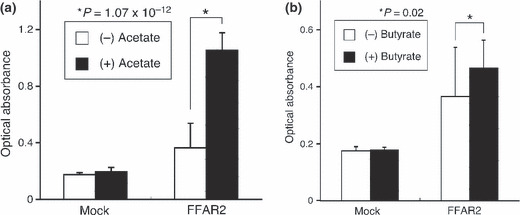
Effect of short chain fatty acids on the proliferation of cells expressing free fatty acid receptor 2 (FFAR2). Mouse 3T3 cells infected with a virus encoding FFAR2 or with the empty virus (Mock) were cultured for 48 h in DMEM‐F12 medium supplemented with 1% charcoal‐treated fetal bovine serum in the absence or presence of (a) 100 mm sodium acetate or (b) 1 mm sodium butyrate. Cell proliferation was then assayed with the use of the WST‐1 reagent. Data are expressed as absorbance at 450 nm and are means + SD of values from three independent experiments. P‐values for the indicated comparisons were determined by Student’s t‐test.
Discussion
In this study, we constructed a retroviral cDNA expression library for a GBC specimen and thereby identified the transforming potential of FFAR2. In response to its activation by ligand, FFAR2 regulates lipogenesis,( 14 ) neutrophil migration,( 15 ) and intestinal motility.( 16 ) Although SCFA activate the p38 mitogen‐activated protein kinase and heat shock protein 27 signaling pathway via FFAR2 in MCF‐7 human breast cancer cells,( 17 ) a relationship between FFAR2 and carcinogenesis has not previously been described.
The FFAR2 gene has been shown to be preferentially expressed in stomach, small intestine, colon, spleen, and adipose tissue of mice.( 14 ) A substantial amount of FFAR2 mRNA was also detected in the rat gut, with the highest levels apparent in the colon and lower levels observed in esophagus and stomach.( 16 ) In addition, FFAR2 has been detected in enterocytes of the rat intestine( 18 ) as well as in those of the human colon.( 19 ) The preferential expression of FFAR2 in the digestive tract and the mitogenic activity of the encoded protein together suggest a possible role for FFAR2 in carcinogenesis of the digestive system.
In our current analyses, both mRNA and protein amounts for FFAR2 were frequently induced among the specimens for digestive tract cancer. However, DNA quantitation of the FFAR2 locus failed to detect copy number changes of the genome (data not shown), and there are no CpG islands mapped closely or within the FFAR2 locus in the human genome. Therefore, the molecular mechanism underlying such FFAR2 induction is yet to be revealed.
SCFA, such as acetate, propionate, and butyrate, are the major products of the breakdown of dietary fiber by bacterial fermentation in the mammalian small and large intestine.( 20 ) Among various SCFA, acetate has the highest selectivity for FFAR2.( 21 ) The composition of SCFA in the colonic lumen is ∼60% acetate, ∼20% propionate, and ∼20% butyrate.( 22 ) SCFA are the major anions, being present at a total concentration of ∼100 mm, in the lumen of the large intestine in mammals.( 23 ) We found that the mitogenic effect of acetate in 3T3 cells expressing FFAR2 was maximal at ∼100 mm (data not shown). These data suggest that FFAR2 may induce mitogenesis in the digestive tract in a manner dependent on the content of SCFA (especially that of acetate) in the diet.
It should be noted that a mere overexpression of FFAR2 significantly induced the growth of 3T3 cells even without the SCFA stimulation (Fig. 5). Although this observation potentially indicates a novel, SCFA‐independent function of FFAR2, overexpression of cell surface receptors often stimulates their intracellular signaling with suboptimal concentrations of cognate ligands. Therefore, it is also possible that highly abundant FFAR2 proteins have evoked a mitogenic signaling in 3T3 in response to a low level of SCFA in the serum (or even independent of SCFA).
Diet has a substantial impact on the occurrence of digestive tract cancers, including GBC, gastric cancer, and CRC,( 24 ) as well as on that of chronic inflammatory bowel diseases.( 25 ) Our present findings suggest a possible connection between such disorders and either continuous exposure to SCFA in certain types of diet or induced expression of FFAR2 in the digestive tract. FFAR2 is thus a potential therapeutic target for these disorders.
Abbreviations
- ALK
anaplastic lymphoma kinase
- EML4
echinoderm microtubule associated protein like‐4
- ERBB2
v‐erb‐b2 avian erythroblastic leukemia viral oncogene homolog 2
- KRAS
v‐ki‐ras2 Kirsten rat sarcoma viral oncogene homolog
- TP53
tumor protein p53
Supporting information
Table S1. Gallbladder cancer cDNA isolated from 3T3 transformants.
Please note: Wiley‐Blackwell are not responsible for the content or functionality of any supporting materials supplied by the authors. Any queries (other than missing material) should be directed to the corresponding author for the article.
Supporting info item
Acknowledgments
We thank K. Sasaki for technical assistance and T. Kitamura (Institute of Medical Science, University of Tokyo) for the pMXS retroviral plasmid. This study was supported in part by Grants‐in‐Aid for Scientific Research from the Ministry of Education, Culture, Sports, Science, and Technology, Japan, and by grants from the Japan Society for the Promotion of Science, and from the Ministry of Health, Labour, and Welfare, Japan. The nucleotide sequence of the FFAR2 cDNA isolated in this study has been deposited in DDBJ/GenBank under the accession number AB378083.
References
- 1. Carriaga MT, Henson DE. Liver, gallbladder, extrahepatic bile ducts, and pancreas. Cancer 1995; 75: 171–90. [DOI] [PubMed] [Google Scholar]
- 2. Cubertafond P, Gainant A, Cucchiaro G. Surgical treatment of 724 carcinomas of the gallbladder. Results of the French Surgical Association Survey. Ann Surg 1994; 219: 275–80. [DOI] [PMC free article] [PubMed] [Google Scholar]
- 3. Jemal A, Siegel R, Ward E, Murray T, Xu J, Thun MJ. Cancer statistics, 2007. CA Cancer J Clin 2007; 57: 43–66. [DOI] [PubMed] [Google Scholar]
- 4. Zatonski WA, Lowenfels AB, Boyle P et al. Epidemiologic aspects of gallbladder cancer: a case–control study of the SEARCH Program of the International Agency for Research on Cancer. J Natl Cancer Inst 1997; 89: 1132–8. [DOI] [PubMed] [Google Scholar]
- 5. Hasumi A, Matsui H, Sugioka A et al. Precancerous conditions of biliary tract cancer in patients with pancreaticobiliary maljunction: reappraisal of nationwide survey in Japan. J Hepatobiliary Pancreat Surg 2000; 7: 551–5. [DOI] [PubMed] [Google Scholar]
- 6. Goldfarb M, Shimizu K, Perucho M, Wigler M. Isolation and preliminary characterization of a human transforming gene from T24 bladder carcinoma cells. Nature 1982; 296: 404–9. [DOI] [PubMed] [Google Scholar]
- 7. Soda M, Choi YL, Enomoto M et al. Identification of the transforming EML4–ALK fusion gene in non‐small‐cell lung cancer. Nature 2007; 448: 561–6. [DOI] [PubMed] [Google Scholar]
- 8. Hatanaka H, Takada S, Choi YL et al. Transforming activity of purinergic receptor P2Y, G‐protein coupled, 2 revealed by retroviral expression screening. Biochem Biophys Res Commun 2007; 356: 723–6. [DOI] [PubMed] [Google Scholar]
- 9. Choi YL, Kaneda R, Wada T et al. Identification of a constitutively active mutant of JAK3 by retroviral expression screening. Leuk Res 2007; 31: 203–9. [DOI] [PubMed] [Google Scholar]
- 10. Brown AJ, Goldsworthy SM, Barnes AA et al. The Orphan G protein‐coupled receptors GPR41 and GPR43 are activated by propionate and other short chain carboxylic acids. J Biol Chem 2003; 278: 11312–9. [DOI] [PubMed] [Google Scholar]
- 11. Fujiwara S, Yamashita Y, Choi YL et al. Transforming activity of purinergic receptor P2Y, G protein coupled, 8 revealed by retroviral expression screening. Leuk Lymphoma 2007; 48: 978–86. [DOI] [PubMed] [Google Scholar]
- 12. Pear WS, Nolan GP, Scott ML, Baltimore D. Production of high‐titer helper‐free retroviruses by transient transfection. Proc Natl Acad Sci USA 1993; 90: 8392–6. [DOI] [PMC free article] [PubMed] [Google Scholar]
- 13. Schaeren‐Wiemers N, Gerfin‐Moser A. A single protocol to detect transcripts of various types and expression levels in neural tissue and cultured cells: in situ hybridization using digoxigenin‐labelled cRNA probes. Histochemistry 1993; 100: 431–40. [DOI] [PubMed] [Google Scholar]
- 14. Hong YH, Nishimura Y, Hishikawa D et al. Acetate and propionate short chain fatty acids stimulate adipogenesis via GPCR43. Endocrinology 2005; 146: 5092–9. [DOI] [PubMed] [Google Scholar]
- 15. Nilsson NE, Kotarsky K, Owman C, Olde B. Identification of a free fatty acid receptor, FFA2R, expressed on leukocytes and activated by short‐chain fatty acids. Biochem Biophys Res Commun 2003; 303: 1047–52. [DOI] [PubMed] [Google Scholar]
- 16. Dass NB, John AK, Bassil AK et al. The relationship between the effects of short‐chain fatty acids on intestinal motility in vitro and GPR43 receptor activation. Neurogastroenterol Motil 2007; 19: 66–74. [DOI] [PubMed] [Google Scholar]
- 17. Yonezawa T, Kobayashi Y, Obara Y. Short‐chain fatty acids induce acute phosphorylation of the p38 mitogen‐activated protein kinase/heat shock protein 27 pathway via GPR43 in the MCF‐7 human breast cancer cell line. Cell Signal 2007; 19: 185–93. [DOI] [PubMed] [Google Scholar]
- 18. Karaki S, Mitsui R, Hayashi H et al. Short‐chain fatty acid receptor, GPR43, is expressed by enteroendocrine cells and mucosal mast cells in rat intestine. Cell Tissue Res 2006; 324: 353–60. [DOI] [PubMed] [Google Scholar]
- 19. Karaki SI, Tazoe H, Hayashi H et al. Expression of the short‐chain fatty acid receptor, GPR43, in the human colon. J Mol Histol 2008; 39: 135–42. [DOI] [PubMed] [Google Scholar]
- 20. Bergman EN. Energy contributions of volatile fatty acids from the gastrointestinal tract in various species. Physiol Rev 1990; 70: 567–90. [DOI] [PubMed] [Google Scholar]
- 21. Le Poul E, Loison C, Struyf S et al. Functional characterization of human receptors for short chain fatty acids and their role in polymorphonuclear cell activation. J Biol Chem 2003; 278: 25481–9. [DOI] [PubMed] [Google Scholar]
- 22. Cummings JH, Pomare EW, Branch WJ, Naylor CP, Macfarlane GT. Short chain fatty acids in human large intestine, portal, hepatic and venous blood. Gut 1987; 28: 1221–7. [DOI] [PMC free article] [PubMed] [Google Scholar]
- 23. Topping DL, Clifton PM. Short‐chain fatty acids and human colonic function: roles of resistant starch and nonstarch polysaccharides. Physiol Rev 2001; 81: 1031–64. [DOI] [PubMed] [Google Scholar]
- 24. Key TJ, Allen NE, Spencer EA, Travis RC. The effect of diet on risk of cancer. Lancet 2002; 360: 861–8. [DOI] [PubMed] [Google Scholar]
- 25. Reif S, Klein I, Lubin F, Farbstein M, Hallak A, Gilat T. Pre‐illness dietary factors in inflammatory bowel disease. Gut 1997; 40: 754–60. [DOI] [PMC free article] [PubMed] [Google Scholar]
Associated Data
This section collects any data citations, data availability statements, or supplementary materials included in this article.
Supplementary Materials
Table S1. Gallbladder cancer cDNA isolated from 3T3 transformants.
Please note: Wiley‐Blackwell are not responsible for the content or functionality of any supporting materials supplied by the authors. Any queries (other than missing material) should be directed to the corresponding author for the article.
Supporting info item


