

Abstract
MicroRNAs (miRNAs) are frequently deregulated in human tumors, and play important roles in tumor development and progression. The pathological roles of miRNAs in neurofibromatosis type 1 (NF1) tumorigenesis are largely unknown. We demonstrated that miR‐10b was up‐regulated in primary Schwann cells isolated from NF1 neurofibromas and in cell lines and tumor tissues from malignant peripheral nerve sheath tumors (MPNSTs). Intriguingly, a significantly high level of miR‐10b correlated with low neurofibromin expression was found in a neuroectodermal cell line: Ewing’s sarcoma SK‐ES‐1 cells. Antisense inhibiting miR‐10b in NF1 MPNST cells reduced cell proliferation, migration and invasion. Furthermore, we showed that NF1 mRNA was the target for miR‐10b. Overexpression of miR‐10b in 293T cells suppressed neurofibromin expression and activated RAS signaling. Antisense inhibition of miR‐10b restored neurofibromin expression in SK‐ES‐1 cells, and decreased RAS signaling independent of neurofibromin in NF1 MPNST cells. These results suggest that miR‐10b may play an important role in NF1 tumorigenesis through targeting neurofibromin and RAS signaling. (Cancer Sci 2010)
Neurofibromatosis type 1 (NF1; OMIM #162200) is the most common inherited tumor predisposition syndrome, which occurs one in every 3000–3500 human births worldwide.( 1 , 2 ) Multiple neurofibromas are the hallmark of NF1. One subtype of neurofibroma, the plexiform neurofibroma, occurs in about 30% of NF1 individuals. Neurofibromatosis type 1 (NF1) individuals with plexiform neurofibromas have a >10% lifetime risk of developing malignant peripheral nerve sheath tumors (MPNSTs),( 3 ) the most common malignant tumor associated with NF1. Although complete surgical resection is often not possible, surgery remains the only treatment option for plexiform neurofibromas and MPNSTs. The prognosis for patients with MPNSTs is poor, with an overall 5‐year survival rate of just 34%.( 4 ) Despite the urgent need, targeted therapies for MPNSTs to improve survival are not obvious.
It is generally accepted that Schwann cells are the primary transformed cells in neurofibromas, and that loss of heterozygosity (LOH) in NF1 locus in Schwann cells initiates tumorigenesis and development of neurofibromas. Neurofibromatosis type 1 (NF1) protein, neurofibromin, contains a highly conserved GTPase‐activating protein (GAP)‐related domain (GRD) that converts active RAS‐GTP into inactive RAS‐GDP in the RAS signaling pathway.( 5 ) Loss of heterozygosity (LOH) in Schwann cells reduces or diminishes the expression of neurofibromin, and thus activates the RAS signaling pathway and contributes to tumor development.( 6 , 7 , 8 )
In addition to LOH, mRNA processes, such as unequal expression of NF1 alleles, NF1 mRNA editing, and NF1 mRNA stability or transport, can affect neurofibromin expression and regulate NF1 tumorigenesis.( 9 , 10 , 11 , 12 , 13 , 14 ) Unequal allelic expression of the NF1 gene has been detected in fibroblasts, lymphoblasts, keratinocytes, and melanocytes in NF1 patients,( 12 , 13 , 15 ) which significantly reduces neurofibromin expression. Neurofibromatosis type 1 (NF1) mRNA editing creates an in‐frame translation stop codon within the first half of the GRD without activity toward the RAS proteins, resulting in a functionally equivalent biallelic inactivation.( 12 , 13 , 16 ) The 3′ untranslated region (UTR) of NF1 mRNA is highly conserved among different species.( 17 ) This UTR region binds to tumor antigen HuR, and contains four potential protein‐binding domains, which may introduce additional mechanisms to control mRNA stability, intracellular localization, and the efficiency of translation.( 18 )
MicroRNAs (miRNAs) are a class of small non‐coding RNAs of about 19–25 nucleotides that function as negative post‐transcriptional gene regulators.( 19 ) miRNAs hybridize to 3′ UTR of target mRNAs, and can repress translation or mediate mRNA cleavage. Studies show that miRNAs critically regulate tumorigenesis and progression.( 20 , 21 ) Different tumor types and tumors at various stages of differentiation exhibit unique miRNA profiles.( 22 , 23 ) We hypothesize that specific miRNAs may serve as an alternative for LOH of the NF1 gene and regulate NF1 tumorigenesis. To test this hypothesis, we determined miRNA profiles in NF1 tumor tissues and cell lines. Our data reveal that miR‐10b targets neurofibromin and RAS signaling, and may play an important role in NF1 tumorigenesis.
Materials and Methods
Human tissues used in this study were obtained under human subject protocols approved by the Institutional Review Boards; informed consent was obtained from each subject or subject’s guardian.
Cell culture. Normal human Schwann cells were isolated from adult sciatic nerves, procured from the LifeLine of Ohio (Columbus, OH, USA).( 24 ) Neurofibromatosis type 1 (NF1) Schwann cells were isolated from NF1 neurofibromas and plexiform neurofibromas.( 25 ) All assays were performed using cultures at passage 3–4. Schwann cells were plated in DMEM medium containing 10% FBS (Invitrogen, Carlsbad, CA, USA) and neuregulin (50 ng/mL) (R&D, Minneapolis, MN, USA). Human NF1‐associated MPNST cell lines ST88‐14 and T265p21, and the non‐NF1‐associated MPNST cell line STS26T (kindly supplied by Dr Nancy Ratner, Cincinnati Children's Hospital Medical Center, Cincinnati, OH, USA), were maintained in DMEM medium supplemented with 10% FBS. Neurofibromatosis type 1 (NF1) mutation status for these three cell lines has been reported by other groups previously.( 26 , 27 ) SBC5 and SBC3, human small cell lung cancer (SCLC) cell lines,( 28 ) were purchased from the Japanese Collection of Research Bioresources Cell Bank (Osaka, Japan). Other tumor cell lines were purchased from ATCC (Manassas, VA, USA). All these cell lines were maintained in the medium recommended by the vendors.
Analysis of miRNA expression by microarray and qRT‐PCR. RNA was extracted from cells or tissues using the RNeasy miRNA kit (Qiagen, Valencia, CA, USA). miRNA microarrays were performed by LC Sciences (Houston, TX, USA). Reverse transcriptase (RT) and quantitative real‐time PCR were performed in a two‐step reaction using Taqman microRNA assays according to protocol provided by the manufacturer (Applied Biosystems, Foster City, CA, USA). U6 was used as internal control. The 2−ΔΔCT method, described by Livak and Schmittgen, ( 29 ) was used to analyze data.
Neurofibromatosis type 1 (NF1) 3′ UTR reporter assay. The 3′ UTR of the NF1 gene was amplified into pcDNA3 vector from human genomic DNA and its sequence was confirmed by DNA sequencing. Point mutations within the target sequence for miR‐10b in NF1 3′UTR (NF1 3′ UTRm) were generated with the QuickChange II XL site‐directed mutagenesis kit (Stratagene, La Jolla, TX, USA). The plasmids containing NF1 3′ UTRm were sequenced to confirm replacement of the targeted residues. Neurofibromatosis type 1 (NF1) 3′ UTR or NF1 3 UTRm was sub‐cloned into the 3′UTR of the pMIR‐REPORT miRNA reporter vector (Ambion, Austin, TX, USA). The pMIR reporter vector or pMIR reporter vector with NF1 3′UTR(m) was stably transfected into 293T cells. Stably transfected cells were then transiently co‐transfected with a miR‐10b expression vector (MDH1‐PGK‐GFP/miR‐10b, Addgene plasmid #16070)( 30 ) or an empty vector (MDH1‐PGK‐GFP) together with the pMIR‐REPORT β‐galactosidase reporter control vector (Ambion). Cells were collected 30 h after transfection, and the ratio of β‐galactosidase to firefly luciferase was measured with the Dual Luciferase Assay kit (Promega, Madison, WI, USA).
miR‐10b over‐expression in 293T cells. The MDH1‐PGK‐GFP/miR‐10b vector or the MDH1‐PGK‐GFP vector was transfected into 293T cells. At 48 h after transfection, cells were serum‐starved for 24 h, protein and RNA were processed for western blotting and qRT‐PCR analyses.
Targeted inhibition or enhancement of endogenous miRNAs in tumor cell lines. ST88‐14 or SK‐ES‐1 or STS26T cell lines were grown in cell culture plates overnight. Various miRNA inhibitors (miR‐10b, miR‐155, miR‐335), precursors (let‐7a, miR‐10b), or controls (all from Ambion) were transfected into cells using Lipofectin 2000 (Invitrogen). Transfected cells were analyzed by various assays described below.
Western blotting. Cells grown to 70–80% confluence in six‐ or 12‐well plates were serum‐starved for 24 h and lysed in RIPA buffer. The blotting membrane was incubated overnight at 4°C with different primary antibodies: anti‐p44/42 MAP kinase (1:1000; Cell Signaling Technology, Danvers, MA, USA), anti‐phospho‐p44/42 MAPK (Thr202/Tyr204) (1:1000; Cell Signaling), anti‐neurofibromin (sc–67, 1:500; Santa Cruz Biotechnology, Santa Cruz, CA, USA), anti‐TWIST1 (1:1000; Cell Signaling), and anti‐β‐actin (1:1000; Sigma). The blots were incubated for 1 h at room temperature with a horseradish peroxidase‐conjugated secondary antibody: anti‐goat or ‐mouse IgG (Chemicon, Temecula, CA, USA). Signals were visualized using ECL plus chemiluminescence substrate (Amersham, Piscataway, NJ, USA).
MTT assay. Cells were plated in 96‐well plates at a density of 1000 cells/well overnight. Various miRNA inhibitors or precursors or controls were transfected into cells with Lipofectin 2000 (Invitrogen). After serum starvation for 24 h, medium was replaced with 100‐μL fresh medium containing 0.5 mg/mL MTT at the indicated time points. After 4‐h incubation, medium was removed and purple blue sediment was dissolved in 150 μL DMSO. The relative optical density (OD) for each well was determined using a Wellscan MK3 ELIASA kit (Labsystems, Dragon, Finland).
Colony formation. ST88‐14 cells transfected with miR‐10b inhibitors or negative controls were cultured in six‐well plates for 14 days. Cells were fixed with 4% paraformaldehyde for 20 min, stained with 0.1% crystal violet for 30 min, washed with distilled water, and dried. Colonies were counted under bright‐field microscopy.
Cell migration and invasion. Transfected cells were serum‐starved for 24 h and then pulsed with 5 μm of cell tracker green (Invitrogen) for 30 min. Labeled cells were trypsinized and replated in 0.2% FBS‐containing medium without growth factors at a density of 25 000 cells per well in a transwell insert (3‐μm pore size; BD Biosciences, San Jose, CA, USA) for the migration assay or 50 000 cells per well in matrigel‐coated, growth‐factor‐reduced, invasion chambers (8‐μm pore size; BD Biosciences) for invasion assay. After 6‐h incubation for migration assay or 22‐h incubation for invasion assay, cells were fixed with 4% paraformaldehyde for 1 h. Cells on the apical side of each insert were scraped off, and those that had migrated to the basal side of the membrane were visualized under a Zeiss Axiovert 200 M microscope. Cell numbers were quantified in an automated mode using Metamorph analysis software (Downingtown, PA, USA).
Statistical analyses. Analyses were performed with JMP 8.0 software (SAS, Cary, NC, USA). anova was used to compare multiple groups, followed by pairwise comparisons if significant differences were detected; Dunnett’s test was used for comparison with a control group (Figs 1,4c,d,6a), and the Tukey–Kramer test was used for comparison of all groups (2, 3). Unpaired t‐tests were used to compare two groups (Figs 4a,5d). To determine the effects of both genetic manipulation (luciferase and luciferase/NF1 3′UTR) and treatments (control or miR‐10b), a two‐way anova and pairwise comparisons were used (Fig. 5b). Differences were considered statistically significant at P < 0.05 on a two‐tailed test. Data are expressed as mean ±SEM.
Figure 1.

Differential miRNA expression profiles in neurofibromatosis type 1 (NF1) versus non‐NF1 malignant peripheral nerve sheath tumor (MPNST) cell lines. (a–e) miRNA expression in non‐NF1 (STS26T) and NF1 (ST88‐14, T265p21) associated MPNST cells was investigated by qRT‐PCR. Expression levels of miR‐10b (a), miR‐155 (b), and miR‐335 (c) were significantly higher in NF1 MPNST cells than in non‐NF1 MPNST cells, while expression levels of let‐7a (d) and let‐7b (e) were significantly lower in NF1 MPNST cells. The result was consistent with microarray data. ST88‐14 or T265p21 versus STS26T: *P < 0.05, **P < 0.01, ***P < 0.001, n = 3. (f) Western blotting showed that STS26T expressed a significant amount neurofibromin, but a lower level of TWIST1; T265p21 and ST88‐14 expressed a very low to undetectable level of neurofibromin, but a higher level of TWIST1.
Figure 2.

miRNA profiles in neurofibromatosis type 1 (NF1) tumor tissues. Human NF1 tumor samples were divided into an NF1 neurofibroma group (control, n = 13), a non‐NF1 malignant peripheral nerve sheath tumor (MPNST) group (n = 4), and an NF1 MPNST group (n = 8) according to clinical and pathological diagnosis. miRNA expression was studied by qRT‐PCR. Compared to the neurofibroma control group, the expression level of miR‐10b was significantly higher, while expression levels of let‐7a and let‐7b were significantly lower in NF1 MPNST tissues. Compared to non‐NF1 MPNST, the expression level of miR‐10b was significantly higher in NF1 MPNST. There were no differences in expression levels of miR‐155 and miR‐335 among the three groups. (a) Compared to NF1 neurofibromas, P < 0.05; (b) compared to non‐NF1MPNST, P < 0.05.
Figure 3.

miRNA profiles in primary Schwann cells from neurofibromatosis type 1 (NF1) neurofibromas. Primary Schwann cells were isolated from normal human adult sciatic nerves, and NF1 dermal and plexiform neurofibromas. Neurofibromatosis type 1 (NF1) malignant peripheral nerve sheath tumor (MPNST) cell lines ST88‐14 and T265p21 were also used for comparison. miRNA expression was studied by qRT‐PCR. miR‐10b expression level was significantly higher in NF1 dermal Schwann cells than in normal Schwann cells. Neurofibromatosis type 1 (NF1) plexiform Schwann cells also showed higher miR‐10b expression, but the difference was not statistically significant (P = 0.07). The highest expression level of miR‐10b was observed in NF1 MPNST cells. Expression levels of miR‐155 and miR‐335 were significantly higher, and expression levels of let‐7b and let‐7a were significantly lower in NF1 MPNST cells. There were no significant differences in the expression levels of miR‐155, miR‐335, and let‐7a between NF1 neurofibroma cells and normal Schwann cells. SC, Schwann cells. (a) P < 0.05 versus normal SC; (b) P < 0.05 versus dermal or plexiform SC; n = 3–4.
Figure 4.
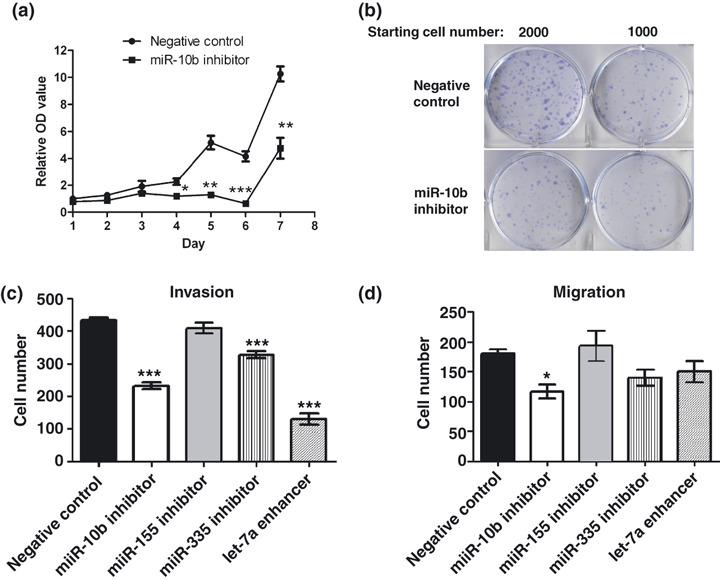
Antisense inhibition of miR‐10b corrected abnormal growth behaviors of neurofibromatosis type 1 (NF1) malignant peripheral nerve sheath tumor (MPNST) cells. The inhibitors for miR‐10b, miR‐155, miR‐335, or the enhancers for let‐7a or negative controls were transfected into NF1 MPNST cells (ST88‐14). (a) Inhibiting miR‐10b expression significantly reduced cell proliferation at days 4–7 (n = 5 each time point; MTT assay). (b) Inhibiting miR‐10b decreased colony formation. (c) Restoring miR‐10b or miR‐335 or let‐7a significantly decreased cell invasion (n = 3). (d) Inhibiting miR‐10b significantly decreased cell migration (n = 3). Inhibitors or enhancers versus negative controls: *P < 0.05, **P < 0.01, ***P < 0.001.
Figure 5.

miR‐10b directly targeted neurofibro‐matosis type 1 (NF1) 3′UTR. (a) The 3′UTR of the NF1 gene was analyzed by TargetScan and a target sequence for miR‐10b was identified. This target sequence was highly conserved across species. (b) Neurofibromatosis type 1 (NF1) 3′UTR was cloned into the 3′UTR of the Luc reporter vector and the resulting construct was stably transfected into 293T cells. miR‐10b cotransfection significantly reduced expression of the Luc reporter containing NF1 3′UTR. miR‐10b could not reduce luciferase activity if its targeted seed sequence in the NF1 3′UTR was mutated (NF1 3′UTRm). These results indicate that miR‐10b directly targeted NF1 3′UTR. (c) The MDH1‐PGK‐GFP/microRNA‐10b (vector/miR‐10b) or MDH1‐PGK‐GFP vector (vector) was transfected into 293T cells. Overexpressing miR‐10b suppressed neurofibromin expression. *P < 0.05 versus control; n = 3. (d) miR‐10b enhancers were transiently transfected into STS26T cells. Enhancing miR‐10b significantly increased invasion. This result indicates that overexpression of miR‐10b directly regulates the cellular tumor characteristics.
Results
Differential and selective miRNA expression profiles in NF1 versus non‐NF1 MPNST cell lines. We first compared miRNA profiles in ST88‐14 cells and STS26T cells. ST88‐14 is a cell line derived from human NF1 MPNSTs that does not express detectable neurofibromin,( 27 , 31 ) but high level of TWIST1 (Fig. 1f). STS26T is a cell line derived from non‐NF1 MPNSTs that does not have NF1 mutations, and expresses neurofibromin (Fig. 1f and refs 27, 31). Of 833 miRNAs analyzed, 70 miRNAs were identified to be up‐regulated and 40 were down‐regulated in ST8814 cells compared with STS26T cells. Among these differentially expressed miRNAs, more than 20 were expressed at very high levels (density over 500) in either ST88‐14 or STS26T cells (Table 1). Of interest, the oncogenic miRNAs, miR‐10b, miR‐155, and miR‐335,( 30 , 32 , 33 , 34 ) exhibited selective higher expression in ST88‐14. Expression of let‐7 family members, let‐7a, 7b, c, d, e, and f, known to target RAS,( 35 ) was significantly lower in ST88‐14 than in STS26T cells.
Table 1.
Significantly different miRNAs in the ST88‐14 cell line
| miRNA name | Sample A signal (STS26T) | Sample B signal (ST88‐14) | log2 (sample B/sample A) |
|---|---|---|---|
| hsa‐miR‐155 | 57.52 | 15 133.97 | 8.07 |
| hsa‐miR‐10b | 40.17 | 2344.19 | 6.03 |
| hsa‐miR‐335 | 52.42 | 1852.52 | 5.21 |
| hsa‐miR‐335* | 46.33 | 577.63 | 3.66 |
| hsa‐miR‐9 | 48.39 | 563.35 | 3.56 |
| hsa‐miR‐495 | 67.99 | 676.81 | 3.32 |
| hsa‐miR‐199a‐3p | 679.91 | 6299.73 | 3.20 |
| hsa‐miR‐26b | 224.22 | 1455.28 | 2.62 |
| hsa‐miR‐125b | 6224.17 | 34 459.48 | 2.48 |
| hsa‐miR‐199a‐5p | 76.14 | 379.47 | 2.48 |
| hsa‐miR‐432 | 168.12 | 925.78 | 2.44 |
| hsa‐miR‐21 | 12 670.62 | 67 784.34 | 2.42 |
| hsa‐let‐7b | 22 544.01 | 3360.10 | −2.75 |
| hsa‐let‐7c | 27 521.95 | 11 369.75 | −1.27 |
| hsa‐let‐7f | 28 609.16 | 13 063.69 | −1.13 |
| hsa‐let‐7d | 25 880.96 | 12 514.49 | −1.04 |
| hsa‐let‐7e | 19 603.92 | 10 041.31 | −0.97 |
| hsa‐let‐7a | 33 107.49 | 18 875.83 | −0.79 |
| hsa‐let‐7i | 5511.24 | 4257.94 | −0.38 |
| hsa‐miR‐98 | 2174.17 | 210.09 | −3.42 |
| hsa‐miR‐1308 | 4708.66 | 468.48 | −3.28 |
| hsa‐miR‐1275 | 2550.47 | 281.91 | −3.24 |
Significantly different miRNAs in the ST8814 cell line. Total RNA from ST88‐14 and STS26T cells was labeled and hybridized on miRNA microarrays (LC Sciences, Houston, TX, USA) (n = 3). All differentially expressed miRNAs with a P‐value <0.01 and high density are listed. Signals represent median signal values of three repeated samples. Mature miRNAs are sorted separately according to differential ratios. The ratio values are presented in log2 scale for quick and easy assessing differential direction as well as magnitude. A positive log2 value indicates up‐regulation and a negative log2 value indicates down‐regulation. *Minor microRNA sequence.
The microarray data was further confirmed in NF1 MPNST cells (ST88‐14 and T265p21) versus non‐NF1 MPNST cells (STS26T) by qRT‐PCR. T265p21 is a cell line derived from human NF1 MPNSTs that expresses a very low level of neurofibromin, but a high level of TWIST1 (Fig. 1f). Interestingly, the T265p21 cell line displayed a miRNA profile similar to the neurofibromin‐deficient NF1 MPNST cell line ST88‐14. In ST88‐14 and T265p21 cells, miR‐10b expression was 20–30‐fold higher, miR‐155 expression was over 4000‐fold higher, miR‐335 expression was 30–70‐fold higher, let‐7a expression was approximately 50% lower, and let‐7b expression was approximately 90% lower, compared to that in ST262T cells (Fig. 1a–e). Subsequent analyses were focused on these five miRNAs (miR‐10b, miR‐155, miR‐335, let‐7a, and let‐7b), wherein their expression levels exhibited marked differences between NF1 and non‐NF1 MPNST cells.
miRNA profiles in human NF1 tumor tissues. To further investigate miRNA profiles in tumor tissues procured from NF1 individuals, total RNA was isolated from frozen human NF1 MPNSTs (n = 8, six males, two females; average age: 35 years) and non‐NF1 MPNSTs (n = 4, two males, two females; average age: 49 years), as well as benign NF1 neurofibroma tissues (n = 13, nine males, four females; average age: 37 years). Compared to benign neurofibromas, the expression level of miR‐10b was significantly higher in NF1 but not in non‐NF1 MPNSTs, while those of let‐7a and let‐7b were significantly lower in both NF1 MPNSTs and non‐NF1 MPNSTs (Fig. 2). The expression level of miR‐10b was significantly higher in NF1 MPNSTs than in non‐NF1 MPNSTs (Fig. 2), although marginally elevated, but insignificant expression levels of miR‐155 and miR‐335 were observed in NF1 MPNSTs compared with in non‐NF1 MPNSTs (Fig. 2).
miRNA profiles in primary Schwann cells derived from human NF1 tumors. Schwann cells are considered to be primary transformed cells in NF1 neurofibromas and MPNSTs. To further investigate the role of miRNAs in NF1 tumorigenic mechanisms, primary Schwann cells were isolated from NF1 dermal and plexiform neurofibroma tissues, and from normal human adult sciatic nerves, and compared with NF1 MPNST cell lines, ST88‐14 and T265p21. miR‐10b was the only miRNA whose expression was higher in primary Schwann cells from human NF1 dermal neurofibromas than that in normal Schwann cells (Fig. 3, P < 0.05). The miR‐10b expression level appeared higher in NF1 plexiform Schwann cells, but the difference was not statistically significant (Fig. 3, P = 0.07), likely due to small sample size. Of interest, the highest miR‐10b expression occurred in NF1 MPNST cell lines ST88‐14 and T265p21 (Fig. 3, P < 0.05). Expression levels of miR‐155 and miR‐335 were significantly higher in NF1 MPNST cells, but not in Schwann cells isolated from NF1 dermal or NF1 plexiform neurofibromas (Fig. 3, P < 0.01). In contrast, expression of let‐7a and let‐7b was significantly lower in NF1 MPNST cells (Fig. 3, P < 0.05).
Antisense inhibition of miR‐10b expression reverses abnormal cellular behaviors of NF1 MPNST cells. To further investigate the functional significance of a specific set of deregulated miRNAs observed in NF1 MPNSTs cells, ST88‐14 cells were transfected with antisense inhibitors (miR‐10b, miR‐155, and miR‐335), mimic enhancers let‐7a, or with negative controls. Inhibiting miR‐10b expression in ST8814 cells significantly decreased cell proliferation, migration, and invasion (Fig. 4a–d). Although inhibiting miR‐155 and miR‐335 expression or enhancing let‐7a expression did not affect proliferation (data not shown) or migration in ST88‐14 cells (Fig. 4d), inhibiting miR‐335 or enhancing let‐7a resulted in a significant reduction of cell invasion (Fig. 4c). These results suggest that miR‐10b plays an important role in NF1 tumorigenic mechanisms, while miR‐335 and let‐7 may have a role in cell invasion.
miR‐10b directly targets 3′ UTR of NF1 mRNA and suppresses neurofibromin expression. Because loss‐of‐function in NF1 is the central pathological mechanism in NF1 tumorigenesis, we searched for potential miRNA that might target NF1 mRNA. An analysis using TargetScan (http://www.targetscan.org/) predicted that miRNA‐10b, but not miR‐155, miR‐335, or let‐7a/7b, would target the 3′ UTR of NF1 mRNA (Fig. 5a). Interestingly, seed sequence of the targeted site in the NF1 mRNA for miR‐10b was highly conserved among various species (Fig. 5a), supporting a regulating role for miR‐10b in NF1 gene expression. To test this possibility, we cloned NF1 3′UTR and placed it in the 3′UTR of a luciferase reporter expression cassette. Co‐transfection in 293T cells with either the miR‐10b expression vector or a control vector showed that overexpression of miR‐10b significantly reduced luciferase activity from the construct containing NF1 3′UTR (Fig. 5b; P < 0.05), while miR‐10b failed to reduce luciferase activity if its target sequence in the NF1 3′UTR was mutated (Fig. 5b). This result indicates that miR‐10b directly targets 3′UTR of NF1 mRNA.
To further investigate the relationship between miR‐10b and NF1 expression, we overexpressed miR‐10b in 293T cells by a mammalian expression vector MDH1‐PGK‐GFP/miR‐10b. We monitored transfection efficiency by visualizing GFP expression and confirming the miR‐10b expression level by qRT‐PCR (data not shown). 293T cells are NF1+/+ and expressed neurofibromin protein when transfected with the control vector. In contrast, cells transfected with MDH1‐PGK‐GFP/miR‐10b expression vector expressed very low levels of neurofibromin (Fig. 5c). These results indicate that miR‐10b selectively and specifically targets NF1 mRNA to suppress neurofibromin expression. To determine the pathological roles of overexpressing miR‐10b in NF1 tumorigenesis, we transiently transfected miR‐10b enhancers into STS26T cells, which expressed low miR‐10b. Enhancing miR‐10b significantly increased invasion (Fig. 5d), but not proliferation and migration in STS26T cells (data not shown). This result indicates that overexprssion of miR‐10b directly regulates the cellular tumor characteristics.
Conversely, we examined if inhibiting miR‐10b in tumor cells expressing high miR‐10b could restore neurofibromin expression. Intriguingly, inhibiting miR‐10b in ST88‐14 and T265p21 did not restore neurofibromin expression (data not shown). We speculated that these NF1 MPNST cells may harbor some specific NF1 mutations, which affect mRNA translation and neurofibromin stability. We searched for tumor cells to confirm that low expression of neurofibromin correlated with high miR‐10b. Compared to other cell lines, Ewing’s sarcoma cell line SK‐ES‐1 expressed the highest miR‐10b concurrently with undetectable neurofibromin (Fig. 6a,b). We hypothesized that miR‐10b may functionally target neurofibromin in this cell line. Interestingly, inhibiting miR‐10b expression in SK‐ES‐1 cells substantially increased neurofibromin expression at 48 and 72 h after transfection (Fig. 6c). Collectively, these results further support the notion that miR‐10b directly regulates neurofibromin expression.
Figure 6.
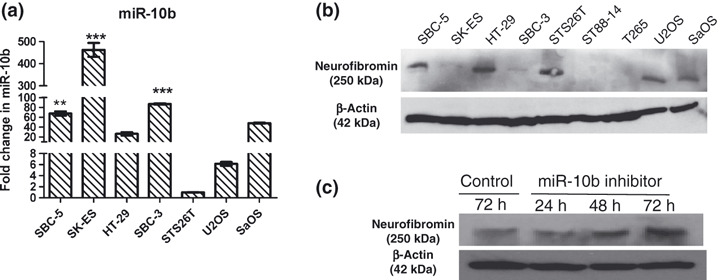
Antisense inhibition of miR‐10b restored neurofibromin expression. Expressions of miR‐10b and neurofibromin in some human tumor cell lines were studied by qRT‐PCR and western blotting separately. Ewing sarcoma cells (SK‐ES1) expressed the highest miR‐10b (a), but very low neurofibromin (b). Inhibiting miR‐10b restored neurofibromin expression at 48 and 72 h (c). These results suggest that miR‐10b directly suppresses neurofibromin in SK‐ES1.
miR‐10b modulates RAS signaling. Because most NF1‐related tumors display an abnormal RAS signaling pathway, we questioned whether miR‐10b targets RAS signaling pathways. Using web‐based software, we identified a few proteins in the RAS signaling pathway as candidate targets for miR‐10b (Table 2). To validate this finding, we overexpressed miR‐10b in 293T cells. 293T cells transfected with the MDH1‐PGK‐GFP/miR‐10b expression vector exhibited a high level of phosphorylated ERK, an index of RAS signaling (Fig. 7a). Because overexpressing miR‐10b in 293T cells knocked down neurofibromin (Fig. 5c), activated RAS may have directly resulted from loss‐of‐function of neurofibromin. Next we transfected miR‐10b inhibitors or negative controls into ST88‐14 cells. Compared to controls, ST88‐14 cells transfected with the miR‐10b inhibitors exhibited less phosphorylated ERK after serum stimulation (Fig. 7b). Collectively, these results indicated that changes in miR‐10b likely modulate RAS signaling in NF1 MPNST cells. Because neurofibromin was undetectable in ST88‐14 cells (Fig. 1f) and inhibiting miR‐10b did not restore neurofibromin expression (data not shown) in this NF1 MPNST cell line, miR‐10b may target RAS signaling pathways independent of neurofibromin.
Table 2.
Predicted miR‐10b targets that relate to the RAS signaling pathway
| Symbol | Full name of gene | miranda | mirtarget2 | pictar | pita | rna22 | rnahybrid | TargetScan |
|---|---|---|---|---|---|---|---|---|
| ARHGAP12 | Rho GTPase activating protein 12 | 0 | 0 | 1 | 1 | 0 | 1 | 1 |
| BDNF | Brain‐derived neurotrophic factor | 1 | 1 | 1 | 1 | 0 | 1 | 1 |
| GATA3 | GATA binding protein 3 | 1 | 0 | 0 | 1 | 0 | 1 | 0 |
| GATA6 | GATA binding protein 6 | 0 | 0 | 1 | 1 | 0 | 1 | 1 |
| GIMAP8 | GTPase, IMAP family member 8 | 1 | 1 | 0 | 1 | 0 | 1 | 0 |
| GRB2 | Growth factor receptor‐bound protein 2 | 1 | 0 | 0 | 1 | 0 | 1 | 0 |
| KSR2 | Kinase suppressor of ras 2 | 1 | 0 | 0 | 1 | 0 | 1 | 0 |
| MAP3K7 | Mitogen‐activated protein kinase kinase kinase 7 | 1 | 1 | 0 | 1 | 0 | 1 | 1 |
| MAP3K7IP1 | Mitogen‐activated protein kinase kinase kinase 7 interacting protein 1 | 1 | 1 | 0 | 1 | 0 | 1 | 0 |
| MAPKBP1 | Mitogen‐activated protein kinase binding protein 1 | 1 | 0 | 0 | 1 | 0 | 1 | 1 |
| PIK3AP1 | Phosphoinositide‐3‐kinase adaptor protein 1 | 1 | 0 | 0 | 1 | 0 | 1 | 0 |
| PIK3C2G | Phosphoinositide‐3‐kinase, class 2, gamma polypeptide | 1 | 1 | 0 | 1 | 0 | 1 | 0 |
| PTEN | Phosphatase and tensin homolog | 1 | 0 | 0 | 1 | 0 | 1 | 0 |
| RAB37 | RAB37, member RAS oncogene family | 1 | 0 | 0 | 1 | 0 | 1 | 0 |
| RAB3IP | RAB3A interacting protein (rabin3) | 1 | 0 | 0 | 1 | 0 | 1 | 0 |
| RAP2A | RAP2A, member of RAS oncogene family | 1 | 1 | 1 | 1 | 0 | 1 | 1 |
| RAPGEF1 | Rap guanine nucleotide exchange factor (GEF) 1 | 1 | 0 | 0 | 1 | 0 | 1 | 0 |
| RASL10B | RAS‐like, family 10, member B | 1 | 0 | 0 | 1 | 0 | 1 | 0 |
| RASSF2 | Ras association (RalGDS/AF‐6) domain family member 2 | 1 | 0 | 0 | 1 | 0 | 1 | 0 |
| RHOV | Ras homolog gene family, member V | 1 | 0 | 0 | 1 | 0 | 1 | 0 |
1 indicates that interaction is predicted; 0, that interaction is not predicted.
Figure 7.
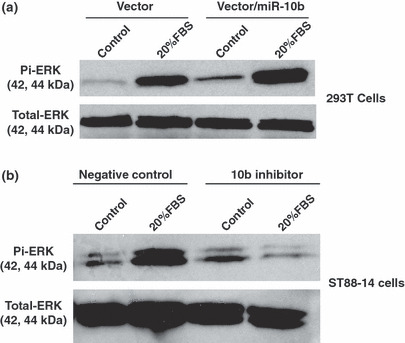
miR‐10b modulated RAS signaling. (a) The MDH1‐PGK‐GFP/miR‐10b (vector/miR‐10b) or MDH1‐PGK‐GFP vector (vector) was transfected into 293T cells. Transfected cells were stimulated with serum free medium (control) or medium supplemented with 20% FBS for 15 min, and phosphorylated ERK and total ERK were analyzed by western blotting. Overexpressing miR‐10b induced higher phosphorylated ERK expression. (b) The miR‐10b inhibitors or negative controls were transfected into NF1 MPNST cells (ST88‐14). Cells were serum‐starved for 24 h, and then incubated in serum‐free medium (control) or medium plus 20% FBS for 15 min. Phosphorylated ERK and total ERK were detected by western blotting. Compared to controls, inhibiting miR‐10b expression reduced phosphorylated ERK in response to serum stimulation.
Discussion
miRNAs play critical roles in tumor development and progression.( 20 , 21 ) Although oncogenic and tumor suppressive roles of several miRNAs have been characterized in several different types of tumors, possible roles of miRNAs in mediating NF1 tumorigenesis and tumor progression remain largely unexplored. Subramanian et al. ( 36 ) recently reported a relative down‐regulation of miR‐34a in most MPNSTs compared to neurofibromas. They concluded that p53 inactivation and subsequent loss of expression of miR‐34a may contribute to MPNST development. In this study we demonstrate that expression level of miR‐10b is significantly higher in NF1 MPNST cell lines, NF1 MPNST tumor tissues, and primary Schwann cells from benign neurofibromas. These results, together with the finding that inhibiting miR‐10b in NF1 MPNST cells reduced cell proliferation, migration, and invasion, suggest an important role for miR‐10b in the genesis of NF1 neurofibromas and their progression to aggressive MPNSTs. We suggest that miR‐10b may serve as a biomarker to distinguish NF1 MPNSTs from non‐NF1 MPNSTs, as the expression level of miR‐10b is significantly higher in the NF1 MPNST cell line and tumor tissues than that in non‐NF1 MPNSTs.
TWIST1, a metastasis‐promoting transcription factor, has been shown to enhance miR‐10b expression via binding to the most proximal E‐box located upstream of the miR‐10b hairpin region.( 30 ) TWIST1 gene expression is up‐regulated in all MPNST cell lines and tissues, compared to normal Schwann cells.( 26 ) In this study we found that TWIST1 expression was higher in ST88‐14 and T265p21 cells than in STS26T cells (Fig. 1f). We speculate that up‐regulation of TWIST1 likely induces higher miR‐10b expression in NF1 MPNSTs.
How miR‐10b regulates NF1 tumorigenesis and progression is likely complex. We showed that miR‐10b targets NF1 mRNA 3′UTR and represses neurofibromin expression in 293T cells (Fig. 5); inhibiting miR‐10b restores neurofibromin expression in SK‐ES‐1 cells (Fig. 6). It is possible that miR‐10b selectively and specifically targets neurofibromin to regulate NF1 tumorigenesis and progression. Studies of Nf1 knockout embryos (Nf1−/−) show that mutant Nf1 gene is transcribed into stable Nf1 mRNA, even in the absence of exon 31, and that mutated Nf1 mRNA is translated into a truncated protein.( 37 ) It is not known if the truncated protein is functional, or if this phenomenon is relevant to human NF1 tumorigenesis. As long as the NF1 mRNA is expressed, miR‐10b can target its 3′UTR to suppress protein expression. Similar to unequal expression of NF1 alleles and NF1 mRNA editing, miRNAs such as miR‐10b may serve as an alternative for LOH of the NF1 to regulate neurofibromin expression, and consequently regulate NF1 tumorigenesis and progression. On the other hand, miR‐10b may also target other genes and signaling pathways to regulate NF1 tumorigenesis and progression. We showed that forced expression of miR‐10b in 293T cells induced a higher phosporylated ERK level (Fig. 7), whereas miR‐10b inhibitors corrected abnormal phosporylated ERK responses in the NF1 MPNST cell line ST88‐14 (Fig. 5), indicating that miR‐10b modulates RAS signaling. miR‐10b has also been found to inhibit translation of mRNA encoding the protein Homeobox D10 (HOXD10) resulting in increased expression of a pro‐metastatic gene, Ras homolog gene family, member C (RHOC).( 30 ) RHOC belongs to the Rho family of GTPases. It has been shown that each of Rho GTPases, including RHOC, is required for RAS‐induced transformation.( 38 , 39 , 40 , 41 ) RAS‐induced transformation can be blocked by pharmacologic inhibition of Rho kinase (ROCK), a key Rho effector.( 42 ) Therefore, miR‐10b may target other molecules at the RAS signaling pathway, such as RHOC( 30 or RAP2A, phosphatase and tensin homolog (PTEN), and Ras homolog gene family, member V (RHOV) (Table 2) to modulate RAS signaling. Hyperactivation of the RAS signaling pathway has been reported to play critical roles in the development of NF1 related tumors.( 43 , 44 , 45 , 46 , 47 ) We speculate that miR‐10b may modulate RAS signaling pathway, and thus regulate NF1 tumorigenesis and progression.
Although our data suggest that miR‐10b may have an important role in NF1 tumorigenesis and tumor progression, a question is whether miR‐10b alone is sufficient to promote NF1 tumorigenesis. Other miRNAs, including miR‐155, miR‐335, let‐7a, and let‐7b, were also significantly deregulated in NF1 MPNST cells and/or tissues, but not in NF1 benign neurofibromas. Changes in expression of these miRNAs may contribute to the pathogenesis of MPNSTs, or may just be a consequence of tumor formation. While inhibiting miR‐155 did not correct any abnormal growth behaviors of NF1 MPNST cells, inhibiting miR‐335 or enhancing let‐7a expression partially corrected some abnormal growth properties of these tumor cells. These findings suggest that changes in miR‐155 may represent a consequence of NF1 MPNST tumor formation, while changes in miR‐335 and let‐7 expression may contribute to progression of NF1 MPNSTs. These speculations are supported by the observation that RAS and Tenascin C are deregulated in NF1 MPNSTs.( 48 ) miR‐335 targets SOX4 and Tenascin C,( 34 ) and let‐7 down‐regulates expression of RAS proto‐oncogene and high‐mobility group A2 (HMGA2).( 35 , 49 ) We speculate miR‐10b may cooperate with other miRNAs, such as miR‐335, let‐7, and early reported miR‐34a ( 36 ) to promote NF1 tumorigenesis and progression. These miRNAs may represent novel targets for effective therapies of NF1 tumors.
Disclosure Statement
The authors have no conflict of interest.
Acknowledgments
This work was supported by the start‐up funds from the Maine Institute for Human Genetics and Health (X.Y.) and grants from the Maine Cancer Foundation (X.Y.), Irvin Oil Company (X.Y.), and the Department of Defense NF Research Program (L.C.).
References
- 1. Riccardi VM, Womack JE, Jacks T. Neurofibromatosis and related tumors. Natural occurrence and animal models. Am J Pathol 1994; 145: 994–1000. [PMC free article] [PubMed] [Google Scholar]
- 2. Gutmann DH, Aylsworth A, Carey JC et al. The diagnostic evaluation and multidisciplinary management of neurofibromatosis 1 and neurofibromatosis 2. JAMA 1997; 278: 51–7. [PubMed] [Google Scholar]
- 3. Evans DG, Baser ME, McGaughran J, Sharif S, Howard E, Moran A. Malignant peripheral nerve sheath tumours in neurofibromatosis 1. J Med Genet 2002; 39: 311–4. [DOI] [PMC free article] [PubMed] [Google Scholar]
- 4. Ducatman BS, Scheithauer BW, Piepgras DG, Reiman HM, Ilstrup DM. Malignant peripheral nerve sheath tumors. A clinicopathologic study of 120 cases. Cancer 1986; 57: 2006–21. [DOI] [PubMed] [Google Scholar]
- 5. Bollag G, McCormick F. Ras regulation. NF is enough of GAP. Nature 1992; 356: 663–4. [DOI] [PubMed] [Google Scholar]
- 6. Kluwe L, Friedrich R, Mautner VF. Loss of NF1 allele in Schwann cells but not in fibroblasts derived from an NF1‐associated neurofibroma. Genes Chromosomes Cancer 1999; 24: 283–5. [DOI] [PubMed] [Google Scholar]
- 7. Rutkowski JL, Wu K, Gutmann DH, Boyer PJ, Legius E. Genetic and cellular defects contributing to benign tumor formation in neurofibromatosis type 1. Hum Mol Genet 2000; 9: 1059–66. [DOI] [PubMed] [Google Scholar]
- 8. Legius E, Marchuk DA, Collins FS, Glover TW. Somatic deletion of the neurofibromatosis type 1 gene in a neurofibrosarcoma supports a tumour suppressor gene hypothesis. Nat Genet 1993; 3: 122–6. [DOI] [PubMed] [Google Scholar]
- 9. Easton DF, Ponder MA, Huson SM, Ponder BA. An analysis of variation in expression of neurofibromatosis (NF) type 1 (NF1): evidence for modifying genes. Am J Hum Genet 1993; 53: 305–13. [PMC free article] [PubMed] [Google Scholar]
- 10. Metheny LJ, Cappione AJ, Skuse GR. Genetic and epigenetic mechanisms in the pathogenesis of neurofibromatosis type I. J Neuropathol Exp Neurol 1995; 54: 753–60. [DOI] [PubMed] [Google Scholar]
- 11. Griesser J, Kaufmann D, Maier B, Mailhammer R, Kuehl P, Krone W. Post‐transcriptional regulation of neurofibromin level in cultured human melano‐cytes in response to growth factors. J Invest Dermatol 1997; 108: 275–80. [DOI] [PubMed] [Google Scholar]
- 12. Cappione AJ, French BL, Skuse GR. A potential role for NF1 mRNA editing in the pathogenesis of NF1 tumors. Am J Hum Genet 1997; 60: 305–12. [PMC free article] [PubMed] [Google Scholar]
- 13. Skuse GR, Cappione AJ. RNA processing and clinical variability in neurofibromatosis type I (NF1). Hum Mol Genet 1997; 6: 1707–12. [DOI] [PubMed] [Google Scholar]
- 14. Kaufmann D, Bartelt B, Hoffmeyer S, Muller R. Posttranslational regulation of neurofibromin content in melanocytes of neurofibromatosis type 1 patients. Arch Dermatol Res 1999; 291: 312–7. [DOI] [PubMed] [Google Scholar]
- 15. Hoffmeyer S, Assum G, Griesser J, Kaufmann D, Nurnberg P, Krone W. On unequal allelic expression of the neurofibromin gene in neurofibromatosis type 1. Hum Mol Genet 1995; 4: 1267–72. [DOI] [PubMed] [Google Scholar]
- 16. Skuse GR, Cappione AJ, Sowden M, Metheny LJ, Smith HC. The neurofibromatosis type I messenger RNA undergoes base‐modification RNA editing. Nucleic Acids Res 1996; 24: 478–85. [DOI] [PMC free article] [PubMed] [Google Scholar]
- 17. Li Y, O’Connell P, Breidenbach HH et al. Genomic organization of the neurofibromatosis 1 gene (NF1). Genomics 1995; 25: 9–18. [DOI] [PubMed] [Google Scholar]
- 18. Haeussler J, Haeusler J, Striebel AM et al. Tumor antigen HuR binds specifically to one of five protein‐binding segments in the 3′‐untranslated region of the neurofibromin messenger RNA. Biochem Biophys Res Commun 2000; 267: 726–32. [DOI] [PubMed] [Google Scholar]
- 19. Lim LP, Lau NC, Garrett‐Engele P et al. Microarray analysis shows that some microRNAs downregulate large numbers of target mRNAs. Nature 2005; 433: 769–73. [DOI] [PubMed] [Google Scholar]
- 20. Hwang HW, Mendell JT. MicroRNAs in cell proliferation, cell death, and tumorigenesis. Br J Cancer 2006; 94: 776–80. [DOI] [PMC free article] [PubMed] [Google Scholar]
- 21. Hwang HW, Mendell JT. MicroRNAs in cell proliferation, cell death, and tumorigenesis. Br J Cancer 2007; 96(Suppl): R40–4. [PubMed] [Google Scholar]
- 22. Rouhi A, Mager DL, Humphries RK, Kuchenbauer F. MiRNAs, epigenetics, and cancer. Mamm Genome 2008; 19: 517–25. [DOI] [PubMed] [Google Scholar]
- 23. Visone R, Croce CM. MiRNAs and cancer. Am J Pathol 2009; 174: 1131–8. [DOI] [PMC free article] [PubMed] [Google Scholar]
- 24. Jacob A, Lee TX, Neff BA, Miller S, Welling B, Chang LS. Phosphatidylinositol 3‐kinase/AKT pathway activation in human vestibular schwannoma. Otol Neurotol 2008; 29: 58–68. [DOI] [PubMed] [Google Scholar]
- 25. Muir D, Neubauer D, Lim IT, Yachnis AT, Wallace MR. Tumorigenic properties of neurofibromin‐deficient neurofibroma Schwann cells. Am J Pathol 2001; 158: 501–13. [DOI] [PMC free article] [PubMed] [Google Scholar]
- 26. Miller SJ, Rangwala F, Williams J et al. Large‐scale molecular comparison of human schwann cells to malignant peripheral nerve sheath tumor cell lines and tissues. Cancer Res 2006; 66: 2584–91. [DOI] [PubMed] [Google Scholar]
- 27. Barkan B, Starinsky S, Friedman E, Stein R, Kloog Y. The Ras inhibitor farnesylthiosalicylic acid as a potential therapy for neurofibromatosis type 1. Clin Cancer Res 2006; 12: 5533–42. [DOI] [PubMed] [Google Scholar]
- 28. Miki T, Yano S, Hanibuchi M, Sone S. Bone metastasis model with multiorgan dissemination of human small‐cell lung cancer (SBC‐5) cells in natural killer cell‐depleted SCID mice. Oncol Res 2000; 12: 209–17. [DOI] [PubMed] [Google Scholar]
- 29. Livak KJ, Schmittgen TD. Analysis of relative gene expression data using real‐time quantitative PCR and the 2(‐Delta Delta C(T)) Method. Methods 2001; 25: 402–8. [DOI] [PubMed] [Google Scholar]
- 30. Ma L, Teruya‐Feldstein J, Weinberg RA. Tumour invasion and metastasis initiated by microRNA‐10b in breast cancer. Nature 2007; 449: 682–8. [DOI] [PubMed] [Google Scholar]
- 31. Fletcher JA, Kozakewich HP, Hoffer FA et al. Diagnostic relevance of clonal cytogenetic aberrations in malignant soft‐tissue tumors. N Engl J Med 1991; 324: 436–42. [DOI] [PubMed] [Google Scholar]
- 32. Garzon R, Garofalo M, Martelli MP et al. Distinctive microRNA signature of acute myeloid leukemia bearing cytoplasmic mutated nucleophosmin. Proc Natl Acad Sci U S A 2008; 105: 3945–50. [DOI] [PMC free article] [PubMed] [Google Scholar]
- 33. Eis PS, Tam W, Sun L et al. Accumulation of miR‐155 and BIC RNA in human B cell lymphomas. Proc Natl Acad Sci U S A 2005; 102: 3627–32. [DOI] [PMC free article] [PubMed] [Google Scholar]
- 34. Tavazoie SF, Alarcon C, Oskarsson T et al. Endogenous human microRNAs that suppress breast cancer metastasis. Nature 2008; 451: 147–52. [DOI] [PMC free article] [PubMed] [Google Scholar]
- 35. Johnson SM, Grosshans H, Shingara J et al. RAS is regulated by the let‐7 microRNA family. Cell 2005; 120: 635–47. [DOI] [PubMed] [Google Scholar]
- 36. Subramanian S, Thayanithy V, West RB et al. Genome‐wide transcriptome analyses reveal p53 inactivation mediated loss of miR‐34a expression in malignant peripheral nerve sheath tumours. J Pathol 2009; 220: 58–70. [DOI] [PMC free article] [PubMed] [Google Scholar]
- 37. Jacks T, Shih TS, Schmitt EM, Bronson RT, Bernards A, Weinberg RA. Tumour predisposition in mice heterozygous for a targeted mutation in Nf1. Nat Genet 1994; 7: 353–61. [DOI] [PubMed] [Google Scholar]
- 38. Khosravi‐Far R, Solski PA, Clark GJ, Kinch MS, Der CJ. Activation of Rac1, RhoA, and mitogen‐activated protein kinases is required for Ras transformation. Mol Cell Biol 1995; 15: 6443–53. [DOI] [PMC free article] [PubMed] [Google Scholar]
- 39. Prendergast GC, Khosravi‐Far R, Solski PA, Kurzawa H, Lebowitz PF, Der CJ. Critical role of Rho in cell transformation by oncogenic Ras. Oncogene 1995; 10: 2289–96. [PubMed] [Google Scholar]
- 40. Qiu RG, Chen J, Kirn D, McCormick F, Symons M. An essential role for Rac in Ras transformation. Nature 1995; 374: 457–9. [DOI] [PubMed] [Google Scholar]
- 41. Qiu RG, Chen J, McCormick F, Symons M. A role for Rho in Ras transformation. Proc Natl Acad Sci U S A 1995; 92: 11781–5. [DOI] [PMC free article] [PubMed] [Google Scholar]
- 42. Sahai E, Ishizaki T, Narumiya S, Treisman R. Transformation mediated by RhoA requires activity of ROCK kinases. Curr Biol 1999; 9: 136–45. [DOI] [PubMed] [Google Scholar]
- 43. DeClue JE, Papageorge AG, Fletcher JA et al. Abnormal regulation of mammalian p21ras contributes to malignant tumor growth in von Recklinghausen (type 1) neurofibromatosis. Cell 1992; 69: 265–73. [DOI] [PubMed] [Google Scholar]
- 44. Basu TN, Gutmann DH, Fletcher JA, Glover TW, Collins FS, Downward J. Aberrant regulation of ras proteins in malignant tumour cells from type 1 neurofibromatosis patients. Nature 1992; 356: 713–5. [DOI] [PubMed] [Google Scholar]
- 45. Bollag G, Clapp DW, Shih S et al. Loss of NF1 results in activation of the Ras signaling pathway and leads to aberrant growth in haematopoietic cells. Nat Genet 1996; 12: 144–8. [DOI] [PubMed] [Google Scholar]
- 46. Feldkamp MM, Angelov L, Guha A. Neurofibromatosis type 1 peripheral nerve tumors: aberrant activation of the Ras pathway. Surg Neurol 1999; 51: 211–8. [DOI] [PubMed] [Google Scholar]
- 47. Ingram DA, Hiatt K, King AJ et al. Hyperactivation of p21(ras) and the hematopoietic‐specific Rho GTPase, Rac2, cooperate to alter the proliferation of neurofibromin‐deficient mast cells in vivo and in vitro . J Exp Med 2001; 194: 57–69. [DOI] [PMC free article] [PubMed] [Google Scholar]
- 48. Levy P, Ripoche H, Laurendeau I et al. Microarray‐based identification of tenascin C and tenascin XB, genes possibly involved in tumorigenesis associated with neurofibromatosis type 1. Clin Cancer Res 2007; 13: 398–407. [DOI] [PubMed] [Google Scholar]
- 49. Park SM, Shell S, Radjabi AR et al. Let‐7 prevents early cancer progression by suppressing expression of the embryonic gene HMGA2. Cell Cycle 2007; 6: 2585–90. [DOI] [PubMed] [Google Scholar]