Abstract
The epidermal growth factor receptor (EGFR) tyrosine kinase inhibitor (E‐TKI) resistance has emerged as an important clinical issue. To overcome this resistance, researchers have examined different modalities, either for use as a monotherapy or in combination with E‐TKI therapy. In the present study, we investigated whether a decrease in nitric oxide (NO) levels affects the radiosensitization of non‐small cell lung cancer (NSCLC) cell lines. A549 and H3255 NSCLC cells were examined. They were subjected to hypoxic conditions and monotherapy, or combined therapy using radiation and N G‐monomethyl‐l‐arginine, monoacetate (LNMMA). Reductions in nitric oxide levels enhanced the radiosensitivity of both cell lines and significantly reduced the expression of both hypoxia‐inducible factor‐1α (HIF‐1α) and EGFR in H3255 cells compared to A549 cells. Since NO is significantly associated with cell metabolism, we measured the levels of pyruvate dehydrogenase kinase‐1 (PDK‐1), reactive oxygen species, and oxygen and observed that the expression of PDK‐1 was significantly reduced. This reduction was seen simultaneously after the silencing of HIF‐1α; however, not following LNMMA treatment. The oxygen concentration was significantly increased in the treated cells, and their viability decreased in parallel. Reactive oxygen species were decreased after LNMMA and radiation treatment. Adding EGFR–TKI to cells with reduced NO levels further suppressed cell viability when combined with radiation. This study suggests that a reduction in the NO level might substantially overcome the radioresistance of mutant NSCLC cells. (Cancer Sci 2011; 102: 2150–2156)
The epidermal growth factor receptor (EGFR) signaling pathway plays a major role in cell proliferation and survival. Therefore, the inhibition of the pathway represents a promising cancer treatment strategy.( 1 ) In addition, preclinical and clinical studies have shown that treatment with EGFR tyrosine kinase inhibitor (E‐TKI) therapy enhances the antitumor effect of ionizing radiation.( 2 , 3 , 4 ) However, several factors, such as mutations and hypoxia, have presented as important issues affecting treatment strategies targeting EGFR. Non‐small cell lung cancer (NSCLC) specimens with mutant EGFR have been reported to exhibit mutations in multiple oncogenes and tumor suppressors. Other studies with resected NSCLC tumor specimens have showed that hypoxic tumors confer a worse prognosis.( 5 , 6 )
Hypoxia‐inducible factor‐1α (HIF‐1α) is a heterodimeric basic helix–loop–helix structure composed of alpha and beta subunits. Hypoxia‐inducible factor‐1α is well known for its prominent expression in hypoxic cells,( 7 ) and has been found to regulate cell metabolism through the upregulation of pyruvate dehydrogenase kinase‐1 (PDK‐1). Pyruvate dehydrogenase kinase‐1 phosphorylates and inactivates pyruvate dehydrogenase, a mitochondrial enzyme that catalyzes the conversion of pyruvate to acetyl‐CoA. In turn, acetyl‐CoA depletion affects mitochondrial respiration.( 8 , 9 )
Nitric oxide (NO) is an endogenous regulator involved in numerous biological signaling pathways. Nitric oxide is synthesized from l‐arginine by nitric oxide synthase (NOS) isoenzymes. It is increasingly evident that NOS activity is associated with human diseases, and contributes to cell death by affecting apoptosis.( 10 , 11 ) Moreover, ionizing radiation has been shown to enhance the NOS expression level, thus increasing NO concentrations in irradiated cells.( 12 )
Similar to HIF‐1α, NO regulates cellular oxygen consumption via the reduction of mitochondrial enzyme activity, including that of aconitase in the Krebs cycle, as well as complex I and complex II of the mitochondrial electron transport chain, which leads to a decrease in the utilization of oxygen by the cells.( 13 , 14 , 15 , 16 , 17 )
On the basis of these data, we investigated the role of NO in two hypoxic lung cancer cell lines with different EGFR statuses following radiation treatment. We hypothesized that NO levels present in the culture media reflected the concentration in the cancer cells. Therefore, we planned to inhibit NO by utilizing the highly‐selective NOS inhibitor N G‐monomethyl‐l‐arginine, monoacetate (LNMMA). We also evaluated the role of NO in hypoxic cancer cells by evaluating their metabolism and survival in response to treatment.
Materials and Methods
N G‐monomethyl‐l‐arginine, monoacetate was purchased from Calbiochem (Darmstadt, Germany). All culture media and FBS were purchased from Life Technologies (Grand Island, NY, USA). The V‐FITC apoptosis detection kit was acquired from Invitrogen (Minato‐ku, Tokyo, Japan). The primary antibodies were specific for the following proteins: HIF‐1α, inducible nitric oxide synthases (iNOS) (BD Transduction Laboratories, San Jose, CA, USA), phosphorylated epidermal growth factor receptor (pEGFR) (Cell Signaling, Danvers, MA, USA), and β‐actin (Chemicon International, Temecula, CA, USA). The ECL chemiluminescent reagents were purchased from GE Healthcare (Buckinghamshire, UK), and ChemiStage CC16mini was acquired from WealTec (Meadowvale Way Sparks, NV, USA). Gefitinib was purchased from Tocris Bioscience (Ellisville, MO, USA).
Cell culture. Two NSCLC cell lines were used in the present study: A549 cells expressing wild‐type EGFR, and H3255 cells with somatic mutations in the tyrosine kinase domain of the EGFR (L858R [Leu→Arg]). All culture media (except for that used for the transfected cells) were supplemented with 10% FBS, penicillin (100 U/mL) and streptomycin (100 μg/mL). Cultures were maintained in a humidified atmosphere containing 5% CO2 at 37°C. A total of 5 × 10⁵ cells from each cell line were plated per 6‐cm dish, and were transfected with 2 μg of pCEP4/HIF‐1α (ATCC, Manassas, VA, USA) using LipofectAMINE‐Plus, according to the manufacturer’s instructions (QIAGEN, Valencia, CA, USA). Both cultured cell lines were subjected to either no treatment, treatment with 5 Gy radiation alone, or treatment with LNMMA + radiation.
Hypoxic chamber. The cells were incubated in a hypoxic chamber that was flushed with 5% CO2 and 95% nitrogen (N). The hypoxic conditions were kept between 1 and 3 mmHg (0.14–1% oxygen, v/v; hypoxic conditions). The oxygen concentration was assessed by using an oxygen electrode (POG‐203‐S1; Unique Medical, Osaka, Japan).
Nitric oxide measurement. We evaluated NO concentrations by measuring the accumulated concentration of nitrite in the culture media 24 h after treating the cells. We used Griess reagent, as recommended by BioVision (Palo Alto, CA, USA). Briefly, 100 μL of the culture supernatant was reacted with 100 μL of Griess reagent for 10 min at room temperature. The concentration of nitrite was measured in triplicate by measuring the absorbance at 540 nm (Bio‐Rad microplate reader; Bio‐Rad, Hercules, CA, USA), and was calculated from a standard curve for sodium nitrite.
Detection of reactive oxygen species. To assess reactive oxygen species (ROS), a quantitative estimation of the intracellular ROS level was done utilizing the Image‐iT live green reactive oxygen species detection kit (Invitrogen, Eugene, OR, USA), which uses 5‐(and‐6)‐carboxy‐2′,7′‐dichlorodihydrofluorescein diacetate as fluorogenic markers for ROS in live cells. The assay was performed according to the manufacturer’s instructions. The stained cells were photographed using Keyence BZ‐9000, and analyzed using a Keyence BZ‐Analyzer (Keyence, Osaka, Japan).
siRNA duplexes and transfection. An siRNA was designed to target HIF‐1α nucleotides (5′‐AGAGGUGGAUAUGUGUGGG), and its effects were subsequently evaluated using the HiPerformance Design Algorithm (Dharmacon, Waltham, MA, USA). A negative control siRNA (5′‐AATTCTCCGAACGTGTCACGT) was used to monitor the transfection efficiency. The cells were transfected with siRNA duplexes using the HiPerfect transfection reagent (DharmaFECT; Dharmacon), according to the manufacturer’s instructions.
Flow cytometric analysis of apoptosis. We examined apoptosis in both cell lines. Single‐cell suspensions of 1 × 10⁶ cells were plated in 35‐mm culture dishes. After approximately 24 h, the cells were treated as described earlier. Thereafter, the cells were incubated for another 24 h, followed by trypsinization. Annexin V binding was then assayed using the V‐FITC apoptosis detection kit according to the manufacturer’s instructions. The cells were then analyzed by a FACS (Nippon Becton‐Dickinson, Tokyo, Japan).
Survival assay. A549 cells from a stock culture were trypsinized, diluted to the appropriate number of cells (1000 cells), and seeded into 60‐mm culture dishes. After treatment, the cells were incubated for 24 h, and the medium in each culture dish was replaced with fresh medium. The cells were then left for 14 days. After fixation and Giemsa staining, colonies containing at least 50 cells were counted. The surviving fraction of cells was calculated according to the following equation: (no. colonies formed/[number of cells plated × plating efficiency]).
Cell proliferation assay. H3255 and A549 cells were plated at 1 × 10⁴/well in 96‐well plates. After the cells had attached, they were treated as described earlier. Thereafter, 20 μL of 4‐(3‐[4‐iodophenyl]‐2‐[4‐nitrophenyl]‐2H‐5‐tetrazolio)‐1,3‐benzenedisulfonate (WST‐1) was added to each well, followed by a 4 h of incubation, according to the manufacturer’s recommendations (Roche Diagnostics GmbH; Mannheim, Germany). In this assay, the amount of WST‐1 formazan produced by mitochondrial dehydrogenases was an indicator of the number of viable cells.
Western blotting analysis. Equal amounts of lysate protein (50 μg) from the treated cells were resolved using an SDS‐PAGE slab gel (7.5%), and separated proteins were then transferred to SDS membranes (Bio‐Rad). The membranes were blocked using 5% non‐fat, dry milk diluted in 50 mM Tris at pH 7.5, 0.9% NaCl. and 0.1% Tween 20. The primary antibodies were specific for the following proteins: HIF‐1α, iNOS, PDK‐1, EGFR and β‐actin. The Western blots were visualized using ECL chemiluminescent reagents and ChemiStage CC16mini.
Real‐time PCR. We used a quantitative RT‐PCR assay to measure the mRNA levels of HIF‐1α, PDK‐1, iNOS, and EGFR, utilizing a CYBR Green Cells‐to‐Ct kit following the manufacturer’s instructions (Applied Biosystems, Foster City, CA, USA). The primers used for the real‐time PCR are shown in Table 1. For each primer pair, a melting curve analysis was used to confirm the presence of a single amplicon. The samples were evaluated using 1 mM of each primer and 4 μL of the cDNA product, in a total volume of 20 μL. The values for the relative quantitation were calculated using the cycle threshold values for each sample, tested in triplicate.
Table 1.
PCR primers used in this study
| Gene | Forward primer | Reverse primer |
|---|---|---|
| HIF‐1α | 5′‐TGCTTGGTGCTGATTTGTGA‐3′ | 5′‐GGTCAGATGATCAGAGTCCA‐3′ |
| PDK‐1 | 5‐CCG CTC TCC ATG AAG CAG TT‐3′ | 5′‐ TTG CCG CAG AAA CAT AAA‐3′ |
| iNOS | 5′‐CCCTTCCGAAGTTTCTGGCAGCAGC‐3′ | 5′‐GGCTGTCAGAGCCTCGTGGCTTTGG‐3′ |
| EGFR | 5′‐GCCACTTGAGGATATTAAAGGA‐3′ | 5′‐GATTTTCACTTTCTCGCCTTCTG‐3′ |
| GAPDH | 5′‐GAAGGTGAAGGTCGGAGTC‐3′ | 5′‐GAAGATGGTGATGGGATTTC‐3′ |
EGFR, epidermal growth factor receptor; HIF‐1α, hypoxia‐inducible factor‐1α; iNOS; inducible nitric oxide synthases, PDK‐1, pyruvate dehydrogenase kinase‐1.
Statistical analysis. Statistical significance was estimated using Student’s t‐test for unpaired observations. In the Western blot analysis, a linear correlation between the increasing amounts of input protein and signal intensity was observed (correlation coefficients were higher than 0.84). The data shown are the means ± SEM. A value of P < 0.05 was considered to be significant.
Results
Effect of NO level on the accumulation/de‐accumulation of HIF‐1α. To investigate the effect of NO on HIF‐1α accumulation, the hypoxic cells were treated with 100 μM of LNMMA, 5 Gy X‐rays (radiation), or LNMMA + 5 Gy. Untreated cells were handled simultaneously with the treated groups. The PCR (Fig. 1a) and Western blot analysis (Fig. 1b) data showed that the addition of LNMMA downregulated HIF‐1α expression in both cell lines. This was obvious when cells with reduced NO levels and exposure to radiation (0.45 ± 0.02 and 0.29 ± 0.0, respectively) were compared to cells exposed to radiation only (0.59 ± 0.01 and 1.29 ± 0.34, respectively; P = 0.03 and P = 0.01 in A549 and H3255 cells, respectively).
Figure 1.
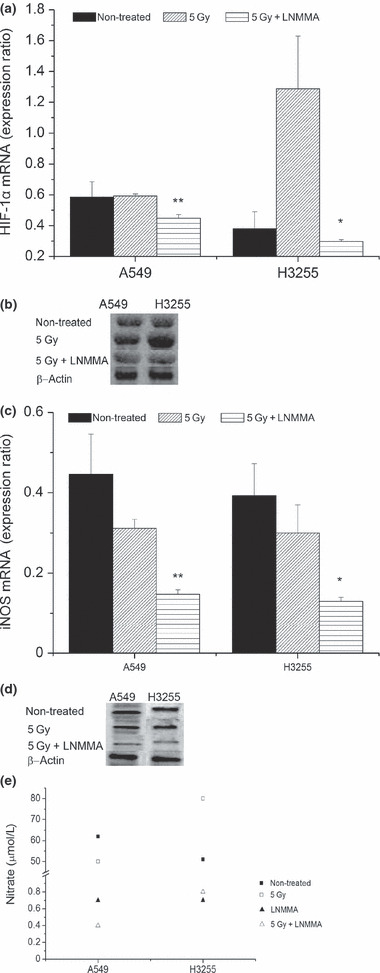
Hypoxia‐inducible factor‐1α (HIF‐1α) is affected by nitric oxide (NO) reduction in hypoxic lung cancer cells. Expression of HIF‐1α was reduced with combined treatment in H3255 (*P = 0.01) and A549 (**P = 0.08) cells (a,b). Inducible nitric oxide synthases (iNOS) level was confirmed following the treatment with N G‐monomethyl‐l‐arginine, monoacetate (LNMMA) in both cell lines (P = 0.03 and P = 0.06, in A549 and H3255, respectively) (c,d). Consequently, more than 98% reduction in nitrate concentration in the culture media was detected (e). Values are expressed as the means ± SEM of three independent sets of data.
The iNOS expression level was measured to confirm the efficacy of LNMMA by utilizing PCR (Fig. 1c) and the Western blot analysis (Fig. 1d). Both cell lines showed comparable responses after exposure to LNMMA. To confirm the reduction in NO, we measured the concentration of nitrite, a metabolite of NO, in the culture medium (Fig. 1e) of all groups. The concentration of nitrite was reduced by up to 98% compared to the untreated groups.
Detection of ROS. Reactive oxygen species production was detected by employing the Image‐iT live green reactive oxygen species detection kit. Reactive oxygen species were detected in live cells that had been subjected to the same treatments as those described earlier. As expected, the ROS level increased more in the irradiated cells (58 ± 12% and 35 ± 5% in A549 and H3255 cells, respectively) than in the non‐irradiated cells (26 ± 3% and 16 ± 5% in A549 and H3255 cells, respectively; Fig. 2a,b). However, the expression levels dramatically decreased in both cell lines when the NO level was reduced in the irradiated hypoxic cells, although this effect was more obvious in H3255 cells (21 ± 6% and 7 ± 3% in A549 and H3255 cells, respectively, P = 0.03).
Figure 2.
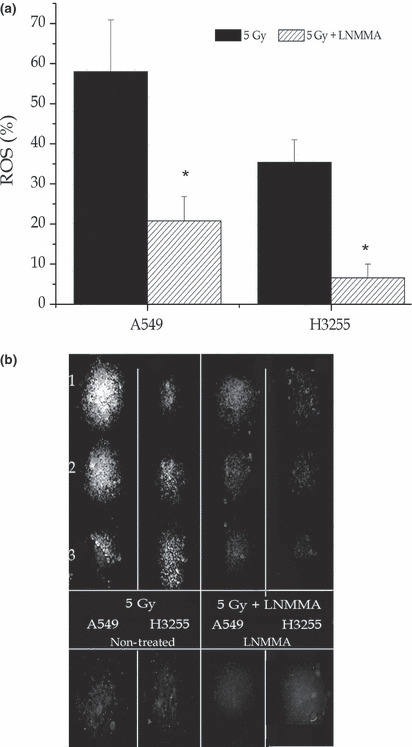
Reactive oxygen species (ROS). By employing an Image‐iT live green reactive oxygen species detection assay and three cultures sets showed increased ROS levels when the cells were exposed to radiation (a,b) compared to those that were untreated (b). However, florescence was dramatically reduced following exposure to combined treatment (a,b) *P = 0.03). Values are expressed as the means ± SEM of three independent sets of data. LNMMA, N G‐monomethyl‐l‐arginine, monoacetate.
Effects of NO level on cell metabolism. We examined the PDK‐1 level with regard to the NO level. In hypoxic A549 cells, there was an almost 22% reduction in PDK‐1 expression after exposure to radiation in cells treated with LNMMA (0.79 ± 0.06) compared to the group treated with radiation alone (1.01 ± 0.08, P = 0.06) at both the mRNA (Fig. 3a) and protein (Fig. 3b) levels. Similarly, H3255 cells showed an almost 40% reduction in PDK‐1 expression after combination treatment (0.58 ± 0.02) compared to the group treated with only radiation (0.96 ± 0.11, P = 0.04) (Fig. 3a,b).
Figure 3.
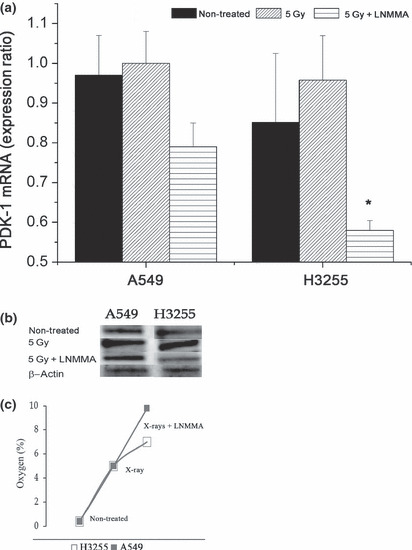
Pyruvate dehydrogenase kinase‐1 (PDK‐1) expression after combined treatment. Expression of PDK‐1 following exposure to combined treatment was decreased by 22% in A549 cells, and by 40% in H3255 cells. *P = 0.04 (a,b). Oxygen concentration increased significantly during the first 24 h, up 9.8% and 7% in A549 and H3225 cells, respectively after combined treatment (c). Values are expressed as the means ± SEM of three independent sets of data. LNMMA, N G‐monomethyl‐l‐arginine, monoacetate.
Oxygen distribution in the cultured cells. The oxygen level was assessed by using an oxygen electrode. Twenty‐four hours after exposing the hypoxic cells to LNMMA and radiation, the oxygen levels were increased by 9.8% and 7% in A549 and H3255 cells, respectively, compared to 1–2% increases in both the untreated and the radiation‐only group (Fig. 3c).
Expression of NO and PDK‐1. Since HIF‐1α is considered to be the main PDK‐1 regulator during hypoxia, we subsequently performed experiments to test whether reductions in NO levels would directly affect PDK‐1 downstream signaling. The treatment of cells with HIF‐1α siRNA was associated with an almost 70% reduction in PDK‐1 at both the mRNA (Fig. 4a) and protein (Fig. 4b) levels. The HIF‐1α expression level was confirmed to be downregulated (Fig. 4c). However, adding LNMMA to the HIF‐1α‐silenced cells resulted in no further reductions in PDK‐1 expression (data not shown).
Figure 4.
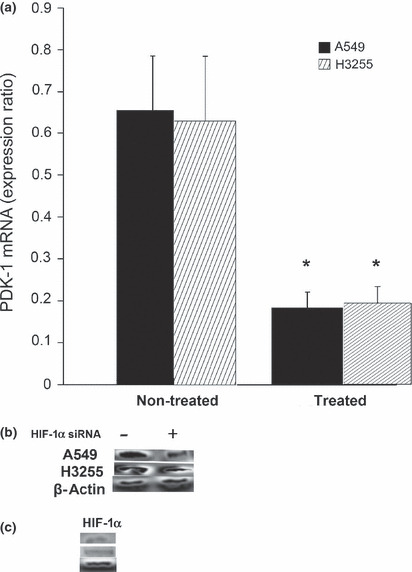
Pyruvate dehydrogenase kinase‐1 (PDK‐1) level following hypoxia‐inducible factor‐1α (HIF‐1α) silencing. There was a considerable reduction in both the mRNA (a) and protein level (b) of PDK‐1 in the treated cells compared to the untreated cells. *P = 0.03. Decrease in HIF‐1α protein expression was confirmed simultaneously (c). Values are expressed as the means ± SEM of three independent sets of data.
Survival of cells with a low NO level. The radiosensitivity of A549 cells was enhanced when they were treated with LNMMA and radiation. Apoptosis increased by 40% compared to the untreated group, and by 32% compared to the cells exposed to radiation alone (Fig. 5a). This enhancement was similar in the H3255 cells, although apoptosis was lower compared to the A549 cells (Fig. 5b). Moreover, apoptosis increased by 21% in these cells when LNMMA was given with radiation compared to the untreated cells, whereas it increased by 16% compared to cells exposed to radiation alone (Fig. 5a,b). Nonetheless, with a plating efficiency of more than 87%, the surviving fraction of the A549 cells was reduced by radiation alone (0.27 ± 0.02, P < 0.01), but no additional effect was observed after combined treatment (0.30 ± 0.01; Fig. 6a). Following the addition of gefitinib to the combined treatment, the number of colonies appeared to be affected, although the effect was not significant (P = 0.1). In contrast, the cell proliferation assay showed a reduction in the proliferation of H3255 cells with combined treatment. Further significant reductions in the proliferation of both cell lines were detected when gefitinib was added to LNMMA and radiation treatment (P < 0.01; Fig. 6b). However, neither LNMMA nor gefitinib reduced cell proliferation further when combined with radiation (data not shown).
Figure 5.
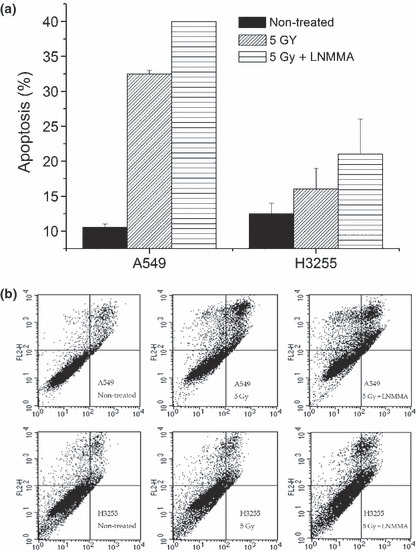
Induction of apoptosis was detected by flow cytometry. Apoptotic percentage was higher in the combined treatment group compared to the group exposed to radiation alone (a), and also the untreated group (b) in both cell lines. Values are expressed as the means ± SEM of three independent sets of data. LNMMA, N G‐monomethyl‐l‐arginine, monoacetate.
Figure 6.
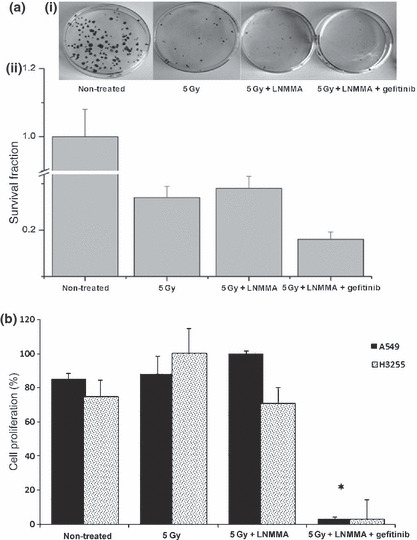
Clonogenic assay. Plate efficiency (PE)‐labeled fraction in the untreated group was over 87% of the A549 cells (a), and following radiation, the surviving fraction was significantly reduced (P < 0.01). Nevertheless, combining both N G‐monomethyl‐l‐arginine, monoacetate (LNMMA) and gefitinib with irradiation led to an obvious reduction in cell survival (a) and proliferation (*P < 0.01) (b). Values are expressed as the means ± SEM of three independent sets of data. LNMMA, N G‐monomethyl‐l‐arginine, monoacetate.
Epidermal growth factor receptor status and the influence of NO. Finally, we investigated the differences in the expression of pEGFR in both cancer cell lines. Both the PCR (Fig. 7a) and Western blot analysis (Fig. 7b) data showed that the irradiated hypoxic H3255 cells highly expressed pEGFR (1.24 ± 0.38). The level of pEGFR was significantly lower in cells receiving combined treatment (0.32 ± 0.02, P = 0.01) than in cells receiving radiation alone. In contrast, in the hypoxic A549 cells, the pEGFR expression level (0.817 ± 0.02) was affected by radiation alone (0.431 ± 0.017), and was further reduced when the cells were exposed to the combination treatment (0.347 ± 0.02), although this increase was not significant (P = 0.1).
Figure 7.
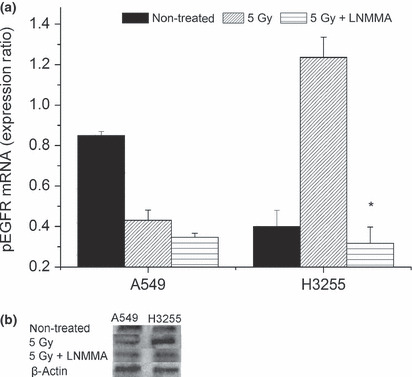
Phosphorylated epidermal growth factor receptor (pEGFR) was affected by the nitric oxide level. After the combined treatment, H3255 cells showed a significant reduction in the pEGFR expression (*P = 0.01), which was also observed to a lesser extent in A549 cells (P = 0.1) in comparison to the irradiated group (a,b). Values are expressed as the means ± SEM of three independent sets of data. LNMMA, N G‐monomethyl‐l‐arginine, monoacetate.
Discussion
It has been reported that the exposure of lung cancer cells to hypoxia induces EGFR expression( 18 , 19 ) via early growth response factor‐1.( 19 ) Nitric oxide appears to play a role in modulating the hypoxic EGFR response, and we found that a reduced NO level affected the expression of HIF‐1α and pEGFR in two different lung cancer cell lines. The reduced NO level simultaneously affected both the HIF‐1α and EGFR levels, particularly in the irradiated hypoxic cells. Signal transducer and activator of transcription 3 (STAT‐3) seems to link nuclear EGFR and iNOS activation, because the promoter of the gene encoding STAT‐3 contains regulatory elements for both these molecules. Thus, when NO is suppressed, it has a major role in cell viability and stability.( 20 ) Even a low concentration of NO has the capacity to inhibit HIF‐1α accumulation, because of its ability to inhibit mitochondrial respiration, and leads to an increased oxygen concentration. Oxygen in turn re‐activates prolyl hydroxylases (PHD) that target HIF‐1α for proteolysis via the von Hippel–Lindau protein.( 14 , 21 , 22 )
Because HIF‐1α and NO play major roles in cell metabolism,( 10 , 11 , 12 , 13 , 14 , 15 , 16 ) it was not surprising that a reduction in NO indirectly downregulated PDK‐1. The knockdown of HIF‐1α indicated that the PDK‐1 reduction was directly related to the reduction in HIF‐1α expression. Moreover, the addition of LNMMA, either with or without radiation, did not further reduce the expression of PDK‐1 (data not shown). Hypoxia‐induced mitochondrial ROS production has been shown to be controlled by HIF‐1α via its effect on PDK‐1 expression.( 23 ) This step is important to prevent the overproduction of ROS, thereby preventing cell toxicity.( 12 , 24 ) However, other studies have shown that the production of mitochondrial ROS is essential in promoting the activation of HIF‐1α.( 24 , 25 , 26 ) In the present study, it was expected that reductions in the HIF‐1α and PDK‐1 levels would promote ROS production following treatment with LNMMA. However, our study showed that there was a reduction in the ROS level when the NO concentration was reduced. This could result from the ability of LNMMA to inhibit the production of ROS through the inhibition of iNOS.( 27 ) Additionally, the mitochondrial production of ROS has been linked to the translocation of NF‐κB to the nucleus as a hypoxic stress signaling response.( 28 ) The activation of NF‐κB could be also be attenuated by treatment with LNMMA.( 29 ) Thus, ROS production appears to be affected by multiple pathways.
At very low concentrations of NO, that activate soluble guanylyl cyclase (sGC), NO can bind to cytochrome c oxidase (complex IV) in competition with oxygen in a reversible manner.( 30 , 31 ) Interestingly, we observed that the oxygen concentration increased in the treated culture cells within 2 h of treatment. This concentration did not increase more than sevenfold to 10‐fold above that of the untreated group during the 24‐h period. Thus, a very low concentration of NO still has the ability to preserve a certain amount of intracellular oxygen, which will destabilize HIF‐1α. This might in turn enhance cell death via the caspase cascade( 32 , 33 ) or by blocking NOS‐1 or NOS‐2.( 34 , 35 ) In the current study, a colony assay showed no additive effect in A549 cells. Because plating densities lower than 1200 cells/mL are not clonogenic for H3255 cells, we did not evaluate its clonogenicity. However, apoptosis and cell proliferation were affected in H3255 cells. Although the colony formation assay is generally considered to be a reliable method of measuring overall cell killing,( 36 ) this method might not always be accurate for assessing cell sensitivity to various treatments, especially as it does not distinguish between apoptosis and cell cycle arrest.( 37 ) In addition, variations in the cell density during treatment in each assay might affect the outcome.( 38 )
Radiation, as a treatment option, might enhance the expression of certain protein kinases that lead to radioresistance progression.( 39 , 40 ) In the present study, irradiated cells consistently overexpressed HIF‐1α and EGFR. In such cases, combined therapy would be a superior modality and should be considered. It becomes obvious that therapy resistance in hypoxic mutant cells might be related to the dominant expression of HIF‐1α and EGFR.( 18 , 41 ) Moreover, the approaches used to target EGFR face many challenges, despite the rapid advances in E‐TKI therapy. For instance, a substantial number of cancer patients do not respond to the EGFR inhibitor therapy, which implies the presence of underlying resistance.( 42 , 43 ) Even in those patients who do achieve a clear tumor response to E‐TKI, many will eventually manifest disease progression.
In the present study, gefitinib was promising in combination treatment, although the effect was only evaluated by assessing cell viability. Moreover, we did not evaluate the EGFR downstream signaling pathways, such as the Ras–Raf–MAPK( 43 ) and PI3K/Akt pathways.( 44 , 45 ) In addition, there are many known mutated EGFR cell lines, such as PC9, H1975, and H820. These will need to be investigated to confirm the overall concept concerning the effects of a reduced level of NO with or without E‐TKI on EGFR wild‐type and mutant cells.
In conclusion, a reduction of NO in hypoxic lung cancer cells enhanced their radiosensitivity by destabilizing major proteins, such HIF‐1α and EGFR. Nitric oxide synthase inhibitors might play a substantial role in countering EGFR tyrosine kinase inhibitor resistance and exhibit a positive effect when combined with E‐TKI therapy. However, these findings need further confirmation.
Disclosure Statement
The authors declare that there is no conflict of interest.
Acknowledgments
We would like to thank Dr Hiroyuki Yamazaki and Ms Masako Shin for their technical assistance. This study was supported by the Japanese Society for the Promotion of Sciences.
References
- 1. Scagliotti GV, Selvaggi G, Novello S et al. The biology of epidermal growth factor receptor in lung cancer. Clin Cancer Res 2004; 10: 4227s–32s. [DOI] [PubMed] [Google Scholar]
- 2. Huang SM, Bock JM, Harari PM. Epidermal growth factor receptor blockade with C225 modulates proliferation, apoptosis and radiosensitivity in squamous cell carcinomas of head and neck. Cancer Res 1999; 59: 1935–40. [PubMed] [Google Scholar]
- 3. Bonner JA, Harari PM, Giralt J et al. Radiotherapy plus cetuximab for squamous‐cell carcinoma of head and neck. N Engl J Med 2006; 354: 567–78. [DOI] [PubMed] [Google Scholar]
- 4. Sartor CI. Epidermal growth factor family receptors and inhibitors: radiation response modulators. Semin Radiat Oncol 2003; 13: 22–30. [DOI] [PubMed] [Google Scholar]
- 5. Giatromanolaki A, Koukourakis MI, Sivridis E et al. Relation of hypoxia inducible factor 1 alpha and 2 alpha in operable non‐small cell lung cancer to angiogenic/molecular profile of tumours and survival. Br J Cancer 2001; 85: 881–90. [DOI] [PMC free article] [PubMed] [Google Scholar]
- 6. Swinson DE, Jones JL, Cox G et al. Hypoxia‐inducible factor‐1 alpha in non small cell lung cancer: relation to growth factor, protease and apoptosis pathways. Int J Cancer 2004; 111: 43–50. [DOI] [PubMed] [Google Scholar]
- 7. Papandreou I, Cairns RA, Fontana L et al. HIF‐1 mediates adaptation to hypoxia by actively downregulating mitochondrial oxygen consumption. Cell Metab 2006; 3: 187–97. [DOI] [PubMed] [Google Scholar]
- 8. Kim JW, Tchernyshyov I, Semenza GL et al. HIF‐1‐mediated expression of pyruvate dehydrogenase kinase: a metabolic switch required for cellular adaptation to hypoxia. Cell Metab 2006; 3: 177–85. [DOI] [PubMed] [Google Scholar]
- 9. Semenza G. Signal transduction to hypoxia‐inducible factor 1. Biochem Pharmacol 2002; 64: 993–8. [DOI] [PubMed] [Google Scholar]
- 10. Ignarro LJ, Byrns RE, Buga GM et al. Endothelium‐derived relaxing factor from pulmonary artery and vein possesses pharmacologic and chemical properties identical to those of nitric oxide radical. Circ Res 1987; 61: 866–79. [DOI] [PubMed] [Google Scholar]
- 11. Palmer RM, Ferrige A, Moncada S. Nitric oxide release accounts for the biological activity of endothelium‐derived relaxing factor. Nature 1987; 327: 524–6. [DOI] [PubMed] [Google Scholar]
- 12. McKinney LC, Aquilla EM, Coffin D et al. Ionizing radiation potentiates the induction of nitric oxide synthase by IFN‐gamma and/or LPS in murine macrophage cell lines: role of TNF‐alpha. J Leukoc Biol 1998; 64: 459–66. [DOI] [PubMed] [Google Scholar]
- 13. Cleeter MW, Cooper JM, Darley‐Usmar VM et al. Reversible inhibition of cytochrome c oxidase, the terminalenzyme of the mitochondrial respiratory chain, by nitric oxide. Implications for neurodegenerative diseases. FEBS Lett 1994; 345: 50–4. [DOI] [PubMed] [Google Scholar]
- 14. Hagen T, Taylor CT, Lam F et al. Redistribution of intracellular oxygen in hypoxia by nitric oxide: effect on HIF1alpha. Science 2003; 302: 1975–8. [DOI] [PubMed] [Google Scholar]
- 15. Brown GC, Cooper CE. Nanomolar concentrations of nitric oxide reversibly inhibit synaptosomal respiration by competing with oxygen atcytochrome oxidase. FEBS Lett 1994; 356: 295–8. [DOI] [PubMed] [Google Scholar]
- 16. Bolanos JP, Peuchen S, Heales SJ et al. Nitric oxide‐mediated inhibition of the mitochondrial respiratory chain in cultured astrocytes. J Neurochem 1994; 63: 910–6. [DOI] [PubMed] [Google Scholar]
- 17. Juang HH. Nitroprusside stimulates mitochondrial aconitase gene expression through the cyclic adenosine 3’,5’‐monosphosphate signal transduction pathway in human prostate carcinoma cells. Prostate 2004; 61: 92–102. [DOI] [PubMed] [Google Scholar]
- 18. Laderoute KR, Grant TD, Murphy BJ et al. Enhanced epidermal growth factor receptor synthesis in human squamous carcinoma cells exposed to low levels of oxygen. Int J Cancer 1992; 52: 428–32. [DOI] [PubMed] [Google Scholar]
- 19. Nishi H, Nishi KH, Johnson AC. Early Growth Response‐1 gene mediates up‐regulation of epidermal growth factor receptor expression during hypoxia. Cancer Res 2002; 62: 827–34. [PubMed] [Google Scholar]
- 20. Lo HW, Hsu SC, Ali‐Seyed M et al. Nuclear interaction of EGFR and STAT3 in the activation of the iNOS/NO pathway. Cancer Cell 2005; 7: 575–89. [DOI] [PubMed] [Google Scholar]
- 21. Sandau KB, Fandrey J, Brüne B. Accumulation of HIF‐1alpha under the influence of nitric oxide. Blood 2001; 97: 1009–15. [DOI] [PubMed] [Google Scholar]
- 22. Quintero M, Brennan PA, Thomas GJ et al. Nitric oxide is a factor in the stabilization of hypoxia‐inducible factor‐1alpha in cancer: role of free radical formation. Cancer Res 2006; 66: 770–4. [DOI] [PubMed] [Google Scholar]
- 23. Kirito K, Hu Y, Komatsu N. HIF‐1 prevents the overproduction of mitochondrial ROS after cytokine stimulation through induction of PDK‐1. Cell Cycle 2009; 8: 2844–9. [DOI] [PubMed] [Google Scholar]
- 24. Chandel NS, McClintock DS, Feliciano CE et al. Reactive oxygen species generated at mitochondrial complex III stabilize hypoxia‐inducible factor‐1alpha during hypoxia: a mechanism of O2 sensing. J Biol Chem 2000; 275: 25130–8. [DOI] [PubMed] [Google Scholar]
- 25. Schroedl C, McClintock DS, Budinger GR et al. Hypoxic but not anoxic stabilization of HIF‐1alpha requires mitochondrial reactive oxygen species. Am J Physiol Lung Cell Mol Physiol 2002; 283: 922–31. [DOI] [PubMed] [Google Scholar]
- 26. Guzy RD, Hoyos B, Robin E et al. Mitochondrial complex III is required for hypoxia‐induced ROS production and cellular oxygen sensing. Cell Metab 2005; 1: 401–8. [DOI] [PubMed] [Google Scholar]
- 27. Njoku CJ, Patrick KS, Ruiz P Jr et al. Inducible nitric oxide synthase inhibitors reduce urinary markers of systemic oxidant stress in murine proliferative lupus nephritis. J Investig Med 2005; 53: 347–52. [DOI] [PMC free article] [PubMed] [Google Scholar]
- 28. Pearlstein DP, Ali MH, Mungai PT et al. Role of mitochondrial oxidant generation in endothelial cell responses to hypoxia. Arterioscler Thromb Vasc Biol 2002; 22: 566–73. [DOI] [PubMed] [Google Scholar]
- 29. Palacios‐Callender M, Quintero M, Hollis VS et al. Endogenous NO regulates superoxide production at low oxygen concentrations by modifying the redox state of cytochrome c oxidase. Proc Natl Acad Sci USA 2004; 101: 7630–5. [DOI] [PMC free article] [PubMed] [Google Scholar]
- 30. Brown GC. Regulation of mitochondrial respiration by nitric oxide inhibition of cytochrome c oxidase. Biochim Biophys Acta 2001; 1504: 46–57. [DOI] [PubMed] [Google Scholar]
- 31. Cooper CE. Nitric oxide and cytochrome oxidase: substrate, inhibitor or effector? Trends Biochem Sci 2002; 27: 33–9. [DOI] [PubMed] [Google Scholar]
- 32. Yabuki M, Tsutsui K, Horton AA et al. Caspase activation and cytochrome c release during HL‐60 cell apoptosis induced by a nitric oxide donor. Free Radic Res 2000; 32: 507–14. [DOI] [PubMed] [Google Scholar]
- 33. Moriya R, Uehara T, Nomura Y. Mechanism of nitric oxide‐induced apoptosis in human neuroblastoma SH‐SY5Y cells. FEBS Lett 2000; 484: 253–60. [DOI] [PubMed] [Google Scholar]
- 34. Li J, Bombeck CA, Yang S et al. Nitric oxide suppresses apoptosis via interrupting caspase activation and mitochondrial dysfunction in cultured hepatocytes. J Biol Chem 1999; 274: 17325–33. [DOI] [PubMed] [Google Scholar]
- 35. Levesque MC, Ghosh DK, Beasley BE et al. CLL cell apoptosis induced by nitric oxide synthase inhibitors: correlation with lipid solubility and NOS1 dissociation constant. Leuk Res 2008; 32: 1061–70. [DOI] [PubMed] [Google Scholar]
- 36. Brown JM, Wouters BG. Does apoptosis contribute to tumor cell sensitivity to anticancer agents? In: Hickman JA, Dive C, eds. Apoptosis and Cancer Chemotherapy. Totowa, NJ, USA: Humana Press, 1999; 1–20. [Google Scholar]
- 37. Waldman T, Zhang Y, Dillehay L et al. Cell‐cycle arrest versus cell death in cancer therapy. Nat Med 1997; 3: 1034–6. [DOI] [PubMed] [Google Scholar]
- 38. Viktorsson K, Heiden T, Molin M, Akusjärvi G, Linder S, Shoshan MC. Increased apoptosis and increased clonogenic survival of 12V‐H‐ras transformed rat fibroblasts in response to cisplatin. Apoptosis 2000; 5: 355–67. [DOI] [PubMed] [Google Scholar]
- 39. Swinson DE, O’Byrne KJ. Interactions between hypoxia and epidermal growth factor receptor in non‐small‐cell lung cancer. Clin Lung Cancer 2006; 7: 250–6. [DOI] [PubMed] [Google Scholar]
- 40. Tracy S, Mukohara T, Hansen M et al. Gefitinib induces apoptosis in the EGFRL858R non‐small‐cell lung cancer cell line H3255. Cancer Res 2004; 64: 7241–4. [DOI] [PubMed] [Google Scholar]
- 41. Lammering G, Valerie K, Lin PS et al. Radiation‐induced activation of a common variant of EGFR confers enhanced radioresistance. Radiother Oncol 2004; 72: 267–73. [DOI] [PubMed] [Google Scholar]
- 42. Kobayashi S, Boggon TJ, Dayaram T et al. EGFR mutation and resistance of non‐small‐cell lung cancer to gefitinib. N Engl J Med 2005; 352: 786–92. [DOI] [PubMed] [Google Scholar]
- 43. Paez JG, Jänne PA, Lee JC et al. EGFR mutations in lung cancer: correlation with clinical response to gefitinib therapy. Science 2004; 304: 1497–500. [DOI] [PubMed] [Google Scholar]
- 44. Mendelsohon J, Baselga J. Status of epidermal growth factor receptor antagonists in the biology and treatment of cancer. J Clin Oncol 2003; 21: 2787–99. [DOI] [PubMed] [Google Scholar]
- 45. Carpenter G, Cohen S. Epidermal growth factor. J Biol Chem 1990; 265: 7709–12. [PubMed] [Google Scholar]


