

Abstract
Caveolin‐1 is a component of lipid rafts, and is considered to be a tumor suppressor molecule. However, the mechanisms by which caveolin‐1 functions in cancer cells are not well understood. We generated caveolin‐1 transfectant cells (Cav‐1+ cells) using a human melanoma cell line (SK‐MEL‐28) and investigated the effects of caveolin‐1 overexpression on the GD3‐mediated malignant properties of melanomas. Cav‐1+ cells had decreased cell growth and motility, and reduced phosphorylation levels of p130Cas and paxillin relative to controls. In floatation analysis, although GD3 was mainly localized in glycolipid‐enriched microdomain (GEM)/rafts in control cells, it was dispersed from GEM/rafts in Cav‐1+ cells. Correspondingly, GD3 in Cav‐1+ cells stained uniformly throughout the membrane, whereas control cells showed partial staining of the membrane, probably at the leading edge. p130Cas and paxillin were stained in the leading edges and colocalized with GD3 in the control cells. In contrast, these molecules were diffusely stained and no definite leading edges were detected in Cav‐1+ cells. These results suggest that caveolin‐1 regulates GD3‐mediated malignant signals by altering GD3 distribution and leading edge formation. These results reveal one of the mechanisms by which caveolin‐1 curtails the malignant properties of tumor cells. (Cancer Sci 2007; 98: 512–520)
Membrane microdomains such as glycolipid‐enriched microdomains (GEM) or detergent‐insoluble microdomains (DIM) are important membrane structures for various cellular events.( 1 , 2 ) When these microdomains contain caveolin and have a characteristic vaginated morphology, they are referred to as caveolae.( 3 , 4 , 5 ) They are also known as lipid rafts because of their floating behavior.( 6 ) Hereafter, we shall refer to them as GEM/rafts. The organization and molecular assembly of lipid rafts have recently been studied.( 7 ) Although their roles in endocytosis( 8 ) bacterial infection( 9 ) calcium import( 10 ) and cholesterol transport( 11 , 12 ) have been studied, one of the most interesting aspects of these microdomains is likely to be their regulatory roles with respect to cellular signaling.( 13 , 14 , 15 ) In particular, the roles of GEM/rafts in tumor phenotypes and the regulation of signals involved in the malignant properties of cells are essential subjects in studies of tumor biology.( 15 )
The caveolin family consists of three members( 16 ) which have similar structures. Caveolin‐1 is widely distributed and best studied with respect to its behavior and function.( 10 , 16 ) Caveolins are one of the main constituents of GEM/rafts, and have been used as raft markers.( 17 , 18 ) However, the actual molecular function of caveolins in lipid rafts has never been determined, although changes in the expression levels of caveolins in various situations and a number of caveolin‐associated molecules have been identified.( 15 , 16 ) In particular, caveolin‐1 levels are suppressed in many human cancers relative to normal tissues( 15 , 19 ) and the expression level of caveolin‐1 is down‐regulated with expression of various oncogenic molecules, suggesting a tumor suppressor‐like function for caveolin‐1.( 15 )
Gangliosides (acidic glycosphingolipids) reportedly play roles in human solid tumors( 20 ) and T‐cell malignancies.( 21 , 22 , 23 , 24 ) Experiments based on glycolipid remodeling using cDNAs of glycosyltransferases have allowed ganglioside functions in tumor phenotypes to be studied by our group( 25 ) and others.( 26 , 27 ) In particular, ganglioside GD3 is specifically expressed in almost all malignant melanoma tissues and melanoma cell lines.( 28 , 29 ) Recently, we reported that GD3 expression in human melanoma cells enhanced tyrosine phosphorylation of two adaptor molecules, p130Cas and paxillin, and promoted signals for cell proliferation and invasion, probably at GEM/rafts.( 30 ) Thus, the correlation between GD3 and caveolin‐1 in melanoma cells should be of great interest, since both have a significant presence in GEM/rafts and are considered to be crucial molecules in the regulation of signals transduced through GEM/rafts.
In this study, we generated caveolin‐1 transfectant cells that had markedly reduced caveolin‐1 relative to the parent cells, the SK‐MEL‐28 human melanoma cell line. Using this cell line, we investigated the effects of caveolin‐1 overexpression on the GD3‐mediated malignant features of melanoma cells. The results obtained from this experiment demonstrated a dynamic functional interaction between GD3 and caveolin‐1, and also determined one of the mechanisms by which caveolin‐1 suppresses the malignant properties of tumor cells.
Materials and Methods
Antibodies. Anti‐caveolin‐1 (rabbit IgG) and anti‐c‐myc (rabbit IgG) were purchased from Santa Cruz Biotechnology (Santa Cruz, CA, USA). Anti‐flotillin‐1 (mouse monoclonal IgG1) and anti‐phosphotyrosine mAb (PY20) were from Transduction Laboratories (Lexington, KY, USA). Anti‐p130Cas (rabbit IgG, C‐20) was from Santa Cruz Biotechnology. Anti‐paxillin (mouse mAb IgG1) was from Transduction Laboratories. Anti‐mouse IgG conjugated with HRP was from Amersham Pharmacia Biotech (Little Chalfont, Bucks, UK). Anti‐mouse IgG3‐Alexa555 and antirabbit IgG‐Alexa488 were purchased from Molecular Probes (Eugene, OR, USA).
Construction of caveolin‐1 expression vector. Human caveolin‐1 cDNA was generated by reverse transcription‐polymerase chain reaction (RT‐PCR) using total RNA extracted from a GD3‐negative mutant line, SK‐MEL‐28‐N1. The cDNA was digested with BamHI‐XhoI and inserted into the BamHI‐XhoI site of pCMV‐Tag 3 to obtain pCMV‐Tag 3/caveolin‐1. pCMV‐Tag 3 is a mammalian expression vector with myc‐tag, which was purchased from Stratagene (North Turrey, CA, US).
Cell culture and transfection. SK‐MEL‐28 was maintained in Dulbecco's modified Eagle's essential medium supplemented with 7.5% fetal calf serum (FCS) at 37°C in a humidified atmosphere containing 5% CO2. SK‐MEL‐28 cells were subcloned using a limiting dilution method, and of 30 clones, clone 18 was selected for use in subsequent experiments because of its low level of caveolin‐1 expression. For cDNA transfection, cells were plated onto a 60‐mm plastic culture plate (Falcon). The plasmid pCMV‐Tag 3/caveolin‐1 was transfected into cells with Lipofectamine 2000TM (Invitrogen) in accordance with the manufacturer's instructions. Stably transfected cells were selected in the presence of 700 µg/mL G418 (Gibco, Invitrogen).
MTT assay. Cells (2 × 10³) were seeded with serum‐containing medium onto 96‐well plates. At days 1, 3, 6 and 9 of culture, the MTT (3‐(4, 5‐dimethyl‐2‐thiazolyl)−2,5‐diphenyl‐2H‐tetrazolium bromide) assay was performed. Cell growth was quantified by assessing the reduction of MTT to formazan based on absorbance at 590 nm by using an Immuno Mini NJ‐2300TM ELISA reader (System Instruments, Tokyo, Japan).
Two‐dimensional mobility assay. To analyze the two‐dimensional mobility of the cells, a wound‐healing scratching mobility assay was performed as described by Hauck et al.( 31 ) Cells (5 × 10⁵) were plated onto 6‐cm dishes (Falcon), and scratching was performed on the next day using a plastic tip. The areas newly occupied with cells that had moved into the scratched parts of the plate were measured by taking photographs under a microscope every 6 h up to 24 h.
In vitro invasion assay. Invasion assays with Boyden chamber were performed. In brief, Matrigel (Becton Dickinson) was diluted with ice‐cold phosphate buffered saline (PBS) (100 µg/mL), added 0.6 mL to each filter (polyethylene terephthalate membrane, 8‐mm pore size, 23.1 mm in diameter; Falcon 3093), and left to be polymerized and dried overnight. The membrane was reconstituted with serum‐free medium. The lower chamber (6‐well plate; Falcon 3502) was filled with the culture medium with or without serum before the chamber was assembled. Cells (2 × 10⁵ cells/well) were added to serum‐free medium in the upper chamber and incubated for 24 h, then the cells on the surface of the filter were stained with Giemsa (Wako), then counted under microscopy.
Preparation of cell lysates. Cells (2 × 10⁵) were plated onto a 6‐cm dish, and serum‐starved for 12 h before treatment with FCS. After the medium was removed, cells were treated with FCS‐containing medium for 60 min at 37°C. Then, cells were lyzed with a lysis buffer (20 mM Tris‐HCl, pH 7.5, 150 mM NaCl, 1 mM Na2EDTA, 1 mM EGTA, 1% Triton X‐100, 2.5 mM sodium pyrophosphate, 1 mM β‐glycerophosphate, 1 mM Na3VO4, 1 µg/mL leupeptin, 1 mM PMSF) and insoluble materials were removed by centrifugation at 4°C at 10 000 × g for 10 min
Immunoprecipitation. The lysates were immunoprecipitated with monoclonal or polyclonal antibody bound to protein G‐Sepharose or A‐Sepharose at 4°C for 75 min. The beads were washed five times with 1 mL of washing buffer (50 mM Tris‐HCl, pH 7.5, 150 mM NaCl, 1 mM MgCl2, 0.5% Nonidet P‐40, 1 mM Na3VO4) and finally resuspended in 20 µL of 2x SDS sample buffer. The precipitated proteins were separated using sodium dodecyl sulfate‐polyacrylamide gel electrophoresis (SDS‐PAGE), then immunoblotted.
Western immunoblotting. Lysates were separated with SDS‐PAGE using 7.5–12% gels. The separated proteins were transferred onto an Immobilon‐PTM membrane (Millipore, Bedford, MA, USA). Blots were blocked with 3% bovine serum albumin (BSA) in PBS containing 0.05% Tween‐20 for 1 h. The membrane was first probed for 1 h with primary antibodies. After being washed, the blots were then incubated for 45 min with goat antirabbit IgGs or goat antimouse IgGs conjugated with horseradish peroxidase: (1:2 000). After the membranes were washed, bound conjugates were visualized with an ECL detection systemTM (PerkinElmer Life Science, Boston, MA, USA).
Isolation of the GEM/raft fraction. The GEM/raft membrane microdomains were prepared using a detergent extraction method essentially as described by Mitsuda et al.( 32 ) Cells were plated at a density of 1 × 10⁵ per 15‐cm dish and cultured up to 90% confluency, and seven dishes of cells were used for each preparation. After being washed twice with ice‐cold PBS, the cells were collected, suspended in 1 mL of TNE/Triton X‐100 buffer (1% Triton X‐100, 25 mM Tris‐HCl, pH 7.5, 150 mM NaCl, 1 mM EGTA), then Dounce homogenized 20 times, and mixed with an equal volume of 80% sucrose (w/v). Then, samples were placed at the bottom of Ultra‐Clear Centrifuge TubesTM (Beckman Instruments, Fullerton, CA, US). Two milliliters of 30% sucrose in TNE buffer without Triton X‐100 was laid on top of the samples, and 1 mL of 5% (w/v) sucrose in TNE‐buffer without Triton X‐100 was laid on top. The samples were centrifuged at 105 000 × g in a MLS50 rotor (Beckman Instruments) for 16 h at 4°C. The entire procedure was performed at 4°C. From the top of the gradient, 0.5 mL each of fraction was collected to yield 10 fractions.
Immunofluorescence study. Cells were cultured on a cover glass and fixed with 4% paraformaldehyde in PBS. To identify the leading edges of migrating cells, a wound was generated by scratching with a 200 µL pipette tip. After 3 h, the wounded monolayer was fixed with 4% paraformaldehyde in PBS. GD3 was stained with monoclonal antibody (mAb)R24 and antimouse IgG3‐Alexa555. Caveolin‐1 was stained with rabbit anticaveolin‐1 antibody and antirabbit IgG‐Alexa488. p130Cas was stained with rabbit antip130Cas antibody and antirabbit IgG‐Alexa488. Paxillin was stained with an antipaxillin mouse mAb and antimouse IgG1‐Alexa‐488. The staining pattern was analyzed using a Fluoview FV 500TM confocal laser microscope (Olympus, Tokyo, Japan). To confirm that there was no cross‐reaction between mAbR24 and antirabbit IgG‐Alexa488 or rabbit anticaveolin‐1 antibody and antimouse IgG3‐Alexa555, preliminary staining was performed, and optimal dilutions for individual antibodies were determined.
Image analysis. To analyze the immunoblot band intensities, bands in the autofluorogram were scanned using Adobe Photoshop 6.0 and quantified using NIH Image 1.61.
Glycolipid extraction and thin layer chromatography (TLC). Glycolipids were isolated from cell lysates or fractions of the sucrose density gradient fractionation essentially as described previously.( 33 ) TLC was performed with high performance TLC plates (Merck, Darmastadt, Germany) using a solvent system of chloroform/methanol/0.22% CaCl2:(55:45:10). When necessary, 0.22% CaCl2 was replaced with 2.5 N NH4Cl. Bands were visualized with resorcinol spray.
Mass spectrometry. Analyses of molecular species of GD3 were performed with ESI‐MS using a Q‐Tof microTM quadrupole time‐of‐flight hybrid mass spectrometer (Micromass, Manchester, UK) with an Ultimate HPLC system combined with a FAMOS autosampler (LC‐Packings, San Francisco, CA, USA) as described elsewhere.( 34 ) The extracted glycolipids were subjected to ESI‐MS analysis using flow injection, with a flow rate of 3 µL/min. Three microliters of sample were applied. The mobile phase comprised acetonitrile/methanol/water (6:7:2; plus 0.1% ammonium formate). The spectra were recorded in the positive ion mode. The capillary voltage was set at 3.0 kV, cone voltage at 35 V, and source block temperature at 100°C. The collision gas used for MS/MS was argon (p(Ar) = 7.5 × 10⁻⁵ mbar), and the collision energy was set at 35 eV.
Statistical analysis. The statistical significance of data was determined using Student's t‐test.
Results
Caveolin‐1 expression in SK‐MEL‐28 and the GD3‐defective mutant line N1. Expression levels of caveolin‐1 in SK‐MEL‐28 and the GD3‐defective mutant line of SK‐MEL‐28, N1, were analyzed by immunoblotting (Fig. 1a). N1 cells had markedly increased expression of caveolin‐1 compared with the parent line, SK‐MEL‐28, suggesting the tumor suppressive effects of caveolin‐1.
Figure 1.

Expression analysis of caveolin‐1 and establishment of stable transfectants. a, Immunoblotting to examine the expression levels of caveolin‐1 in SK‐MEL‐28 and N1, a mutant line of SK‐MEL‐28, was performed using a rabbit anti‐caveolin‐1 antibody. b, After transfection of SK‐MEL‐28 cells with a caveolin‐1 synthase gene expression vector (pCMV‐Tag 3/caveolin‐1), or pCMV‐Tag 3, two transfectant lines (Cav12, Cav35) and two vector controls (V1 and V2) were established. Total cell lysates were subjected to immunoblotting with anticaveolin‐1 (upper panel) or antic‐myc (middle panel) antibodies. The location of the fusion protein is indicated by arrows.
Generation of Cav‐1+ clones of SK‐MEL‐28 by transfection with a myc‐Cav‐1 fusion protein expression vector. After transfection of SK‐MEL‐28 cells with a myc‐caveolin‐1 expression vector (pCMV‐Tag 3/caveolin‐1), or pCMV‐Tag 3, two transfectant lines (Cav12 and Cav35) and two vector controls (V1 and V2) were established (Fig. 1b). In the immunoblotting, strong myc‐caveolin‐1 fusion protein bands were detected using an anticaveolin‐1 antibody. Endogenous caveolin‐1 bands were also found with the anticaveolin‐1 antibody. Immunoblotting with an antic‐myc antibody revealed only two bands in the Cav‐1+ transfectant cells. Although myc‐caveolin‐1 fusion proteins consisted of two bands, endogenous caveolin‐1 also showed two components with various ratios between the upper and lower bands. Treatment of cell lysates with phosphatases could not verify that the two bands were due to phosphorylation of caveolin‐1 (data not shown). Using these clones, the effects of cavolin‐1 expression on cell proliferation, invasion and motility were determined. GD3 expression levels were almost equivalent between the Cav‐1+ transfectant cells and control cells (data not shown).
Effects of caveolin‐1 expression on cell proliferation. Proliferation of the Cav‐1+ cells and the vector control cells was compared using an MTT assay. As shown in Fig. 2a, the Cav‐1+ cells had markedly reduced cell growth. The cell numbers of these transfectants were 1.5–2.5 times less than those of the control cells at day 9 of culture.
Figure 2.

Effects of caveolin‐1 expression on cell proliferation, motility and invasion. a, Analysis of cell proliferation. Cells (2 × 10³) were seeded onto 96‐well plates. On days 1, 3, 6, and 9 of culture, the MTT assay was performed. Data are presented as relative absorbance, with absorbance on day 1 set as 1.0. *: P < 0.05, **: P < 0.001. b and c, Cell motility of the transfectants was analyzed using wound‐healing scratching motility assays. B, Photomicrographs of the scratched regions of vector control (V1) and Cav‐1+ transfectant (Cav12) cultures at times 0, 12, and 24 h. C, Results of the motility assay. Wound areas are presented as a percentage of the initial wound size (100%). The time course of the wound areas at times 0, 6, 12, 18, and 24 h is shown. Mean values (n = 12) were plotted for individual points. *: P < 0.05. d, Result of invasion assay. No significant difference in invasion activity, as analyzed by using the Boyden chamber, was found between control and Cav‐1+ transfectant cells.
Reduced motility of the transfectant cells. To analyze the two‐dimensional motility of the cells, a wound‐healing scratching assay was performed. The Cav‐1+ cells had significantly lower motility than the control cells, as shown in Fig. 2b. The areas newly occupied by these transfectants were 1.5–2.5 times smaller than those of the control cells at 24 h after scratching. The time course results for this assay are presented in Fig. 2c. No significant difference in invasion activity, as analyzed by using the Boyden chamber, was found between control and Cav‐1+ transfectant cells (Fig. 2d).
Reduced phosphorylation of p130cas and paxillin after FCS treatment in Cav‐1+ transfectant cells. The time course of tyrosine phosphorylation levels of p130Cas and paxillin in the vector controls (V1 and V2) and Cav‐1+ cells (Cav12 and Cav35) were analyzed. Cells (5 × 10⁵) were treated with FCS after serum starvation for 12 h, and the phosphorylated bands were observed up to 60 min after addition of FCS using PY20 (Fig. 3a). The phosphorylation levels of two components in the Cav‐1+ cells, 130 kDa and 68 kDa in size, which probably correspond to p130Cas and paxillin, were generally lower than those in the control cells (Fig. 3b). The differences were particularly obvious after 30 min
Figure 3.

Reduced phosphorylation of p130Cas and paxillin after fetal calf serum (FCS) treatment of transfectant cells. a, Time course of the phosphorylation levels of p130Cas and paxillin in vector control (V1 and V2) and Cav‐1+ (Cav12 and Cav35) cells. Cells (2 × 10⁵) were treated with FCS after serum starvation for 12 h, and the phosphorylation levels of p130Cas and paxillin were observed up to 60 min after addition of FCS. Immunoblotting was carried out using PY20. b, Relative intensities of bands in a were plotted. c, Identification of bands at 130 kDa and 68 kDa as p130Cas and paxillin, respectively. Immunoprecipitation/immunoblotting (IP/IB) was performed to identify the two tyrosine‐phosphorylated components using PY20 and antip130Cas (a), and PY20 and antipaxillin antibodies (b) in vector control (V1) and Cav‐1+ cells (Cav35). Immunoprecipitates with PY20 (PY20 IP) and those with antip130Cas (p130Cas IP) together with total lysate were immunoblotted using PY20 (Ca, Cb, left) or anti‐p130Cas (Ca, Cb, right). d, Immunoprecipitates with PY20 or antipaxillin antibody were immunoblotted as performed for p130Cas in a to identify the 68 kDa band as paxillin (Da, Db).
Confirmation that p130 and p68 are p130Cas and paxillin, respectively. The two tyrosine‐phosphorylated components (130 kDa and 68 kDa) were suspected to be p130Cas and paxillin, respectively, based on their migration rates in SDS‐PAGE. To confirm this possibility, immunoprecipitation and subsequent immunoblotting was performed. When immunoblotting with PY20, the immunoprecipitate with PY20 and that with anti‐p130Cas had bands with similar electrophoretic mobility (Fig. 3c). However, when immunoblotting with antip130Cas, p130 bands precipitated with antip130Cas as well as those in the total lysate were detected at a faster‐migrating site compared with a band precipitated with PY20 (Fig. 3c). These results indicate that the 130 kDa band was p130Cas, and that only a small portion of p130Cas was tyrosine‐phosphorylated. As for paxillin, immunoprecipitates with PY20 and those with anti‐paxillin antibody had 68 kDa bands at similar levels in immunoblotting with PY20 (Fig. 3d). However, when immunoblotting with anti‐paxillin, multiple bands were found in immunoprecipitates with antipaxillin antibody as well as in the total lysate, with a major band at the faster‐migrating site compared with that in immunoprecipitates with PY20. These results indicate that p68 was paxillin, and that a small portion of paxillin was tyrosine‐phosphorylated.
Floating pattern of caveolin‐1 and GD3 in sucrose density gradient fractionation. Sucrose density gradient fractionation of Triton X‐100 extracts revealed that flotillin‐1 was present in fractions 2–4 (Fig. 4), indicating that these fractions contained the GEM/raft fraction. Although the caveolin‐1 level was very low in the controls as shown in Fig. 1, its band could be found mainly in the GEM/raft fractions of the control cells due to protein concentration during the sucrose density gradient fractionation. This was also the case in the Cav‐1+ cells, although the expression levels of caveolin‐1 were fairly high. Immunoblotting with anti‐GD3 mAbR24 revealed that the majority of GD3 bands were found in the GEM/raft fractions in the control cells. In contrast, GD3 was widely distributed inside and outside of the GEM/raft fraction in the Cav‐1+ cells (Fig. 4b).
Figure 4.

Alteration in the floatation pattern of GD3 in sucrose density gradient fractionation. Fractionation patterns for control and Cav‐1+ cells are shown. Triton X‐100 cell extracts were fractionated by sucrose density gradient ultracentrifugation, and each fraction was used for immunoblotting. Reagents used for the detection of individual molecules are described in the Materials and Methods. GD3 was detected with mAbR24. a, Results for the vector control cells (V1 and V2). b, Results for the Cav‐1+ cells (Cav12 and Cav35). Note that GD3 was widely distributed inside and outside of the GEM/rafts in the Cav‐1+ cells.
Alteration of intracellular localization of GD3 in transfectant cells as analyzed by immunocytostaining. To study the distribution pattern of GD3 in the cells, immunocytostaining of caveolin‐1 and GD3 was performed. Caveolin‐1 stained mainly on the cell membrane and weakly in the cytoplasm in both the control cells and the Cav‐1+ cells (Fig. 5a, upper). Although GD3 in the vector control cells showed a partial staining pattern on the cell membrane, that in the Cav‐1+ cells showed almost uniform staining throughout the plasma membrane (Fig. 5a, middle). Caveolin‐1 was stained on the cell membrane and GD3 was colocalized with caveolin‐1 at some sites of the membrane in the control cells. In contrast, caveolin‐1 and GD3 were partially colocalized in the Cav‐1+ cells, while both GD3 and caveolin‐1 were stained throughout the cell membrane (total staining). When the two images were merged, contrasting patterns in the control cells and the Cav‐1+ cells were revealed (Fig. 5a, lower). To examine the partial staining of GD3 that corresponded to the leading edges in the migrating cells, the cultured cells were wounded by scratching, then GD3 staining patterns were compared for Cav35 transfectant cells and V1 control cells. As shown in Fig. 5b, the cells with leading edges facing the scratched area ((→)) were much more abundant in the control cells than in the transfectant cells.
Figure 5.

Localization of caveolin‐1 and GD3 with immunocytostaining. a, Staining pattern of caveolin‐1 and GD3 in vector control (V1 and V2) and Cav‐1+ (Cav12 and Cav35) cells as analyzed by confocal laser microscopy. Cells were cultured on a cover glass and fixed with 4% paraformaldehyde in PBS. GD3 was stained with mAbR24 and anti‐mouse IgG3‐Alexa555. Caveolin‐1 was stained with rabbit anti‐caveolin‐1 antibody and anti‐rabbit IgG‐Alexa488. b, GD3 staining patterns on the membranes facing the scratched areas. To compare the directions of the leading edges of the migrating cells (indicated by →), a wound was generated by scratching the culture with a pipette tip. After 3 h, the wounded monolayer was fixed, and GD3 was stained using mAbR24 and anti‐mouse IgG3‐Alexa555. Caveolin‐1 was stained with rabbit anti‐caveolin‐1 antibody and anti‐rabbit IgG‐Alexa488. The left side is the scratched area.
Changes in the localization of p130Cas and paxillin in Cav‐1+ cells. To determine the intracellular localization of p130Cas and paxillin, immunocytostaining was performed. As previously described, GD3 was distributed almost equally over the whole cell membrane in Cav‐1+ cells, but accumulated at the leading edges in the control lines (Fig. 6a, middle). p130Cas was present at the leading edges and perinuclear regions in the control cells (Fig. 6a, upper). In contrast, p130Cas in the Cav‐1+ cells stained diffusely in the cytoplasm, and no clear staining was found in leading edges (Fig. 6a, upper). Paxillin stained with a very similar pattern to p130Cas (Fig. 6b). These results indicate that leading edge formation was disturbed in Cav‐1+ cells.
Figure 6.
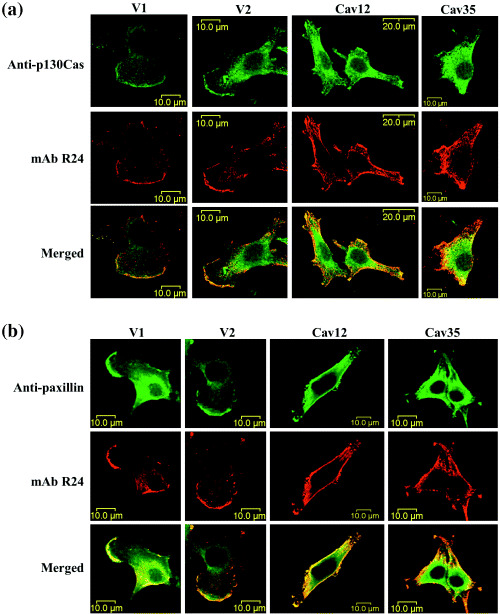
Intracellular localization of p130Cas and paxillin changed in parallel with GD3. Cells were cultured on a cover glass and fixed, then stained as described in the Materials and Methods. a and b, GD3 was stained with mAbR24 and antimouse IgG3‐Alexa555. p130Cas and paxillin were stained with rabbit antip130Cas antibody and antirabbit IgG‐Alexa488 (a) or antipaxillin mouse mAb and antimouse IgG1‐Alexa488 (b), respectively. The staining pattern was analyzed by confocal laser microscopy. The results for two control lines (V1 and V2) and two Cav‐1+ transfectant lines (Cav12 and Cav35) are shown. Note that no clear leading edges were observed for the transfectant cells.
Different distribution of GD3 in GEM/raft and non‐GEM/raft fractions as analyzed by TLC of extracts. Glycosphingolipids extracted from the GEM/raft (fractions 2 and 3) and the non‐GEM/raft fractions (fractions 5–7 and 8–10) from the vector control (V1) and the Cav‐1+ cells (Cav12) were analyzed by TLC/resorcinol. The distribution of GD3 among fractions from the sucrose density gradient fractionation was clearly different for Cav‐1+ cells and control cells, as expected (Fig. 7a). The major portion of GD3 was found in the GEM/raft fraction for the control cells, whereas GD3 was detected mainly in the non‐raft fractions, i.e. in fractions 5–7 and 8–10, as well as in the GEM/raft fraction for the Cav‐1+ cells. Faint bands of GD3 in the non‐raft fractions as shown in Figure 4a became definite after combining some fractions in control cells, whereas the raft fraction contained markedly high amounts of GD3. Mass spectrometry analysis revealed that the majority of GD3 bands in the raft fraction (Fr. 2–3) consisted of two components, i.e. d18:1–16:0 and d18:1–24:0, and that the Na‐form of d18:1–16:0 was also present in the peaks for both Cav‐1+ cells and controls (Fig. 7b). In the non‐raft fraction (fr. 5–7), however, an unsaturated form (d18:1–24:1) became dominant in the peaks of 24:0 +24:1. These distribution patterns were almost identical for the two kinds of cells. Considering the distribution of GD3 as shown in Figure 7a, Cav‐1+ cells seem to contain a relatively greater amount of the unsaturated form of GD3.
Figure 7.

TLC and mass spectrometry analysis of GD3 in the GEM/raft and non‐GEM/raft fractions. a, Gangliosides were extracted from GEM/raft (2 and 3) and non‐GEM/raft (5–7 and 8–10) fractions from vector control (V1) and Cav‐1+ (Cav12) cells, then separated by TLC. The solvent used was chloroform/methanol/2.5 N NH4Cl (55:45:10). Resorcinol spray was used for the detection of bands. B, Molecular species of GD3 were analyzed by ESI‐MS using a Q‐Tof microTM quadrupole time‐of‐flight hybrid mass spectrometer (Micromass, Manchester, UK) with an Ultimate HPLC system as described in the Materials and Methods. The results of samples from GEM/raft (2 and 3) and non‐GEM/raft (5–7) fractions are shown. Peaks at 1442.90–1442.98 (m/z) were assigned d18:1–16:0, those at 1555.07–1555.11 were d18:1–24:0, and those at 1553.08–1553.11 were 18:1–24:1.
Discussion
Both caveolin‐1 and gangliosides are considered to be representative constituents of GEM/rafts, and caveolin‐1 and GM1 have been used as markers for GEM/rafts.( 35 ) Recently, the carbohydrate structures of glycosphingolipids have been shown to affect to a large extent the quantity and quality of cell signals transduced via GEM/rafts.( 17 ) The role of GM3 in the regulation of integrin signals( 36 ) and the role of GM1 in the regulation of NGF/Trk A signals have been well investigated.( 37 ) However, the functional and physical association between caveolin‐1 and glycosphingolipids has not been studied except for findings that GD3 coprecipitates with caveolin‐1 in rat cerebellum granular cells( 38 ) and that GM3 overexpression results in a shift of caveolin‐1 into GEM/rafts( 39 ) or in caveolin‐1 redistribution.( 40 ) The results obtained in the present study demonstrated for the first time the possibility that caveolin‐1 levels modulate the distribution patterns of glycosphingolipids inside/outside of GEM/rafts.
Caveolin‐1 is frequently down‐regulated in many tumors( 15 ) with some exceptions, such as prostate cancer.( 41 ) Therefore, it is now considered to function as a kind of tumor suppressor gene( 15 , 19 ) and in fact suppression of caveolin‐1 expression induces increased proliferation and malignant transformation.( 42 ) Knock‐out of the caveolin‐1 gene also enhances tumorigenesis.( 43 , 44 ) However, to date the mechanisms underlying its tumor suppressive activity have not been determined, rather only the fact that repression of caveolin‐1 expression coincides with the expression of various oncogenic proteins is known.( 15 ) Overexpression of caveolin‐1 causes dispersion of the GD3 that accumulates in GEM/rafts, which might indicate a mechanism by which caveolin‐1 curtails the malignant properties of tumors. In our previous analysis of the role of GD3 in the enhancement of melanoma cell proliferation and cell invasion, we determined that GEM/rafts are enriched for GD3 (Hamamura et al. unpublished data). Therefore, the intracellular localization of GD3 seems to be critical for its tumor‐promoting function( 30 ) and caveolin‐1 might regulate tumor intensity by modulating GD3 localization.
As for expression levels of gangliosides including GD3 in the Cav‐1+ cells, no changes were observed. Moreover, 22 clones of SK‐MEL‐28 isolated to select the objective of caveolin‐1 cDNA transfection showed a wide range of expression levels of caveolin‐1 with equivalent levels of GD3, suggesting there are no direct relations in the expression of gangliosides and caveolin‐1.
Consequently, over‐expression of caveolin‐1 resulted in reduced cell proliferation and migration, but not in decreased invasion activity. This appears to be inconsistent with the previous report on GD3 synthase‐transfection in melanoma cells.( 30 ) This fact suggests that invasion‐specific molecules such as matrix metalloproteases may not be affected by the dispersion of GD3, although precise mechanisms remain to be investigated.
Tyrosine‐phosphorylated‐caveolin‐1 is known to recruit Csk to GEM/rafts, leading to inhibition of cell proliferation.( 45 ) In the present study tyrosine‐phosphorylated caveolin‐1 was proportionally accumulated in GEM/rafts in Cav+‐1 transfectant cells (data not shown), but recruitment of Csk to GEM/rafts could not be detected in our system.
GEM/raft microdomains have been demonstrated to mediate the acquisition of spatial and functional asymmetry between the front and the rear of cells, helping to form the front‐rear polarity that is required for cell migration.( 46 ) In migrating cells, GM1 has been found to stain asymmetrically, and acquisition of a motile phenotype in T lymphocytes resulted in the asymmetric redistribution of GM3‐ and GM1‐enriched raft domains to the leading edge and to the uropod, respectively.( 47 ) Specialized molecules such as CD44, integrins, talin, etc. are differentially associated with GM3‐ and GM1‐enriched GEM/rafts, suggesting differential roles of the two gangliosides in the formation of specific GEM/rafts. Thus, the question is: What are the roles of the GEM/rafts containing GD3, as shown in this study?
Focal adhesions, sites of integrin binding to the extracellular matrix, form in the leading edge during cell migration. In focal adhesions, a number of molecules, such as integrins, paxillin, focal adhesion kinase, and actin filaments, are clustered, and these molecules play crucial roles in cell adhesion, motility, proliferation, and invasion.( 48 ) In the melanoma cell line used in the present study, GEM/rafts are enriched for ganglioside GD3, instead of GM3, and GD3 colocalizes with paxillin and p130Cas in leading edges, as recently reported by Hamamura et al.( 30 ) Therefore, formation of focal adhesions in certain locations should be essential for determining cell orientation and for controlling organized migration. If so, overexpression of caveolin‐1 might disturb the well‐organized formation of focal adhesions by altering the distribution pattern of GD3 and probably that of other molecules also. Dynamic changes in GD3 distribution, as shown in cytostaining of the transfectant cells in Figure 5, might reflect disorganized focal adhesions and cellular disorientation (Fig. 6). These interpretations accord well with the results of the cell mobility assay and cytostaining of Cav‐1+ cells after scratching. The inability to form leading edges of Cav‐1+ cells should cause a reduction in cell motility and probably also in cell proliferation.
In the focal adhesions of fibroblasts, integrin‐mediated signals recruit GM1 to the GEM/rafts via FAK (not p130Cas or paxillin), leading to the stabilization of microtubules.( 49 ) In contrast, in the present study GD3 colocalized with p130Cas or paxillin in the leading edges of the control melanoma cells (Fig. 6a,b). Thus, the main ganglioside and signaling molecules responsible for the formation and function of leading edges might differ for different cell lineages.
We have investigated the roles of cancer‐associated glycolipid antigens in the regulation of signals that are crucial for the properties of malignant tumors. One of the most beneficial aspects of these studies is that they may lead to identification of a novel target for cancer therapy. As shown in the present study, introduction of the caveolin‐1 gene into malignant cells can be an effective way to attenuate cancer phenotypes without obvious adverse effects on normal tissues. Of course, the effects of overexpression of caveolin‐1 on normal cells and tissues remain to be investigated.
An issue that remains to be clarified is how overexpressed caveolin‐1 causes dispersion of GD3 and even p130Cas and paxillin, resulting in disappearance of the leading edges. Our results regarding the molecular changes in GD3 in Cav‐1+ cells as a basis for the altered distribution pattern suggest that the unsaturated form (d18:1–24:1) of GD3 might have increased in Cav‐1+ cells (Fig. 7). This fact may explain, at least partly, the dispersion of GD3 from the GEM/rafts. At this moment, whole features of mechanisms by which various molecules are enriched in GEM/rafts are not fully understood. Several fragmentary pieces of evidence regarding lipid modification of proteins( 50 , 51 ) exchange of combined nucleotides( 52 ) particular peptide sequences that have binding affinity for flotillin( 53 ) or an acylated protein( 54 ) and the length of transmembrane domains or membrane‐proximal sequences( 55 ) have been reported as being involved in GEM/raft anchoring. Regarding glycolipid molecules, there have been no reports on their selective distribution in/out of GEM/rafts. The expression levels of caveolin‐1 should alter the physicochemical status of the GEM/rafts, probably resulting in dynamic changes in the GEM/rafts’ composition. To clarify these issues, more sophisticated and distinctive approaches for characterizing GEM/rafts are needed.
Acknowledgments
We thank Ms. T. Mizuno and Y. Nakayasu for technical assistance.
This study was supported by a Grant‐in‐Aid for Scientific Research on Priority Areas (14082102), and a Grant‐in‐Aid for Scientific Research (16390075) from the Ministry of Education, Culture, Science, Sports and Technology of Japan, and by CREST, Japan Science and Technology Agency (JST).
References
- 1. Harder T, Simons K. Caveolae, DIGs, and the dynamics of sphingolipid‐cholesterol microdomains. Curr Opin Cell Biol 1997; 9: 534–42. [DOI] [PubMed] [Google Scholar]
- 2. Brown DA, London E. Functions of lipid rafts in biological membranes. Annu Rev Cell Dev Biol 1998; 14: 111–36. [DOI] [PubMed] [Google Scholar]
- 3. Palade GE. Fine structure of blood capillaries. J Appl Phys 1953; 24: 1424. [Google Scholar]
- 4. Yamada E. The fine structure of the gall bladder epithelium of the mouse. J Biophys Biochem Cytol 1955; 1: 445–57. [DOI] [PMC free article] [PubMed] [Google Scholar]
- 5. Parton RG. Caveolae and caveolins. Curr Opin Cell Biol 1996; 8: 542–8. [DOI] [PubMed] [Google Scholar]
- 6. Simons K, Ikonen E. Functional rafts in cell membranes. Nature 1997; 387: 569–72. [DOI] [PubMed] [Google Scholar]
- 7. Simons K, Vaz WL. Model systems, lipid rafts, and cell membranes. Annu Rev Biophys Biomol Struct 2004; 33: 269–95. [DOI] [PubMed] [Google Scholar]
- 8. Schnitzer JE, Oh P, McIntosh DP. Role of GTP hydrolysis in fission of caveolae directly from plasma membranes. Science 1996; 274: 239–42. [DOI] [PubMed] [Google Scholar]
- 9. Sukumaran SK, Quon MJ, Prasadarao NV. Escherichia coli K1 internalization via caveolae requires caveolin‐1 and protein kinase Cα interaction in human brain microvascular endothelial cells. J Biol Chem 2002; 277: 50 716–24. [DOI] [PubMed] [Google Scholar]
- 10. Drab M, Verkade P, Elger M et al. Loss of caveolae, vascular dysfunction, and pulmonary defects in caveolin‐1 gene‐disrupted mice. Science 2001; 293: 2449–52. [DOI] [PubMed] [Google Scholar]
- 11. Fielding PE, Fielding CJ. Plasma membrane caveolae mediate the efflux of cellular free cholesterol. Biochemistry 1995; 34: 14 288–92. [DOI] [PubMed] [Google Scholar]
- 12. Smart EJ, Ying Y, Donzell WC et al. A role for caveolin in transport of cholesterol from endoplasmic reticulum to plasma membrane. J Biol Chem 1996; 271: 29 427–35. [DOI] [PubMed] [Google Scholar]
- 13. Kurzchalia TV, Parton RG. Membrane microdomains and caveolae. Curr Opin Cell Biol 1999; 11: 424–31. [DOI] [PubMed] [Google Scholar]
- 14. Lisanti MP, Scherer PE, Vidugiriene J et al. Characterization of caveolin‐rich membrane domains isolated from an endothelial‐rich source : Implications for human disease. J Cell Biol 1994; 126: 111–26. [DOI] [PMC free article] [PubMed] [Google Scholar]
- 15. Williams TM, Lisanti MP. Caveolin‐1 in oncogenic transformation, cancer, and metastasis. Am J Physiol 2005; 288: 494–506. [DOI] [PubMed] [Google Scholar]
- 16. Liu P, Rudick M, Anderson RG. Multiple functions of caveolin‐1. J Biol Chem 2002; 277: 41 295–8. [DOI] [PubMed] [Google Scholar]
- 17. Hakomori SI. Cell adhesion/recognition and signal transduction through glycosphingolipid microdomain. Glycoconj J 2000; 17: 143–51. [DOI] [PubMed] [Google Scholar]
- 18. Sabharanjak S, Sharman P, Parton RG et al. GPI‐Anchored proteins are delivered to recycling endosomes via a distinct cdc42‐regulated, clathrin‐independent pinocytic pathway. Dev Cell 2002; 2: 411–23. [DOI] [PubMed] [Google Scholar]
- 19. Razani B, Schlegel A, Liu J et al. Caveolin‐1, a putative tumor suppressor gene. Biochem Soc Trans 2001; 29: 494–9. [DOI] [PubMed] [Google Scholar]
- 20. Hakomori S. The glycosynapse. Proc Natl Acad Sci USA 2002; 99: 225–32. [DOI] [PMC free article] [PubMed] [Google Scholar]
- 21. Siddiqui B, Buehler J, DeGregorio MW et al. Differential expression of ganglioside GD3 by human leukocytes and leukemia cells. Cancer Res 1984; 44: 5262–5. [PubMed] [Google Scholar]
- 22. Merritt WD, Casper JT, Lauer Sj et al. Expression of GD3 ganglioside in childhood T‐cell lymphoblastic T‐cell lymphoblastic malignancies. Cancer Res 1987; 47: 1724–30. [PubMed] [Google Scholar]
- 23. Okada M, Furukawa K, Yamashiro S et al. High expression of ganglioside α‐2,8‐sialyltransferase (GD3 synthase) gene in adult T‐cell leukemia unrelated to the gene expression of human T‐lymphotropic virus type I. Cancer Res 1993; 56: 2844–8. [PubMed] [Google Scholar]
- 24. Furukawa K, Akagi T, Nagata Y et al. GD2 ganglioside on human T‐lymphotropic virus type I‐infected T cells: Possible activation of beta‐1,4‐N‐acetylgalactosamnyltransferase gene by p40tax . Proc Natl Acad Sci USA 1993; 90: 1972–6. [DOI] [PMC free article] [PubMed] [Google Scholar]
- 25. Yoshida S, Fukumoto S, Kawaguchi H et al. Ganglioside GD2 in small cell lung cancer cell lines: enhancement of cell proliferation and mediation of apoptosis. Cancer Res 2001; 61: 4244–52. [PubMed] [Google Scholar]
- 26. Miura Y, Kainuma M, Jiang H et al. Reversion of the jun‐induced oncogenic phenotype by enhanced synthesis of sialosyllactosylceramide (GM3 ganglioside). Proc Natl Acad Sci USA 2004; 101: 16 204–9. [DOI] [PMC free article] [PubMed] [Google Scholar]
- 27. Satoh M, Ito A, Nojiri H et al. Enhanced GM3 expression, associated with decreased invasiveness, is induced by brefeldin A in bladder cancer cells. Int J Oncol 2001; 19: 723–31. [PubMed] [Google Scholar]
- 28. Portoukalian J, Zwingelstein G, Dore JF. Lipid composition of human malignant melanoma tumors at various levels of malignant growth. Eur J Biochem 1979; 94: 19–23. [DOI] [PubMed] [Google Scholar]
- 29. Carubia JM, Yu RK, Macala LJ et al. Gangliosides of normal and neoplastic human melanocytes. Biochem Biophys Res Commun 1984; 120: 500–4. [DOI] [PubMed] [Google Scholar]
- 30. Hamamura K, Furukawa K, Hayashi T et al. Ganglioside GD3 promotes cell growth and invasion through p130Cas and paxillin in malignant melanoma cells. Proc Natl Acad Sci USA 2005; 102: 11 041–6. [DOI] [PMC free article] [PubMed] [Google Scholar]
- 31. Hauck CR, Hsia DA, Schlaepfer DD. Focal adhesion kinase facilitates platelet‐derived growth factor‐BB‐stimulated ERK2 activation required for chemotaxis migration of vascular smooth muscle cells. J Biol Chem 2000; 275: 41 092–9. [DOI] [PubMed] [Google Scholar]
- 32. Mitsuda T, Furukawa K, Fukumoto S et al. Overexpression of ganglioside GM1 results in the dispersion of platelet‐derived growth factor receptor from glycolipid‐enriched microdomains and in the suppression of cell growth signals. J Biol Chem 2002; 277: 11 239–46. [DOI] [PubMed] [Google Scholar]
- 33. Furukawa K, Clausen H, Hakomori S et al. Analysis of the specificity of five murine anti‐blood group A monoclonal antibodies, including one that identifies type 3 and type 4 A determinants. Biochemistry 1985; 24: 7820–6. [DOI] [PubMed] [Google Scholar]
- 34. Houjou T, Yamatani K, Nakanishi H et al. Rapid and selective identification of molecular species in phosphatidylcholine and sphingomyelin by conditional neutral loss scanning and MS3. Rapid Commun Mass Spectrom 2004; 18: 3123–30. [DOI] [PubMed] [Google Scholar]
- 35. Murata M, Peranen J, Schreiner R et al. VIP21/caveolin is a cholesterol‐binding protein. Proc Natl Acad Sci USA 1995; 92: 10 339–43. [DOI] [PMC free article] [PubMed] [Google Scholar]
- 36. Kawakami Y, Kawakami K, Steelant WF et al. Tetraspanin CD9 is a ‘Proteolipid’, and its Interaction with α3 integrin in microdomain is promoted by GM3 ganglioside, leading to inhibition of laminin‐5‐dependent cell motility. J Biol Chem 2002; 277: 34 349–58. [DOI] [PubMed] [Google Scholar]
- 37. Nishio M, Fukumoto S, Furukawa K et al. Overexpressed GM1 suppresses nerve growth factor (NGF) signals by modulating the intracellular localization of NGF receptors and membrane fluidity in PC12 cells. J Biol Chem 2004; 279: 33 368–78. [DOI] [PubMed] [Google Scholar]
- 38. Kasahara K, Watanabe Y, Yamamoto T et al. Association of src family tyrosine kinase lyn with ganglioside GD3 in rat brain. Possible regulation of lyn by glycosphingolipid in caveolae‐like domains. J Biol Chem 1997; 272: 29 947–53. [DOI] [PubMed] [Google Scholar]
- 39. Kazui A, Ono M, Handa K et al. Glycosylation affects translocation of integrin, src, and caveolin into or out of GEM. Biochem Biophys Res Commun 2000; 273: 159–63. [DOI] [PubMed] [Google Scholar]
- 40. Wang XQ, Sun P, Paller AS. Ganglioside induces caveolin‐1 redistribution and interaction with the epidermal growth factor receptor. J Biol Chem 2002; 277: 47 028–34. [DOI] [PubMed] [Google Scholar]
- 41. Yang G, Truong LD, Timme TL et al. Elevated expression of caveolin is associated with prostate and breast cancer. Clin Cancer Res 1998; 4: 1873–80. [PubMed] [Google Scholar]
- 42. Galbiati F, Volonte D, Engelman JA et al. Targeted downregulation of caveolin‐1 is sufficient to drive cell transformation and hyperactivate the p42/44 MAP kinase cascade. EMBO J 1998; 17: 6633–48. [DOI] [PMC free article] [PubMed] [Google Scholar]
- 43. Razani B, Engelman JA, Wang XB et al. Caveolin‐1 null mice are viable but show evidence of hyperproliferative and vascular abnormalities. J Biol Chem 2001; 276: 38 121–38. [DOI] [PubMed] [Google Scholar]
- 44. Williams TM, Lee H, Cheung MW et al. Combined loss of INK4a and caveolin‐1 synergistically enhances cell proliferation and oncogene‐induced tumorigenesis: Role of INK4a/cav‐1 in mammary epithelial cell hyperplasia. J Biol Chem 2004; 279: 24 745–56. [DOI] [PubMed] [Google Scholar]
- 45. Cao H, Courchesne WE, Mastick CC. A phosphotyrosine‐dependent protein interaction screen reveals a role for phosphorylation of caveolin‐1 on tyrosine 14. Recruitment of C‐terminal src kinase. J Biol Chem 2002; 277: 8771–4. [DOI] [PubMed] [Google Scholar]
- 46. Manes S, Mira E, Gomez‐Mouton C et al. Membrane raft microdomains mediate front‐rear polarity in migrating cells. EMBO J 1999; 18: 6211–20. [DOI] [PMC free article] [PubMed] [Google Scholar]
- 47. Gomez‐Mouton C, Abad JL, Mira E et al. Segregation of leading‐edge and uropod components into specific lipid rafts during t cell polarization. Proc Natl Acad Sci USA 2001; 98: 9642–7. [DOI] [PMC free article] [PubMed] [Google Scholar]
- 48. Turner CE. Paxillin and focal adhesion signalling. Nat Cell Biol 2000; 2: E231–6. [DOI] [PubMed] [Google Scholar]
- 49. Palazzo AF, Eng CH, Schlaepfer DD et al. Localized stabilization of microtubules by integrin‐ and FAK‐facilitated Rho signaling. Science 2004; 303: 836–9. [DOI] [PubMed] [Google Scholar]
- 50. Liang X, Nazarian A, Erdjument‐Bromage H et al. Heterogeneous fatty acylation of src family kinases with polyunsaturated fatty acids regulates raft localization and signal transduction. J Biol Chem 2001; 276: 30 987–94. [DOI] [PubMed] [Google Scholar]
- 51. Mukherjee A, Arnaud L, Cooper JA. Lipid‐dependent recruitment of neuronal src to lipid rafts in the brain. J Biol Chem 2003; 278: 40 806–14. [DOI] [PubMed] [Google Scholar]
- 52. Prior IA, Harding A, Yan J et al. GTP‐dependent segregation of H‐ras from lipid rafts is required for biological activity. Nat Cell Biol 2001; 3: 368–75. [DOI] [PubMed] [Google Scholar]
- 53. Kimura A, Baumann CA, Chiang SH et al. The sorbin homology domain: a motif for the targeting of proteins to lipid rafts. Proc Natl Acad Sci USA 2001; 98: 9098–103. [DOI] [PMC free article] [PubMed] [Google Scholar]
- 54. Wong W, Schlichter LC. Differential recruitment of kv1.4 and kv4.2 to lipid rafts by PSD‐95. J Biol Chem 2004; 279: 444–52. [DOI] [PubMed] [Google Scholar]
- 55. Pike LJ. Lipid rafts: bringing order to chaos. J Lipid Res 2003; 44: 655–67. [DOI] [PubMed] [Google Scholar]