

Abstract
α‐Enolase and c‐myc promoter binding protein 1 are encoded by a single gene, ENO1, and are synthesized from the same transcript through alternative use of translational start sites. We have investigated the localization of ENO1 gene transcripts detected as proteins with an immunohistochemical method and also as mRNA with an in situ hybridization method on tissue sections of oral epithelium and oral squamous cell carcinoma, and demonstrated the differential distribution of the gene transcripts in normal oral epithelium and oral squamous cell carcinoma in humans. Expression of the ENO1 transcript was detectable in the region from the basal cell layers to the lower granular cell layers. Three patterns of ENO1 localization were observed with immunostaining in the epithelia: cytoplasm, nuclei, and both nuclei and cytoplasm. These patterns were observed randomly within the same specimen. In contrast to normal oral epithelium, ENO1 protein was not detectable in the nuclei of carcinoma cells. Our results indicate that differential subcellular localization of ENO1 products may be closely related to carcinogenesis of the oral epithelium. (Cancer Sci 2007; 98: 499–505)
Enolase is a glycolytic enzyme catalyzing the conversion of 2‐phospho‐d‐glycerate to phosphoenolpyruvate. In mammals (including humans) there are three independent genetic loci, called ENO1, ENO3 and ENO2, encoding three isoforms of enolase, α, β and γ, respectively.( 1 , 2 ) Isoform switching takes place along with terminal differentiation into neuronal and skeletal muscle cells from α‐enolase to γ‐ and β‐enolases, respectively. The γ isoform, known as neuron‐specific enolase, is detected mainly in cells of neuronal origin and the β isoform is found mainly in adult skeletal muscle, whereas the α isoform is a major form of enolase present in the early stages of embryonic development, being expressed ubiquitously in different types of tissue.( 3 )
The ENO1 gene is located in chromosomal region 1p36.3‐1p36.2.( 4 , 5 ) This gene encodes an alternatively translated product, in addition to the ENO1 protein, by initiating translation at the Met‐97 residue encoded in exon 5.( 6 ) This product is identified as c‐myc promoter binding protein 1 (MBP‐1). MBP‐1 does not have enzymatic enolase activity.( 7 ) The 48‐kDa form of ENO1 has enzymatic activity and is localized in the cytoplasm or in both cytoplasm and nuclei, whereas the shorter 37‐kDa form (MBP‐1) is preferentially localized in cell nuclei.( 8 ) The two proteins are known to function as negative regulators for c‐myc expression.( 9 )
Recent findings have shown that α‐enolase has several functions besides its innate glycolytic function, and plays an important role in several biological and pathophysiological processes.( 10 , 11 ) In particular, α‐enolase is considered to play potential roles in tumorigenesis. Tumor cells have a higher metabolic rate than surrounding normal tissues, and enolases are considered to be an important factor in cell metabolism. Several lines of evidence suggest that α‐enolase may be involved in cancer invasion and metastasis.( 12 ) Furthermore, an autoantigen of α‐enolase was identified in non‐small cell lung cancer and its overexpression was tightly correlated with poor survival outcomes.( 13 )
Localization of α‐enolase in rat oral epithelium by immunofluorescence microscopy has demonstrated the high level of α‐enolase in oral epithelium, specifically in the cytoplasm of basal cells.( 14 ) However, detailed observations of α‐enolase localization in human oral epithelium and in oral squamous cell carcinoma (SCC) have not been undertaken thus far.
In the present study, we investigated the localization of ENO1 gene transcripts detected as proteins with an immunohistochemical method and also as mRNA with an in situ hybridization method on tissue sections of oral epithelium and oral SCC, and demonstrated the differential distribution of the gene transcripts in normal and carcinoma cells.
Materials and Methods
Tissue samples and histopathology. Ethical approval for this study was granted by the Institutional Review Board of Kawasaki Medical School, and written informed consent was obtained from all patients. Thirteen oral SCC of well differentiated type (five tongues, three gingivae and one buccal mucosa) and of moderately differentiated type (three buccal mucosae and one oral floor), and 13 normal oral epithelia were used for analysis. These tissues were fixed with 4% paraformaldehyde in phosphate‐buffered saline (PBS) at 4°C overnight, and embedded in paraffin.
Serial 7‐µm sections of each tissue were cut, and one section was stained with hematoxylin–eosin and examined pathologically to confirm the diagnosis.
Subcloning of ENO1 and MBP‐1 cDNA. The primers for ENO1 were: forward, CACCATGTCTATTCTCAAGATCCA; reverse, CTTGGCCAAGGGGTTTCTGAAG. The expected size of the polymerase chain reaction (PCR) transcript for ENO1 was 1304 bp starting at the first initiation codon. The primers for MBP‐1 were: forward, CACCATGGATGGAACAGAAAATA; reverse, CTTGGCCAAGGGGTTTCTGAAG. The expected size of the PCR transcript for MBP‐1 was 1014 bp starting at the fourth initiation codon. The PCR was carried out with human skin fibroblast cDNA (Origene Technologies, Rockville, MD, USA) as the template using a reagent kit for the PCR (AmpliTaq GeneAmpR Kit; Applied Biosystems, Foster City, CA, USA) and a thermal cycler (Bio‐Rad, Hercules, CA, USA), according to the manufacturer's protocol. The PCR process consisted of 30 cycles, each cycle including 30 s of denaturing at 94°C, 30 s of annealing at 65°C and 3 min of primer extension at 72°C, with a final extension step of 5 min at 72°C.
Preparation of protein samples. The amplified cDNA for ENO1 and MBP‐1 were inserted into pcDNA3.2/V5/GW/D‐TOPO (Invitrogen, Carlsbad, CA, USA), and the plasmid DNAs were used for transfection in DF‐1 cells( 15 ) with Lipofectamine 2000 (Gibco BRL Life Technologies, Rockville, MD, USA). As a control, the enhanced green fluorescent protein (EGFP) gene in pcDNA3.2 was used to transfect DF‐1 cells. At 24 h after transfection, DF‐1 cells were washed and harvested in cold PBS. Subcellular fractionation was carried out using the ProteoExtract Subcellular Proteome Extraction Kit Mini (EMD Biosciences, Darmstadt, Germany), according to the manufacturer's protocol.
Western blot analysis. Samples containing 5 µg total protein were subjected to electrophoresis through sodium dodecyl sulfate–polyacrylamide gels (SDS‐PAG; 5–20%) (ATTO, Tokyo, Japan), followed by electrophoretic transfer of proteins from SDS‐PAG to polyvinylidene difluoride membranes (Millipore, Bedford, MA, USA). The membranes were blocked in Tris‐buffered saline with Tween 20 (TBST) (20 mM Tris‐HCl [pH 7.5], 150 mM NaCl, 0.1% Tween 20) containing 5% skim milk (Morinaga Milk Industry, Tokyo, Japan) and 1% bovine serum albumin (Sigma‐Aldrich, St. Louis, MO, USA) at room temperature for 60 min. Rabbit anti‐enolase antibody (H‐300; Santa Cruz, Biotechnology, Santa Cruz, CA, USA) and rabbit anti‐V5 antibody (Benthyl Laboratories, Montgomery, TX, USA) were used as primary antibodies at dilutions of 1:500 and 1:5000, respectively, by incubating overnight at 4°C. Membranes were then incubated at room temperature for 60 min with a secondary antibody. ECL‘ antirabbit IgG, peroxidase‐linked species‐specific whole antibody (Amersham Biosciences, Buckinghamshire, UK) was used as the secondary antibody at a 1:20 000 dilution. After washing with TBST, the signals were detected using the ECL Plus System (Amersham Biosciences) with a 1:10 dilution of the regent mixture. To estimate protein fractionation, rabbit anti‐GSK3β antibody (H‐76; Santa Cruz) was used as the primary antibody at a dilution of 1:200 for the cytoplasmic protein fraction.
Immunocytochemistry. DF‐1 cells were cultured on glass slides (Laboratory‐Tek Chamber Slide; Nalge Nunc International, Naperville, IL, USA) and were transfected with plasmid DNA encoding ENO1 and MBP‐1 cDNA using Lipofectamine 2000. At 24 h after transfection, DF‐1 cells were fixed with 4% paraformaldehyde at 4°C for 15 min, washed in PBS, and incubated in PBS containing 0.1% Triton X‐100 at room temperature for 10 min. After pretreatment with 10% goat serum, rabbit anti‐enolase antibody (Santa Cruz) and mouse anti‐V5 antibody (Serotec, Oxford, UK) were used as the primary antibodies, with incubation at room temperature for 60 min at dilutions of 1:200 and 1:2000, respectively. After washing with PBS, Alexa488‐conjugated goat antirabbit and Alexa594‐conjugated goat antimouse IgG (Molecular Probes, Eugene, OR, USA) were used as the secondary antibodies, with incubation at room temperature for 60 min at dilutions of 1:600. The cells were rinsed in PBS and nuclei were counterstained with 0.5 µg/mL 4′,6‐diamidino‐2‐phenylindole (Wako Pure Chemical, Kumamoto, Japan) at room temperature for 10 min. As a negative control, PBS was used instead of the primary antibody in the same procedure.
RNA probe synthesis. The primers for ENO1 were: forward, GCGTTCAATGTCATCAATGG; reverse, GTTGACTTTGAGCAGGAGGC. The expected size of the PCR transcript of ENO1 was 591 bp. The primers for ENO3 were: forward, CGCAATGGGAAGTACGATCT; reverse, ACTTGCGTCCAGCAAAGATT. The expected size of the PCR transcript for ENO3 was 526 bp. The primers for ENO2 were: forward, GAACAGTGAAGCCTTGGAGC; reverse, CCAGGTCAGCAATGAATGTG. The expected size of the PCR transcript for ENO2 was 497 bp. Human skin fibroblast cDNA, human muscle cDNA and human testis cDNA (Origene Technologies) were used as templates for ENO1, ENO3 and ENO2, respectively. The PCR process consisted of 35 cycles, each cycle including 15 s of denaturing at 94°C, 30 s of annealing at 60°C and 5 min of primer extension at 72°C, with the final extension step of 5 min at 72°C. After purification of the PCR products, ENO1, ENO3 and ENO2 cDNAs were inserted into pCRII‐TOPO (Invitrogen), and used to transform DH5α competent cells (Gibco BRL). The plasmids containing cDNAs for ENO1, ENO3 and ENO2 were confirmed by sequencing reaction, and were linearized with a restriction enzyme, BamHI or HindIII. Sense and antisense RNA probes were transcribed in vitro with T3 or T7 RNA polymerase using the linearized plasmid and digoxigenin (DIG)‐labeled uridine triphosphate (Boehringer Mannheim, Mannheim, Germany).
In situ hybridization. Deparaffinized sections were pretreated with 0.5 µg/mL proteinase K and then treated with 0.1 M triethanolamine containing 0.25% acetic anhydride. The sections were hybridized with DIG‐labeled antisense RNA probes for ENO1, ENO3 and ENO2 for 16–17 h at 65°C in prehybridization mix (50% formamide, 5× saline sodium citrate [pH 7.0], 50 µg/mL tRNA, 1% SDS, 50 µg/mL heparin and 10% dextran sulfate). Stringent washes were carried out for 80 min at 65°C with 50% formamide in 2× saline sodium citrate. The anti‐DIG antibody coupled to alkaline phosphatase (Boehringer Mannheim) was used at a dilution of 1:2500 for 2 h at 15°C. Alkaline phosphatase was detected by incubation with diluted 5‐bromo‐4‐chloro‐3‐indolyl phosphate and nitroblue tetrazolium for 1–2 days at room temperature. As a negative control, we used sense cRNA instead of antisense cRNA. Nuclear counterstaining was accomplished using 0.1% Nuclear fast red (Certistain; Merck, Darmstadt, Germany) containing 5% aluminum sulfate solution.
Immunohistochemistry. The 7‐µm sections were deparaffinized. Immunohistochemical staining of the sections was done using methods similar to those used for immunocytochemistry. The dilution of each antibody was as follows: rabbit anti‐enolase antibody as the primary antibody at a dilution of 1:80; and Alexa488‐conjugated goat antirabbit IgG as the secondary antibody at a dilution of 1:400. For counting cells with nuclear and cytoplasmic staining, five microscopic fields with 400‐fold magnification were chosen randomly and the mean above 10% of the total cell numbers was deduced to be positive.
Results
Western blot analysis using rabbit anti‐enolase antibody identified 51.3‐kDa (exogenous α‐enolase), 47.2‐kDa (endogenous α‐enolase), 40.7‐kDa (exogenous MBP‐1) and 36.6‐kDa (endogenous MBP‐1) proteins (Fig. 1a). Rabbit anti‐V5 antibody identified both the 51.3‐kDa and 40.7‐kDa proteins (Fig. 1b). Exogenous α‐enolase and MBP‐1 proteins were slightly larger than endogenous proteins because of additional peptide derived from the V5 epitope and linker sequence of the vector. The level of α‐enolase protein was high in the cytoplasmic fraction and low in the nuclear fraction, whereas the level of MBP‐1 protein was high in the nuclear fraction and low in the cytoplasmic fraction. GSK3β signals, used to estimate cytoplasmic protein, were detected in the cytoplasmic fraction but not in the nuclear fraction (Fig. 1c).
Figure 1.
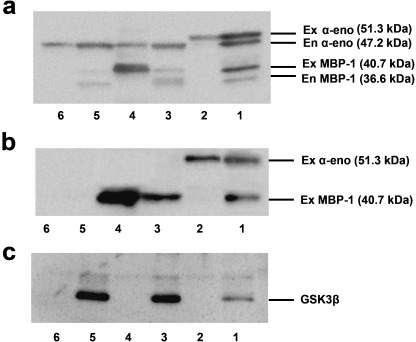
Western blot analysis of fractionated nuclear and cytoplasmic proteins in ENO1‐, MBP‐1‐ and EGFP‐transfected DF‐1 cells: cytoplasmic fraction of α‐enolase (lane 1), nuclear fraction of α‐enolase (lane 2), cytoplasmic fraction of MBP‐1 (lane 3), nuclear fraction of MBP‐1 (lane 4), cytoplasmic fraction of EGFP (lane 5), and nuclear fraction of EGFP (lane 6). These proteins were detected by the (a) anti‐enolase, (b) anti‐V5 and (c) anti‐GSK3β antibodies. α‐eno, α‐enolase; En, endogenous; Ex, exogenous.
With indirect double immunofluorescence staining for ENO1‐transfected DF‐1 cells using anti‐enolase antibody and anti‐V5 antibody as primary antibodies, α‐enolase staining was observed in both cytoplasm and nuclei, and cytoplasmic staining was stronger than nuclear staining, well above the level of endogenous enolase staining (Fig. 2a–d). With staining for MBP‐1‐transfected DF‐1 cells using the same antibodies, MBP‐1 staining was also observed in both cytoplasm and nuclei, but nuclear staining was stronger than cytoplasmic staining (Fig. 2e–h). In non‐transfected DF‐1 cells low‐level enolase staining was observed in both cytoplasm and nuclei, with no staining using anti‐V5 antibody (Fig. 2i–l).
Figure 2.
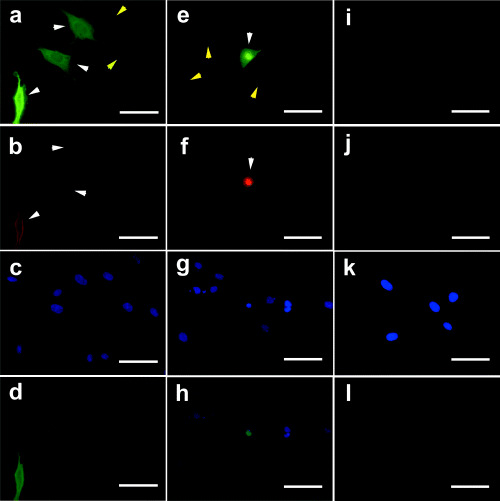
Immunolocalization of (a–d) ENO1, (e–h) MBP‐1 and (i–l) endogenous proteins in DF‐1 cells. Indirect double immunocytochemical staining was carried out with (a,e,i) rabbit anti‐enolase antibody (green) and (b,f,j) mouse anti‐V5 antibody (red), and nuclei were counterstained with (c,g,k) 4′,6‐diamidino‐2‐phenylindole (DAPI) (blue). (d,h,l) Merged images of ENO1 and DAPI double staining. ENO1‐transfected DF‐1 cells (white arrow) and non‐transfected DF‐1 cells (yellow arrow) (a–d), one MBP‐1‐transfected DF‐1 cell (white arrow) and non‐transfected DF‐1 cells (yellow arrow), and non‐transfected DF‐1 cells (yellow arrow) (e–h), non‐transfected DF‐1 cells (i–l). Scale bar = 50 µm.
Figure 3 shows immunohistochemical staining of normal human oral epithelia from palate (Fig. 3b–d), buccal mucosa (Fig. 3f–h), and tongue (Fig. 3j–l), accompanied with in situ hybridization for ENO1 in palate (Fig. 3a), buccal mucosa (Fig. 3e), and tongue (Fig. 3i). Although ENO1 transcripts were detectable in all sections examined, expression of ENO2 and ENO3 transcripts was not detectable in oral epithelia with in situ hybridization (data not shown). The ENO1 signals were detectable in the basal layer cells, spinous layer cells and lower granular layer cells. The ENO1 signals in the spinous layer cells were of the highest intensity among cells in these three layers (Fig. 3a,e,i). Expression patterns of the ENO1 gene in normal oral epithelium are summarized in Table 1. Hybridization signals in the spinous cell layer were strongly positive for gingiva, tongue, buccal mucosa, lip and one out of two palates. In tongue, variable levels of hybridization signals were detectable − four positive and one strong positive. In the normal oral epithelia, indirect immunofluorescence staining for ENO1 proteins showed three patterns of signal distribution: cytoplasm (Fig. 3b–d), cytoplasm and nuclei (Fig. 3f–h), and nuclei (Fig. 3j–l). The expression patterns of ENO1 transcripts in the normal oral epithelia are summarized in Table 2. ENO1 transcripts were detectable in the cytoplasm and in the nuclei, depending on the location of the same specimen. Six out of 13 normal oral epithelial samples contained granular cell layers. ENO1 transcripts were localized only in the cytoplasm in the granular cell layer.
Figure 3.
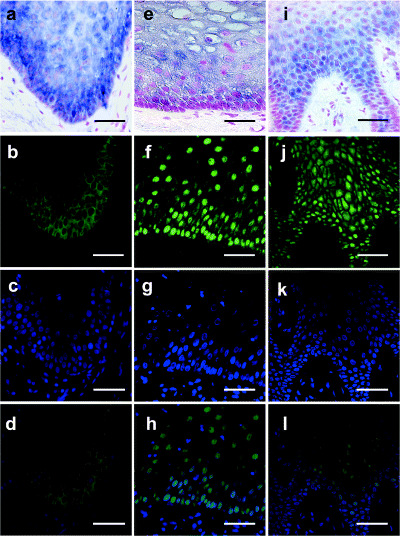
Localization of the ENO1 protein in normal oral epithelia from (b–d) palate, (f–h) buccal mucosa and (j‐l) tongue, accompanied with in situ hybridization for ENO1 in (a) palate, (e) buccal mucosa and (i) tongue. Indirect immunofluorescence staining was carried out with anti‐enolase antibody (green) and nuclei were counterstained with 4′,6‐diamidino‐2‐phenylindole (DAPI) (blue). Panels show signals in (b) cytoplasm, (f) nuclei, (j) cytoplasm and nuclei. (d,h,l) Merged images of ENO1 and DAPI double labeling. (a,e,i) In situ hybridization showing the staining pattern using an ENO1 probe. Scale bar = 50 µm.
Table 1.
Summary of expression pattern of human ENO1 mRNA in normal oral epithelia
| Location | No. samples | Basal cell layer | Spinous cell layer | Granular cell layer |
|---|---|---|---|---|
| Palate | 2 | + | + ∼ ++ | + |
| Gingiva | 2 | + | ++ | + |
| Tongue | 5 | + ∼ ++ | ++ | + † |
| Buccal mucosa | 2 | + | ++ | ND ‡ |
| Lip | 2 | + | ++ | ND ‡ |
Granular cell layer was absent in three out of five tongue sections.
Granular cell layer was absent in all sections. +, Positive; ++, strong positive; ∼, variation in staining; ND, no data.
Table 2.
Summary of expression pattern of human ENO1 protein in normal oral epithelia
| Location | No. samples | Basal cell layer | Spinous cell layer | ||||
|---|---|---|---|---|---|---|---|
| N | C | N + C | N | C | N + C | ||
| Palate | 2 | 1 | 1 | 0 | 0 | 1 | 1 |
| Gingiva | 2 | 1 | 1 | 0 | 0 | 1 | 1 |
| Tongue | 5 | 0 | 4 | 1 | 2 | 1 | 2 |
| Buccal mucosa | 2 | 1 | 1 | 0 | 1 | 0 | 1 |
| Lip | 2 | 0 | 1 | 1 | 1 | 0 | 1 |
| Total | 13 | 3 | 8 | 2 | 4 | 3 | 6 |
C, cytoplasm; N, nucleus; N + C, nucleus and cytoplasm.
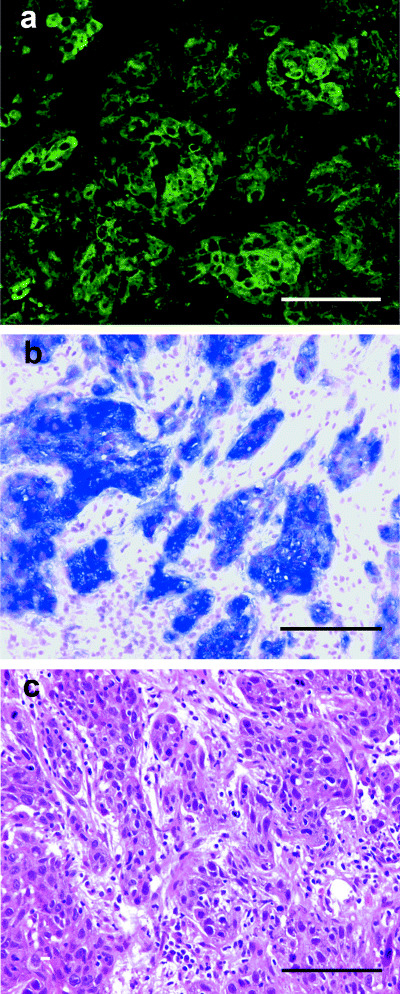
With indirect immunofluorescence labeling, three patterns of localization of ENO1 transcripts were also observed at random on the same specimens adjacent to SCC (Fig. 4). The sections for the well‐differentiated type of lingual SCC revealed intense ENO1 signals (Fig. 4b,c–e). These sections included lingual epithelium and showed three patterns of localization for ENO1 transcripts (Fig. 4f–n). In the moderately differentiated type of SCC of the oral floor, ENO1 mRNA signals were detected intensely in the cytoplasm of parenchymal cells, with the exception of keratinized areas. No ENO1 signals were detectable in the nuclei of parenchymal cells, although ENO1 mRNA was detected intensely in parenchymal cells (Fig. 5a,b). We examined 13 oral SCC samples. Nine samples were of the well‐differentiated type, and the remaining four samples were of the moderately differentiated type. There was no correlation between subcellular localization of ENO1 products and histopathological grading of oral SCC between stages I to IV examined in the present study. Although ENO1 transcripts were not detected in stromal cells, they were observed in parenchymal cells, with the exception of keratinized areas.
Figure 4.
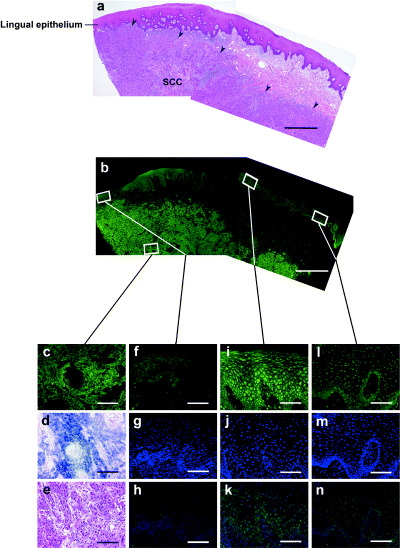
Diverse localization of ENO1 in lingual epithelium adjacent to squamous cell carcinoma (SCC). Hematoxylin–eosin staining showed SCC (arrows) under the submucosa (a,e). Indirect immunofluorescent double labeling demonstrated that anti‐enolase antibody (green) was localized to the cytoplasm in parenchymal cells of (b,c) SCC and (b,f,i,l) lingual epithelium: (f) cytoplasm, (i) cytoplasm and nuclei, (l) nuclei. (h,k,n) Merged images of ENO1 and 4′,6‐diamidino‐2‐phenylindole double labeling. (d) In situ hybridization analysis showing the staining pattern using an ENO1 probe. Scale bars: (a,b) 1 mm, (c–e) 100 µm, and (f–n) 50 µm.
Figure 5.
Distribution of ENO1 protein in the moderately differentiated type of squamous cell carcinoma (SCC) of the oral floor. (a) Indirect immunofluorescence labeling demonstrated that the anti‐enolase antibody (green) localized to the cytoplasm in parenchymal cells of the moderately differentiated type of oral SCC. (c) Hematoxylin–eosin staining showed moderately differentiated cells. (b) In situ hybridization analysis showing the staining pattern with an ENO1 probe in parenchymal cells of the moderately differentiated type of oral SCC. Scale bar = 100 µm.
Discussion
Because MBP‐1 mRNA is identical to ENO1 mRNA, any in situ probe for ENO1 can detect both signals. The polyclonal H‐300 antibody also recognizes both MBP‐1 and α‐enolase proteins, and we were therefore unable to determine whether the signals were derived from α‐enolase or MBP‐1. The rabbit anti‐enolase antibody detects ENO1, ENO2 and ENO3 proteins. However, the ENO2 and ENO3 transcripts were not detectable in oral epithelia or oral SCC with in situ hybridization. Because only ENO1 transcripts were detected in oral epithelia and oral SCC, signals detected by the H‐300 antibody represent ENO1 gene products.
The H‐300 antibody recognizes enolase at amino acids 1–300 of the proteins, and the endogenous ENO1 proteins are difficult to detect by immunoblotting of the oral samples owing to lower levels of expression. We therefore used the expression constructs bearing ENO1 and MBP‐1 cDNA with V5 tags at the C‐terminal ends for transfection in culture cells. Immunofluorescent detection of the ENO1‐V5 and MBP‐1‐V5 proteins either with H‐300 antibody or with V5 antibody in transfected cells demonstrated preferential cytoplasmic localization after ENO1‐V5 transfection, and intense nuclear localization after MBP‐1‐V5 transfection (Fig. 2). Protein bands detected by immunoblotting of the fractionated protein extracts with H‐300 and V5 antibodies after expressing ENO1‐V5 or MBP‐1‐V5 constructs also indicate the preferential nuclear and cytoplasmic localization of MBP‐1 and α‐enolase, respectively, although minor bands were detectable in the cytoplasmic fraction after MBP‐1‐V5 transfection owing to extremely high levels of expression compared with endogenous expression (Fig. 1). These results suggest that H‐300 antibody can detect both cytoplasmic ENO1 and MBP‐1 proteins and nuclear ENO1 and MBP‐1 proteins, and that ENO1 and MBP‐1 proteins are localized preferentially in the cytoplasm and nuclei, respectively, after overexpression of ENO1 and MBP‐1 cDNA.
We here demonstrated the distribution of endogenous ENO1 protein and mRNA in human oral epithelium and in oral SCC. The expression levels of ENO1 in oral epithelium were not as high as those in basal layer cells, although intense ENO1 signals were detectable in oral epithelium. ENO1 protein showed three patterns of localization. Cytoplasmic localization may correlate with the glycolytic function required for cell proliferation and differentiation during the renewal of oral epithelium. In oral SCC, ENO1 immunoreactivity was detected intensely in the cytoplasm of parenchymal cells, with the exception of keratinized areas, whereas no staining was observed in the nuclei of parenchymal cells.
The c‐myc protooncogene can promote cell proliferation and oncogenic transformation, or apoptosis under certain conditions.( 7 , 16 ) Regulation of c‐myc occurs at multiple levels, such as at the initiation or termination of transcription and at the attenuation of transcription.( 17 , 18 ) MBP‐1 downregulation caused by or resulting in c‐myc activation may result in malignant transformation of oral epithelium. Because c‐myc is one of the target genes against MBP‐1, we examined c‐myc expression in normal oral epithelia and in oral SCC. No signals were detectable by immunostaining for c‐Myc protein in oral SCC, whereas signals were variable depending on specimen in normal oral epithelium (data not shown). Further studies are required for clarification.
The ENO1 transcripts in the spinous cell layers were the most intense among layers. The progenitor compartment of the oral epithelium is not homogeneous, but consists of two functionally distinct subpopulations of cells. A small population of progenitor cells undergoes a very slow cycle and is considered to represent stem cells, whose function is to produce basal layer cells and retain the proliferative potential of the tissue. The larger portion of the progenitor compartment is composed of amplifying cells, whose function is to increase the number of cells available for subsequent maturation.( 19 )
In conclusion, the present study provides new and important findings on the subcellular distribution of ENO1 proteins in normal oral epithelium and oral SCC. Our results indicate that the ENO1 gene may be closely related to the carcinogenesis of oral epithelium.
Acknowledgments
The authors wish to thank Kumiko Terada, Satomi Misao, Keiko Isoda, Kazumi Wakabayashi and Yoko Yoshida for excellent technical help. This work was supported in part by Research Project Grants (17‐101N and 17‐108N) from Kawasaki Medical School.
References
- 1. Fletcher L, Rider CC, Taylor CB. Enolase isoenzymes. III. Chromatographic and immunological characteristics of rat brain enolase. Biochim Biophys Acta 1976; 452: 245–52. [DOI] [PubMed] [Google Scholar]
- 2. Pearce JM, Edwards YH, Harris H. Human enolase isozymes: electrophoretic and biochemical evidence for three loci. Ann Hum Genet 1976; 39: 263–76. [DOI] [PubMed] [Google Scholar]
- 3. Giallongo A, Oliva D, Cali L et al. Structure of the human gene for alpha‐enolase. Eur J Biochem 1990; 190: 567–73. [DOI] [PubMed] [Google Scholar]
- 4. D’Ancona GG, Chern CJ, Benn P, Croce CM. Assignment of the human gene for enolase 1 to region pter in equilibrium p36 of chromosome 1. Cytogenet Cell Genet 1977; 18: 327–32. [DOI] [PubMed] [Google Scholar]
- 5. Onyango P, Lubyova B, Gardellin P, Kurzbauer R, Weith A. Molecular cloning and expression analysis of five novel genes in chromosome 1p36. Genomics 1998; 50: 187–98. [DOI] [PubMed] [Google Scholar]
- 6. Ejeskar K, Krona C, Caren H et al. Introduction of in vitro transcribed ENO1 mRNA into neuroblastoma cells induces cell death. BMC Cancer 2005; 5: 161. [DOI] [PMC free article] [PubMed] [Google Scholar]
- 7. Spencer CA, Groudine M. Control of c‐myc regulation in normal and neoplastic cells. Adv Cancer Res 1991; 56: 1–48. [DOI] [PubMed] [Google Scholar]
- 8. Wang W, Wang L, Endoh A, Hummelke G, Hawks CL, Hornsby PJ. Identification of α‐enolase as a nuclear DNA‐binding protein in the zona fasciculata but not the zona reticularis of the human adrenal cortex. J Endocrinol 2005; 184: 85–94. [DOI] [PubMed] [Google Scholar]
- 9. Subramanian A, Miller DM. Structural analysis of α‐enolase: mapping the functional domains involved in the down‐regulation of the c‐myc proto‐oncogene. J Biol Chem 2000; 275: 5958–65. [DOI] [PubMed] [Google Scholar]
- 10. Sirover MA. New insights into an old protein: the functional diversity of mammalian glyceraldehyde‐3‐phosphate dehydrogenase. Biochem Biophys Acta 1999; 1432: 159–84. [DOI] [PubMed] [Google Scholar]
- 11. Sirover MA. Emerging new functions of the glycolytic protein, glyceraldehyde‐3‐phosphate dehydrogenase, in mammalian cells. Life Sci 1996; 58: 2271–7. [DOI] [PubMed] [Google Scholar]
- 12. Chang YS, Wu W, Walsh G, Hong WK, Mao L. Enolase‐alpha is frequently down‐regulated in non‐small cell lung cancer and predicts aggressive biological behavior. Clin Cancer Res 2003; 9: 3641–4. [PubMed] [Google Scholar]
- 13. Chang GC, Liu KJ, Hsieh CL et al. Identification of α‐enolase as an autoantigen in lung cancer: its overexpression is associated with clinical outcomes. Clin Cancer Res 2006; 12: 5746–54. [DOI] [PubMed] [Google Scholar]
- 14. Zieske JD, Bukusoglu G, Yankauckas MA, Wasson ME, Keutmann HT. Alpha‐enolase is restricted to basal cells of stratified squamous epithelium. Dev Biol 1992; 151: 18–26. [DOI] [PubMed] [Google Scholar]
- 15. Stavnezer E, Gerhard DS, Binari RC, Balazs I. Generation of transforming viruses in cultures of chicken fibroblasts infected with an avian leukosis virus. J Virol 1981; 39: 920–34. [DOI] [PMC free article] [PubMed] [Google Scholar]
- 16. Cole MD. The myc oncogene: its role in transformation and differentiation. Annu Rev Genet 1986; 20: 361–84. [DOI] [PubMed] [Google Scholar]
- 17. Marcu KB, Bossone SA, Patel AJ. Myc function and regulation. Annu Rev Biochem 1992; 61: 809–60. [DOI] [PubMed] [Google Scholar]
- 18. Ray R, Miller DM. Cloning and characterization of a human c‐myc promoter‐binding protein. Mol Cell Biol 1991; 11: 2154–61. [DOI] [PMC free article] [PubMed] [Google Scholar]
- 19. Squier CA, Hill MW. Oral mucosa. In: Cate AR, ed. Oral Histology: Development, Structure, and Function, 4th edn. St Louis: Mosby‐Year Book, 1994: 389–431. [Google Scholar]