

Abstract
The concepts of made‐to‐order and low‐invasiveness medicines are becoming widely accepted. A treatment for cancer, with minimum invasive surgery and without lymph nodes dissection based on sentinel lymph node (SN) navigation surgery, would adhere to these concepts. Dyes and/or radioisotopes are employed for SN detection in standard methods, however, each detection method has advantages and disadvantages. To make up for the disadvantages, we aimed at developing a new non‐invasive method using fluorescent beads of uniform nano‐size that could efficiently visualize SN from outside the body, and conducted experiments to determine the appropriate size and fluorescent wavelength. We examined various bead sizes and fluorescent wavelengths. The sizes were 20, 40, 100 and 200 nm. The fluorescent peak wavelengths of the beads were yellow‐green (515 nm), dark red (680 nm), far red (720 nm) and infrared (755 nm). The beads were subcutaneously injected into the foot pad of the hind leg of a rat, and followed by laser scanning of the inguinal area for fluorescence observation. The beads exhibited different times for the fluorescence detection according to their sizes and wavelength. The 40 nm beads were considered to be the most appropriate size for SN detection in rats. The wavelength of near infrared was effective for avoiding attenuation by the tissue. In conclusion, we confirmed that uniformly nano‐sized fluorescent beads have the potential to be an alternative to existing tracers in the detection of the SN in animal experiments if we select the appropriate particle size and wavelength. (Cancer Sci 2005; 96: 353–356)
The sentinel node (SN) is the first lymph node on the lymphatic drainage pathway from the cancerous tumor. In cases where the SN has a metastasis, there is the possibility of another positive node. When the SN is negative for metastasis, we can consider that there will be no other positive node and lymph node dissection (LND) is not necessary except for of the SN. This leads to the avoidance of functional or organic complication after LND. Preventive and systematic LND in cancer surgery has been accepted as a standard technique for over 100 years, however, the modern concept of minimizing the invasiveness of medical treatment is changing surgical procedures. This SN navigation surgery presents a new choice to patients as a made‐to‐order medical treatment. There are two major methods for detection of SN using tracer molecules: (i) a dye method in which iso‐sulfan blue is used; and (ii) a radioisotope (RI) method in which 99mTc with phytic acid is used. They are subcutaneously injected at the periphery of the tumor, and then the SN can be identified through tracer accumulation.( 1 , 2 , 3 , 4 ) High sensitivity in the detection of an SN can be achieved using these two methods together. However, there are disadvantages for each method. The dye method requires some great skill, and cannot be detected without a skin incision. The RI method requires radioactive agents it, therefore, can only be performed at certain hospitals because of the regulations for handling these.
To make up for the disadvantages, we designed fluorescent nano‐sized beads as a new alternative tracer. There are many factors that might influence their movement in the lymphatic system when particles are subcutaneously administered in vivo. We noted the particle size as the most important factor. Small sized particles immediately move into lymphatic capillaries and pass through the interstices of the endothelial cells from the interstitial tissue. Large‐sized particles are carried by macrophages after phagocytosis.( 5 ) It is necessary to determine the appropriate size for SN accumulation by passive lymphatic movement.
We used nanosized fluorescent beads of extremely narrow diameter distribution. Autofluorescence, optical absorption and scattering in living tissue are the factors that prevent us from optical measurement deep in a living body. Therefore we need to use a light source with an appropriate wavelength for effective excitation. In this study, we examined the detection of SN from outside the body using various particle sizes and wavelengths to determine the optimum size and wavelength. These data should aid the adoption of a fluorescence measurement method in the future.
Materials and Methods
Fluorescent beads. We used ‘FluoSpheres’ manufactured from high‐quality, ultraclean polystyrene microspheres by Molecular Probe (Oregon, USA). There are various bead sizes and fluorescent colors. We selected beads of sizes 20, 40, 100, and 200 nm and fluorescent colors of yellow‐green (YG) (excitation/emission maxima at 505/515 nm), dark red (DR) (660/680 nm), far red (FR) (690/720 nm) and infrared (IR) (715/755 nm). The beads diameter distribution is very small, that is, 0.02 ± 0.004 µm in 20 nm size (i.e. within 20% error) and 0.1 ± 0.005 µm in 100 nm (i.e. within 5% error).
Animals. We used male, 6–9 weeks old, Donryu rats (180∼250 g) in the experiment.
Instrumentation. We designed a laser scanning fluorescence detection system, which consists of three lasers, a resonant scanner (resonant frequency/200 Hz), a rotational pulse‐stage and a charge‐coupled device (CCD) camera (Fig. 1a). We used a diode pumped solid‐state blue laser (wavelength 473 nm, output power 7 mW) as the excitation source of YG fluorescent beads. For excitation of DR, FR, and IR fluorescent beads, we used a He‐Ne laser (632.8 nm, 14.6 mW) or a laser diode (657 nm, 3.56 mW). The inguinal and femoral areas were continuously irradiated and scanned over an area of 30 × 50 mm. The fluorescence image was observed using a CCD camera (XC‐EI50, Sony) with an optimum band‐pass filter for each fluorescent bead. In addition, the spectrum of scanned area was analyzed with spectro‐meter.
Figure 1.
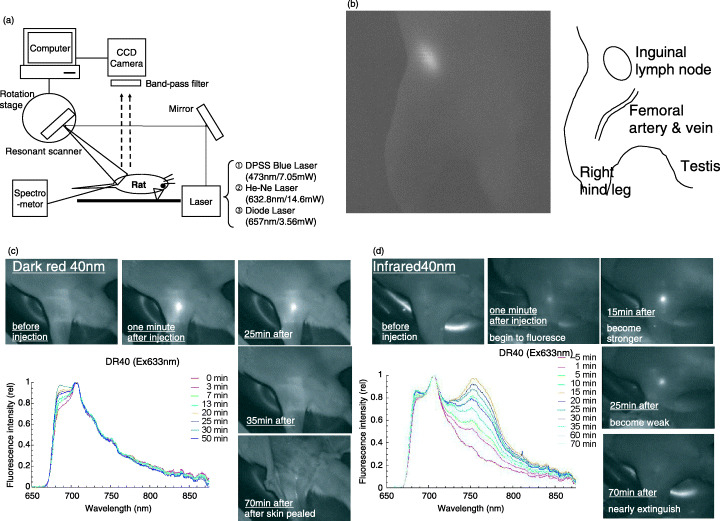
Sentinel node imaging using nano‐sized fluorescent particle in the rat. (a) Instrumentation for fluorescence imaging system. (b) Fluorescence image of right inguinal node and its illustration. (c) Fluorescence image and spectral analysis of right inguinal node after injection of dark red 40 nm‐beads. Spectral analysis shows that emission is strongest 30 min after injection. (d) Fluorescence image and spectral analysis of right inguinal node after injection of infrared 40 nm‐beads. Spectral analysis shows that emission is strongest 15 min after injection.
Procedure
Under ether anesthesia, the hair of the rats’ lower body was removed to avoid autofluorescence of it. Then 50 µL of FluoSpheres 2% w/vol suspension was subcutaneously injected at the foot pad of the hind leg.
Spectral analysis of fluorescence from rats injected with beads was performed to clarify the signal to noise ratio of fluorescence from beads and autofluorescence. After observation from outside the body (through the skin) for 30–180 min, we peeled back the skin at the subcutaneous layer and ascertained the area of lymph nodes with navigation of their specific fluorescence. Then, the lymph nodes were removed, fixed with formalin and embedded in paraffin. Afterwards histological observation was performed with HE stain to confirm that the tissue was a lymph node.
This experiment was carried out based on the guidelines for animal experiments at Tohoku University, after acknowledgment by the committee on animal experiments.
We used the z approximation on two proportions of two independent groups and Student's t‐test for the mean as a statistical analysis methods.
Results
Particle sizes. We conducted the experiment on four types of beads with diameters of 20, 40, 100 and 200 nm (Table 1).
Table 1.
Particle size of fluorescent beads
| Diameter | Total no. rats (total no. legs) | No. fluorescent legs | Positive rate of fluorescence detection | Average time to fluorescence detection (min) | SE | SD | Mdn |
|---|---|---|---|---|---|---|---|
| 20 nm | 13 (22) | 10 | 45% † | 2.5 ‡ | 0.6 | 1.8 | 2.0 |
| 40 nm | 40 (72) | 50 | 69%[Link], [Link], [Link] | 4.6 [Link] , [Link] , [Link] | 0.9 | 7.0 | 3.0 |
| 100 nm | 5 (10) | 2 | 20% § | 56.0 ¶ | 54.0 | 76.0 | 56.0 |
| 200 nm | 10 (18) | 7 | 39%** | 127.0 †† | 20.0 | 53.0 | 135.0 |
Total number of rats employed in the experiment was 68 (122 legs). † P = 0.040 (Z = 2.05). ‡ P = 0.032 (t‐test). § P = 0.002 (Z = 3.04). ¶Sample is too small to analyze. **P = 0.016 (Z = 2.41). †† P = 0.0005 (t‐test). SE, standard error; SD, standard deviation; Mdn, median.
In the experiment using 20 nm beads, 22 feet from 13 rats were tested. SN were detected in 10 feet of 22 (45%) by fluorescence contrast. The time of detection from injection was 0–6 min. The average time for detection was 2.5 min and the median time was 2 min. For 40 nm beads, SN were detected in 50 of 72 feet (69%). The time of detection from injection was 0–28 min. SN in 42 feet were detected within 5 min. It was the most representative case (84%). The average time was 4.6 min and the median time was 3 min. For 100 nm beads, SN were detected in two of 10 feet (20%). The average and median times were both 56 min. And for 200 nm beads, SN were detected in seven of 18 feet (39%). The average time was 127 min. The median time was 135 min.
In the 40 and 20 nm experiments, there was a significant difference in both the ‘positive rate’ and ‘average time’. In the same way, we compared 40 with 100 or 200 nm beads (Table 1).
Fluorescent wavelengths. We investigated three excitation and emission wavelengths with the 40 nm beads; YG, DR and IR. Beads of 40 nm in diameter were found to be the most suitable size in the particle size experiment.
In the experiment using YG, 10 feet from five rats were tested. SN in three of 10 feet (30%) were observed by fluorescence measurement. With DR, SN in 24 of 31 feet (77%) were observed and with IR, SN in 23 of 31 feet (74%) were observed.
DR and IR have the advantage of ‘positive rate of fluorescence detection’ as compared with YG (Table 2).
Table 2.
Wavelength of fluorescent beads at 40 nm
| Fluorescent wavelength Excitation/Emission | Total no. rats (total no. legs) | No. fluorescent legs | Positive rate of fluorescence detection | Average time to fluorescence detection (minutes) | SE | SD | Mdn |
|---|---|---|---|---|---|---|---|
| Yellow‐green 505/515 | 5 (10) | 3 | 30% [Link] , [Link] | 13.0 | 5.4 | 9.3 | 10.0 |
| Dark red 660/680 | 19 (31) | 24 | 77% † , § | 6.0 ¶ | 1.8 | 8.8 | 2.5 |
| Infrared 715/755 | 16 (31) | 23 | 74% ‡ , § | 2.1 ¶ | 0.3 | 1.4 | 2.0 |
Total number of rats employed in the experiment was 68 (122 legs). † P = 0.005 (Z = 2.75). ‡ P = 0.011 (Z = 2.52). § P = 0.766 (Z = 0.29). ¶ P = 0.020 (t‐test). SE, standard error; SD, standard deviation; Mdn, median.
Discussion
The time of detection from tracer injection and the duration of marking are important for the detection of SN in practical surgery. It is ideal that the tracer reaches SN soon after injection and is trapped for a long time without moving to another lymph node. In this experiment, 100 and 200 nm sized beads took too long to reach SN, and the detection time was not reproducible. In contrast, in the case of 20 nm beads, we could observe the fluorescence right after injection but they disappeared immediately. Therefore the size of 20 nm was too small to be trapped in the SN. Based on this and the statistical analysis of this experiment (Table 1), it was considered that 40 nm sized beads were the most suitable size for detection time and reproducibility. We could confirm that the particle size is important as a physical factor. Homogeneous nano‐sized beads have an advantage for efficient SN detection compared to existing colloids agents of heterogeneous size. Although the appropriate size for SN detection for human beings is predicted to be 500 nm and the optimum size may be different between animal species, the appropriate size should be determined for humans with accurately measured nano‐sized beads of strictly the same dimensions. We can select the size to match the purpose for detection time or trapping duration if we can determine the relationship between particle size and detection time or trapping duration.
Hemoglobin in blood and water is known to be a strongly absorptive substance in living tissue. Hemoglobin absorbs light in the range of visible light below 650 nm, and water absorbs light above 1100 nm. But in the near infrared range between 650 and 1100 nm, the absorption of light in living tissue is minimum. This range is called the ‘optical window’. Besides collagen, NADH and FAD are substances that in vivo have fluorescent wavelengths in the range of 400–500 nm. So, from this point of view, the NIR range has the advantage of fluorescence measurement. In these experiments four different fluorescent wavelengths 515, 680, 720 and 755 nm were studied. DR and IR were more sensitive than YG in the detection rate experiments with 40 nm beads (Table 2). Additionally, autofluorescence of the skin was strong and prevented measurement at the wavelength of YG.
There was no significant difference in ‘positive rate’, but in ‘average time’ between DR and IR (Table 2). However, spectral analysis of DR and IR showed that IR has a higher signal‐to‐noise ratio compared to DR (Fig. 1c,d).
There are two forms of transportation mechanism regarding a particle material to lymphatic system that is injected into tissue space. One is physical and an active extracellular transportation; a particle passes through lymph capillaries. The other is intracellular transportation of a particle. Foreign materials shift to the lymph capillaries after phagocytosis of a particle. It is has been reported that extracellular transportation was overwhelmingly dominant within 24 h after colloid injection into the subcutis, whereas intracellular transportation was observed after one week.( 6 )
An investigation of in vivo dynamics of tracers is important in SN biopsy. It has been reported that lymph nodes were detected by protected graft copolymer (PGC) combined with Cy5.5, or methoxypolyethyleneglycol (MPEG) poly‐L‐lysine combined with Cy5.5 as a tracer.( 7 , 8 , 9 ) The report shows that most of the subcutaneously injected tracer remained at an injected site without transportation, and some of them transferred to lymph nodes and remained. After intravenous injection, the tracer distributed in the reticuloendothelial system including the liver or spleen, rather than in lymph nodes.
We were not able to investigate the in vivo distribution of the injected tracer because of technical limitations, but we consider that the nanoparticle may distribute to the reticuloendothelial system as described in previous reports,( 7 , 8 , 9 ) or may be excreted from the kidney for their hydrophilia.
We histologically observed the liver and kidney 2 weeks after subcutaneous injection of fluorescent beads. Consequently, we didn't find beads trapped in the liver or kidney, suggesting that the safety of these beads would be ensured when they are given in vivo.
Additionally, the fluorescent beads that we used for these experiments mainly consist of polystyrene. As the surgical string often used in operations is also made from polystyrene, the fluorescent beads are considered to be safe. Accumulation and long‐term toxicity are under investigation.
Sample depth is a very serious problem in fluorescence measurement of living tissue. The local excitation illumination within tissue exponentially attenuates as a result of absorption and scattering from the surface to that depth. This problem of lack of transmission prevents us from detection in tissues deeper than 1 cm from the surface of the body at present.( 10 ) We can detect the SN of small animals like rats, but may have difficulty with detection in larger animals because of the depth at which SN exist (i.e. more than 1 cm away from the skin surface). For example, lymph nodes in humans are buried in fat and are located deeper than 1 cm. A detection technique for finding SN up to 2 cm deep is recommended. Therefore, we are investigating the application of a semiconductor nano crystal that has extremely stronger fluorescent intensity than usual fluorescent beads to increase the detection ability, with an improvement of technique including time/frequency domain spectrometry.
We confirmed, in animal experiments, that fluorescent beads have the potential to be an alternative to existing tracers in the detection of the SN if we select the appropriate particle size and wavelength.
We experimented to identify SN by traditional dye method using patent blue for comparison of fluorescent beads. We tested 20 hind legs of 10 rats. Patent blue was subcutaneously injected at the foot pad of the hind leg as well as fluorescent beads and the visibility of inguinal nodes was checked. We identified inguinal nodes in eight of 20 legs by dye, whereas, we identified 24 of 31 legs by fluorescent beads at DR 40 nm. Detection rate was significantly higher using fluorescent beads as a tracer (data not shown). We are now preparing an experiment to clarify the superiority of the fluorescent method to the conventional dye method for clinical application.
Acknowledgment
This study was supported in part by the Grant‐in‐Aid for Research Project, Promotion of Advanced Medical Technology (H14‐Nano‐010), from the Ministry of Health, Labor and Welfare of Japan.
References
- 1. Morton DL, Wen DR, Wong JH et al. Technical details of intraoperative lymphatic mapping for early stage melanoma. Arch Surg 1992; 127: 392–9. [DOI] [PubMed] [Google Scholar]
- 2. Giuliano AE, Kirgan DM, Guenther JM, Morton DL. Lymphatic mapping and sentinel lymphadenectomy for breast cancer. Ann Surg 1994; 220: 391–401. [DOI] [PMC free article] [PubMed] [Google Scholar]
- 3. Krag DN, Weaver DL, Alex JC, Fairbank JT. Surgical resection and radiolocalization of the sentinel lymph node in breast cancer using a gamma probe. Surg Oncol 1993; 2: 335–40. [DOI] [PubMed] [Google Scholar]
- 4. Tafra L, Lannin DR, Swanson MS et al. Multicenter trial of sentinel node biopsy for breast cancer using both technetium sulfur colloid and isosulfan blue dye. Ann Surg 2001; 233: 51–9. [DOI] [PMC free article] [PubMed] [Google Scholar]
- 5. Moghimi SM, Bonnemain B. Subcutaneous and intravenous delivery of diagnostic agents to the lymphatic system: applications in lymphoscintigraphy and indirect lymphography. Advanced Drug Delivery Rev 1999; 37: 295–312. [DOI] [PubMed] [Google Scholar]
- 6. Ikomi F, Hanna GK, Schmid‐Schonbein GW. Mechanism of colloidal particle uptake into the lymphatic system: basic study with percutaneous lymphography. Radiology 1995; 196: 107–13. [DOI] [PubMed] [Google Scholar]
- 7. Josephson L, Mahmood U, Wunderbaldinger P, Tang Y, Weissleder R. Pan and sentinel lymph node visualization using a near‐infrared fluorescent. Probe Mol Imaging 2003; 2: 18–23. [DOI] [PubMed] [Google Scholar]
- 8. Wunderbaldinger P, Turetschek K, Bremer C. Near‐Infrared fluorescence imaging of lymph nodes using a new enzyme sensing activatable macromolecular optical probe. Eur Radiol 2003; 13: 2206–11. [DOI] [PubMed] [Google Scholar]
- 9. Hawley AE, Illum L, Davis SS. Lymph node localization of biodegradable nanospheres surface modified with poloxamer and poloxamine block co‐polymers. FEBS Lett 1997; 400: 319–23. [DOI] [PubMed] [Google Scholar]
- 10. Yang M, Baranov E, Jiang P et al. Whole‐body optical imaging of green fluorescent protein‐expressing tumors and metastasis. Proc Natl Acad Sci USA 1997; 97: 1206–11. [DOI] [PMC free article] [PubMed] [Google Scholar]