

Abstract
Although lung adenocarcinoma is a major cause of cancer death worldwide, details of its molecular carcinogenesis and stepwise progression are still unclear. To characterize the sequential progression from bronchioloalveolar adenocarcinoma of the lung (BAC, in situ carcinoma) to adenocarcinoma mixed subtype with BAC component, polymerase chain reaction‐based cDNA suppression subtractive hybridization (SSH) was carried out using two representative cases of BAC (non‐invasive tumors) and adenocarcinoma mixed subtype with BAC (invasive tumors). Through differential screening, virtual reverse northern hybridization and quantitative real‐time reverse‐transcription–polymerase chain reaction (qRT‐PCR) we selected five genes (TncRNA, OCIAD2, ANXA2, TMED4 and LGALS4) that were expressed at significantly higher levels in invasive adenocarcinoma mixed subtype with BAC than in BAC. After in situ hybridization and qRT‐PCR analyses, we confirmed that only the OCIAD2 gene showed significantly higher expression in the tumor cells of invasive adenocarcinoma mixed subtype with BAC than in BAC (P = 0.026). We then carried out in situ hybridization of OCIAD2 in 56 adenocarcinoma mixed subtype with BAC component and assessed the correlation between OCIAD2 expression and clinicopathological features. In contrast to our expectation, the patients with OCIAD2 expression showed a better clinical outcome than those without OCIAD2 expression, and OCIAD2 expression showed an inverse correlation with lymphatic invasion, blood vessel invasion and lymph node metastasis. These results suggest that OCIAD2 begins to express at the progression from in situ to invasive carcinoma, and is associated with the favorable prognosis of adenocarcinoma mixed subtype with BAC component. (Cancer Sci 2007; 98: 50–57)
Lung cancer is the most common fatal malignancy worldwide, including North America, Europe and Japan.( 1 ) Its histology can be divided into four major subtypes: squamous cell carcinoma, adenocarcinoma, large cell carcinoma and small cell carcinoma. Among the major subtypes of non‐small cell carcinomas (NSCLC), squamous cell carcinoma is directly attributable to cigarette smoking and its sequence of histological changes from dysplasia and in situ carcinoma to invasive carcinoma has been well established and accepted.( 2 ) However, because of its histological and cytological heterogeneity, the sequential progression of adenocarcinoma has been very difficult to characterize on the basis of morphology.
In 1999, the World Health Organization revised the histological classification of lung tumors, and bronchioloalveolar carcinoma (BAC) was added as one of the major histological subtypes of adenocarcinoma. Atypical adenomatous hyperplasia (AAH) was also newly added as a preinvasive lesion of adenocarcinoma. BAC is defined as adenocarcinoma that shows no invasive growth. Therefore, both AAH and BAC are thought to represent the very early stage of adenocarcinoma without invasion. Histologically, both entities show pure lepidic growth of existing alveolar structures and are sometimes difficult to distinguish from each other.
In 1995, Noguchi et al. divided small lung adenocarcinomas (i.e. 2 cm in diameter or less) into two major groups, each of which was further subdivided into three types.( 3 ) One of these two major groups is the replacing growth type, which shows lepidic growth of pulmonary alveolar structures. The other is the non‐replacing growth type, which shows non‐lepidic growth and destruction of the original alveolar framework. The three subtypes in the former group include localized bronchioloalveolar carcinoma (LBAC) without active fibroblastic proliferation (types A and B) and LBAC with active fibroblastic proliferation (type C). Types A and B correspond to BAC and have an extremely favorable prognosis. These subgroups show no lymph node metastasis and have a 5‐year survival rate of 100%, although some type C tumors that are mostly diagnosed as the adenocarcinoma mixed subtype with BAC component can show lymph node metastasis and have a less favorable prognosis than type A and B tumors (5‐year survival rate 74.8%). Minami et al. examined small adenocarcinomas morphometrically and reported that the ratio of the area of fibroblastic proliferation to that of fibrosis is critical for prognosis: if the ratio is less than 10%, then adenocarcinoma mixed subtype with BAC component shows a very favorable prognosis.( 4 ) Suzuki et al.,( 5 ) Yokose et al.( 6 ) and Sakurai et al.( 7 ) have also indicated the importance of fibrosis and destruction of the alveolar framework for the prognosis of adenocarcinoma. Furthermore, Aoyagi et al. have investigated loss of heterozygosity (LOH) on eight chromosomes in small‐sized lung adenocarcinoma showing replacement growth,( 8 ) and demonstrated that the multistep carcinogenesis of lung adenocarcinoma progresses in accordance with the accumulation of multiple allelic losses. Their study also provided supportive data for the progression of adenocarcinoma from types A and B to type C. These clinicopathological studies suggest that type C tumors include tumors with favorable and poor prognosis.
Clinical trials of computed tomography (CT) screening to detect small and early stage lung adenocarcinomas have been carried out in Japan and other countries. One‐fourth of the cases detected showed pure ground glass opacity (GGO) and half of them showed partial GGO. Small adenocarcinomas that show pure GGO correspond to type A tumors (BAC) and have an extremely favorable prognosis. In contrast, cases showing partial GGO have a relatively poor prognosis, and correspond to adenocarcinoma mixed subtype with BAC component. These findings suggest that adenocarcinoma mixed subtype with BAC component includes early but invasive tumors showing a poor prognosis. Therefore, it is very important to clarify the molecular mechanism of stepwise progression from type A tumors to type C tumors and to find molecular markers that can be used to distinguish type C tumors or adenocarcinoma mixed subtype with BAC component that show favorable prognosis from those showing poor prognosis.
Several tumor markers and aberrantly expressed genes, such as p53, Ki67, K‐ras, Survivin, Her‐2/Neu and FHIT, have been reported to accumulate along the progression from BAC to invasive cancer.( 9 , 10 , 11 , 12 ) Many molecular profiling studies by cDNA microarray have been carried out to identify the molecular targets in cancer cell for diagnosis and treatment.( 13 , 14 , 15 ) However, definitive marker genes for the progression of adenocarcinoma mixed subtype with BAC component have not been identified.
In the present study, using representative type A (BAC) and type C (small‐sized adenocarcinoma mixed subtype with BAC component) tumors, we carried out polymerase chain reaction (PCR)‐based suppression subtractive hybridization (SSH) to identify genes related to the sequential progression from in situ carcinoma to invasive carcinoma.
Materials and Methods
Patients and tissue specimens. For subtraction analysis and expression analysis, frozen materials of 11 BAC (type A and B) and nine small‐sized adenocarcinoma mixed subtype with BAC component (type C) were obtained from patients who had undergone surgical resection at the Department of Thoracic Surgery, Tsukuba University Hospital (Ibaraki, Japan), and the National Cancer Center Hospital (Tokyo, Japan). A small amount of each specimen was embedded directly in Tissue‐Tek OCT Compound (Sakura Finetek Japan, Tokyo, Japan) and frozen immediately in acetone and dry ice. The specimens were then stored at −80°C until analysis. Among the 20 specimens, we used one pair of frozen materials that showed representative type A (BAC) and C (small‐sized adenocarcinoma mixed subtype with BAC component) histology (Fig. 1). For clinicopathological analysis by in situ hybridization, 56 adenocarcinoma mixed subtype with BAC component were also obtained from patients who had undergone surgical resection. All specimens were fixed with 10% formalin and embedded in paraffin. All of the cases were diagnosed histologically according to the World Health Organization classification,( 16 ) and Noguchi's classification for the small‐sized adenocarcinoma. They were also evaluated by the International Union Against Cancer (UICC) staging system.( 17 )
Figure 1.
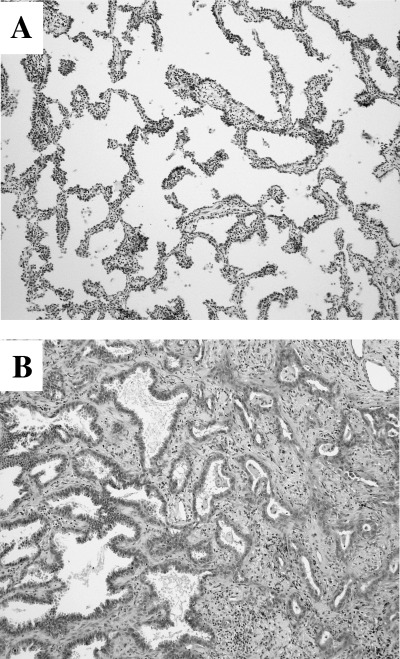
Histology of the specimens used for the TALPAT method. (A) type A tumor (bronchioloalveolar carcinoma; BAC), (B) type C tumor (small‐sized adenocarcinoma mixed subtype with BAC component).
Preparation of nuclear extracts. For subtraction analysis, we used two frozen cryostat sections (8 µm) of type A and C (Fig. 1). The tumor cells in each section were collected selectively using a laser capture microdissection system, LM‐200 (Arcturus Engineering, Mountain View, CA, USA). Total RNA was isolated using TRIzol (Invitrogen, Carlsbad, CA, USA). Using 10 µL of sample buffer, T7 RNA polymerase promoter‐attached, adaptor ligation‐mediated, and PCR amplification followed by the in vitro T7‐transcription (TALPAT) method were performed to obtain enough mRNA to serve as template for suppression subtractive hybridization (SSH).( 18 )
Suppression subtractive hybridization and cloning. Suppression subtractive hybridization was performed on TALPAT samples between type A and C tumors using a PCR‐Select cDNA subtraction kit (BD Bioscience Clontech, Palo Alto, CA, USA) with some modifications. After the first‐strand and second‐strand cDNA had been synthesized in turn, SSH was carried out according to the manufacturer's instructions. To clone genes that were relatively overexpressed in type C tumors, the forward subtracted fragments were then inserted into the T/A cloning vector pCR 2.1 (Invitrogen). Individual transformants carrying subtracted cDNA fragments were isolated from white colonies on 5‐bromo‐4‐chloro‐3‐indolyl‐β‐D‐galactopyranoside/isopropyl‐1‐thio‐β‐D‐galactopyranoside agar plates.
Differential screening. A total of 1056 individual recombinant clones were picked randomly. cDNA inserts of the plasmids were amplified by PCR with secondary PCR primers. The PCR products were transferred to a nylon membrane, and four identical membranes were made. cDNA from the forward or reverse subtractions were radiolabeled with [32P]dCTP by random priming. Dot blot hybridization was carried out according to the manufacturer's protocol (PCR‐Select Differential Screening kit; BD Biosciences Clontech). Visualization was achieved by exposure to Kodak BioMax XAR films (Eastman Kodak, Rochester, NY, USA).
Virtual reverse northern blotting. Dot samples were generated by PCR using secondary primers from the colonies corresponding to the dots shown to be differentially expressed by dot blot differential screening. Then, two identical membranes were prepared with their PCR products and were hybridized with 32P‐labeled TALPAT cDNA probes (derived from type C and type A tumors). The hybridized membranes were exposed to Kodak BioMax XAR films (Eastman Kodak) and evaluated relatively against the intensity of glyceraldehyde‐3‐phosphate dehydrogenase (G3PDH) with an imaging densitometer (Model GS‐700 Imaging Densitometer; Bio‐Rad Laboratories, Hercules, CA, USA).
Sequencing and homology search. The clones relatively overexpressed in type C tumors compared with type A tumors were sequenced using a BigDye terminator v3.1 cycle sequencing ready reaction kit and an ABI PRISM 310 genetic analyzer (both from Applied Biosystems Japan, Tokyo, Japan). Nucleic acid and protein sequence similarity searches were carried out at the National Center for Biotechnology using the basic local alignment search tool (BLAST).
Real‐time quantitative reverse transcription–PCR analysis using SYBR Green I. Expression of those genes relatively overexpressed in type C tumors was evaluated by real‐time reverse transcription–PCR based on the SYBR Green I method. In brief, PCR was carried out with SYBR Premix EX Taq (Perfect Real Time, Takara Bio, Otsu, Shiga, Japan) in an ABI PRISM 5700 sequence detector (Applied Biosystems) in a final volume of 25 µL according to the manufacturer's protocol. At the verification study of the quantification by virtual reverse northern, we used TALPAT‐amplified cDNA (type C and A tumors) for the PCR templates. And at the quantification study of selected genes by in situ hybridization, we used cDNA reverse‐transcribed from whole section samples (normal lung, type C and A tumors). The PCR primers were purchased from Takara Bio, except for trophoblast‐derived non‐coding RNA (TncRNA) and G3PDH used as an internal control. The primer sequences of TncRNA and G3PDH were: Tnc RNA, 5′‐TTTGGGAGACTGAGGTGGGTG‐3′ (forward), 5′‐AGACAAGTTTTCGCTATGCTGGC‐3′ (reverse); and G3PDH, 5′‐AATTCCATGGCACCGTCAA‐3′ (forward), 5′‐CCAGCATCGCCCCACTT‐3′ (reverse).
In situ hybridization. The overexpressed cDNA, which had been subcloned into pCR2.1, were amplified by PCR with T7 RNA polymerase promoter‐attached primers. The T7 RNA polymerase promoter‐attached PCR products were labeled with digoxigenin using a DIG‐RNA labeling kit (Roche Diagnostics, Penzberg, Germany). The linearized pCR2.1 was used as template, and a sense probe was made as the negative control. Detection of hybridized cRNA probes was carried out using horseradish‐conjugated rabbit anti‐DIG antibody (DakoCytomation, Carpinteria, CA, USA) and a GenPoint Tyramide Signal Amplification System (DakoCytomation). Specimens were considered positive when >5% of tumor cells showed clear positive staining.
Statistical analysis. Associations between OCIA domain containing 2 (OCIAD2) gene expression and clinicopathological parameters were evaluated with the Pearson χ2 and Fisher's exact tests. Survival curves were calculated using the Kaplan–Meier method and then compared using a log‐rank test. Statistical analyses were carried out using SPSS Base, version 11.0 J for Windows (SPSS Inc., Chicago, IL, USA) at a significance level of P < 0.05.
Results
Subtractive hybridization and differential screening. To identify genes that were highly expressed in type C tumors (small‐sized adenocarcinoma mixed subtype with BAC component) in comparison with type A tumors (BAC), we carried out PCR‐based subtractive hybridization using cDNA templated by TALPAT‐amplified RNA from each representative type C tumor and type A tumor. The amplified subtracted cDNA fragments (type C minus type A) were then subcloned. After transformation, 1056 white colonies were selected randomly and cultured. The differential hybridization screening revealed 71 clones that showed stronger signals with cDNA probes templated by RNA from type C tumors than with cDNA probes from type A tumors. Subsequent semiquantitative screening (virtual reverse northern) with the TALPAT products from two tissue pairs confirmed that all 71 clones were highly expressed in type C cDNA compared to type A. Among the 71 highly expressed genes in type C cDNA, we selected eight clones that were expressed at a high level in type C tumors (relative expression > 0.2 compared to G3PDH) and showed a high expression ratio (type C/type A, >5). We performed sequencing and a BLAST search of these clones, and the results are shown in Table 1. For subsequent analysis, we selected five genes (TncRNA, OCIAD2, ANXA2, TMED4 and LGALS4) as the other cloned genes included some that are well known to be cancer‐related (CEACAM5, S100A6 and TACSTD1)( 19 , 20 , 21 , 22 , 23 , 24 ) or to play a role in the fundamental metabolism of living cells (ACSL1).( 25 , 26 , 27 )
Table 1.
Genes identified as differentially and highly expressed in type C tumor (small‐sized adenocarcinoma mixed subtype with bronchioloalveolar carcinoma [BAC] component) than type A tumor (BAC) through subtraction, differential screening and virtual reverse northern screening
| Gene name | Official symbol | Relative expression vs G3PDH | C/A Ratio | |
|---|---|---|---|---|
| Type C | Type A | |||
| Trophoblast‐derived non‐coding RNA | TncRNA | 100.42 | 3.31 | 30.37 |
| OCIA domain containing 2 | OCIAD2 | 73.38 | 2.70 | 27.17 |
| S100 calcium binding protein A6 | S100A6 | 36.54 | 1.84 | 19.83 |
| Annexin A2 | ANXA2 | 64.34 | 9.24 | 6.96 |
| Carcinoembryonic antigen‐related cell adhesion molecule 5 | CEACAM5 | 64.22 | 2.40 | 26.78 |
| Transmembrane emp24 protein transport domain containing 4 | TMED4 | 45.64 | 7.57 | 6.03 |
| Acyl‐CoA synthetase long chain family member 1 | ACSL1 | 42.24 | 0.64 | 65.90 |
| Tumor‐associated calcium signal transducer 1 | TACSTD1 | 23.27 | 2.18 | 10.68 |
| Lectin, galactoside‐binding, soluble, 4 | LGALS4 | 22.54 | 0.22 | 102.77 |
G3PDH, glyceraldehyde‐3‐phosphate dehydrogenase.
Quantitative expression analysis of identified genes in TALPAT products. To assess differences in the expression levels of the genes selected by SSH and virtual reverse northern, quantitative real‐time PCR (qRT‐PCR) assays were carried out. As shown in Fig. 2, qRT‐PCR confirmed that all of the selected genes were expressed at a significantly higher level in type C tumors than in type A tumors.
Figure 2.

Quantitative real‐time reverse transcription–polymerase chain reaction analysis of highly expressed genes in type C tumors (small‐sized adenocarcinoma mixed subtype with bronchioloalveolar carcinoma [BAC] component) in comparison with type A tumors (BAC). All of the genes selected by both suppression subtractive hybridization and virtual reverse northern screening were expressed more highly in type C tumor‐derived RNA than in type A‐derived RNA. Both RNA samples were identical to those used in TALPAT. All measurements are shown relative to the expression level of the glyceraldehyde‐3‐phosphate dehydrogenase (G3PDH) gene. Bars show the mean + SD.
Expression status of the cloned genes in lung adenocarcinoma tissue. To analyze the expression and distribution of the five selected genes in small‐sized adenocarcinoma mixed subtype with BAC component, we carried out in situ hybridization using 10 surgical specimens, including five type A tumors and five type C tumors. OCIAD2, ANXA2 and LGALS4 demonstrated positive expression exclusively in cancerous cells other than in normal epithelial cells in both histological types. Among the three genes, ANXA2 was positive in both type A and type C tumors. We were unable to reliably assess the expression status of TncRNA and TMED4 genes because the TncRNA gene probe did not react with both histological types and the TMED4 gene probe reacted with the negative control (data not shown). However, LGALS4 and OCIAD2 were expressed only in type C tumors (small‐sized adenocarcinoma mixed subtype with BAC component), and therefore their expression was further examined using large‐scale specimens.
Quantitative expression analysis of OCIAD2 and LGALS4 in whole‐section RNA samples (type A–C tumors). To compare the expression levels of the OCIAD2 and LGALS4 genes in type A and B tumors and type C tumors, we first carried out qRT‐PCR on total RNA extracted from 10 tumors (five type A and B, five type C) as a preliminary investigation. This showed that there were no significant differences in LGALS4 gene expression between type A and B tumors and type C tumors (data not shown). However, the OCIAD2 gene tended to show stronger expression in type C tumors than in either type A or B tumors. In order to examine the expression of OCIAD2 in type A–C tumors in greater detail and get its expression status in normal cells, we added another nine adenocarcinoma (five type A and B, four type C) and five normal lung mRNA samples and carried out the same analysis on 24 samples in all. As shown in Fig. 3, the OCIAD2 gene was expressed significantly more strongly in type C than in both type A and B (P = 0.026) and there were no significant differences in the expression levels of OCIAD2 among normal tissues, type A and type B tumors.
Figure 3.
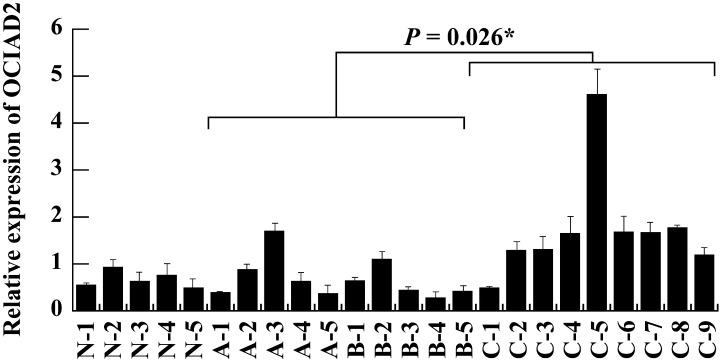
Quantitative real‐time real‐time reverse transcription–polymerase chain reaction analysis of OCIAD2 expression in small‐sized adenocarcinomas and normal lung. OCIAD2 showed significantly higher expression in type C tumors (small‐sized adenocarcinoma mixed subtype with bronchioloalveolar carcinoma [BAC] component) than in both type A and B tumors (BAC) (P = 0.026). Lane N1‐5, normal lung; A1‐3, type A; B1‐5, type B; C1‐9, type C tumor‐derived RNA samples extracted from whole section samples. All measurements are shown relative to the expression level of the glyceraldehyde‐3‐phosphate dehydrogenase (G3PDH) gene. Bars show the meanmean + SD. *The difference was statistically significant (P < 0.05).
Correlation between OCIAD2 expression and clinicopathological factors in lung adenocarcinoma patients. To assess the correlation between OCIAD2 expression and clinicopathological factors, we examined OCIAD2 expression in 56 patients (adenocarcinoma mixed subtype with BAC component including type C tumors) by in situ hybridization (Fig. 4). Thirty‐four tumors (61%) showed positive reaction against the antisense probe of OCIAD2. In normal tissue, some bronchial epithelium also showed positive reaction but alveolar epithelium, vascular endothelium and infiltrating inflammatory cells were negative. As shown in Table 2, loss of OCIAD2 expression was significantly correlated with lymphatic invasion, blood vessel invasion and lymph node metastasis (P = 0.011, 0.002 and 0.012, respectively). The correlation between OCIAD2 expression and clinical outcome of lung adenocarcinoma was also examined. As shown in Fig. 5A, in terms of overall survival, patients who were positive for OCIAD2 expression had a significantly better outcome than patients who were negative for OCIAD2. In particular, for cases with BAC component in which the tumor diameter was less than 2 cm, none of the patients who died showed positive OCIAD2 expression (Fig. 5B). In terms of event‐free survival, OCIAD2‐positive patients showed a significantly better outcome than OCIAD2‐negative patients (Fig. 5C). However, there was no correlation between OCIAD2 expression and other clinicopathological factors (Table 2).
Figure 4.
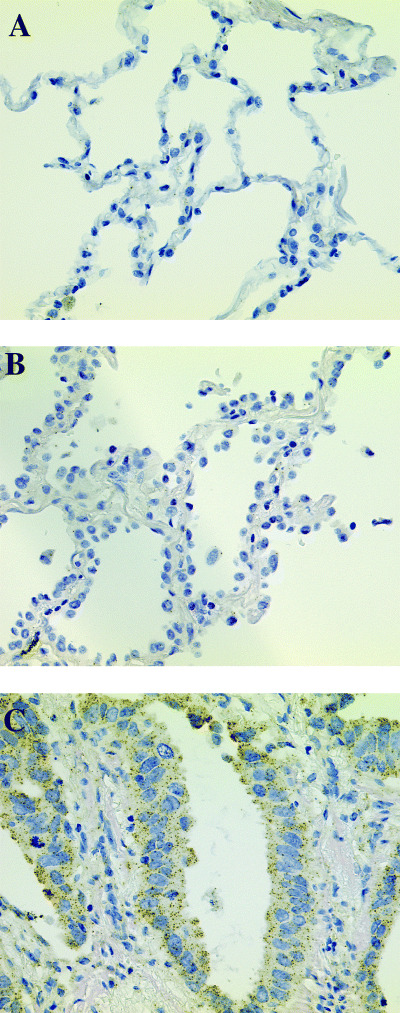
In situ hybridization analysis of the OCIAD2 gene in lung adenocarcinoma. OCIAD2 was positive in adenocarcinoma mixed subtype with bronchioloalveolar carcinoma (BAC) component (C) but negative in BAC (B) and normal lung (A).
Table 2.
OCIAD2 gene expression and clinicopathological features in patients with pulmonary adenocarcinoma
| Clinicopathological features | All patients | OCIAD2 expression in in situ hybridization | P‐value | |
|---|---|---|---|---|
| No. positive (%) | No. negative (%) | |||
| All patients | 56 | 34 | 22 | |
| Mean age (years) | 65.7 | 67.53 | 62.91 | |
| Sex | ||||
| Male | 31 | 17 (54.8) | 14 | |
| Female | 25 | 17 (68) | 8 | 0.316 |
| Pathological stage | ||||
| Stage I | 34 | 25 (73.5) | 9 | |
| Stage II | 3 | 1 (33.3) | 2 | |
| Stage III | 17 | 7 (41.2) | 10 | |
| Stage IV | 2 | 1 (50.0) | 1 | 0.107 |
| Ly factor | ||||
| Negative | 32 | 24 (75.0) | 8 | |
| Positive | 24 | 10 (41.7) | 14 | 0.011* |
| V factor | ||||
| Negative | 39 | 29 (74.4) | 10 | |
| Positive | 17 | 5 (29.4) | 12 | 0.002* |
| Lymph node status | ||||
| N0 | 40 | 29 (72.5) | 11 | |
| N1 and N2 | 16 | 5 (31.3) | 11 | 0.012* |
Stage I includes IA and IB, stage II includes IIA and IIB, stage III includes IIIA and IIIB. Ly factor, lymphatic vessel invasion; N factor, lymph node involvement; V factor, vascular vessel invasion. *The difference was statistically significant (P < 0.05).
Figure 5.
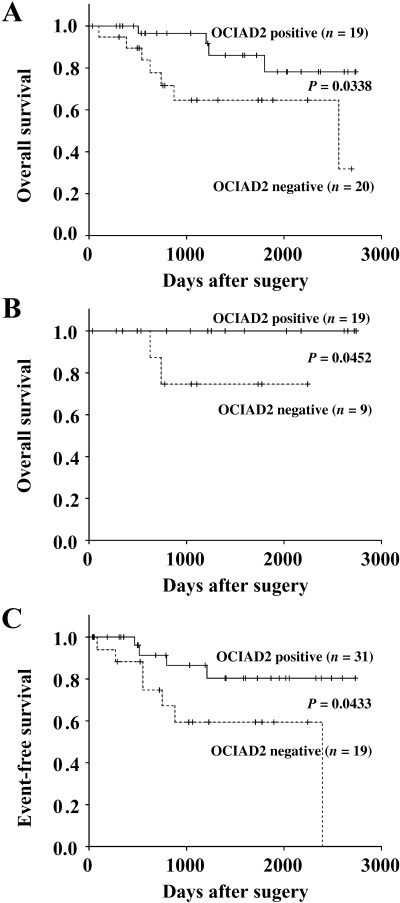
Survival curves and event‐free survival of patients with pulmonary adenocarcinomas. Patients who were positive for OCIAD2 expression showed a favorable outcome (A, all cases; B, tumor diameter less than 2 cm) and (C) event‐free survival compared with patients who were negative for OCIAD2 expression.
Discussion
In the present study, we identified genes that were more highly expressed in type C tumors (small‐sized adenocarcinoma mixed subtype with BAC component) than in type A tumors (BAC). Among those genes, we were able to confirm only one (OCIAD2) that was highly expressed in a large proportion of type C tumors. The number of genes identified was very limited, due possibly to individual differences in tumors used for SSH and the heterogeneity of lung adenocarcinoma. However, although during the screening process we removed genes that showed only minimal expression or a very low type C/type A expression ratio, those genes may play important roles in the multistep carcinogenesis of lung adenocarcinoma.
OCIAD2 was originally identified by Strausberg et al. in 2002 by its sequential similarity with ovarian carcinoma immunoreactive antigen 1 through the National Institutes of Health Mammalian Gene Collection project.( 28 ) OCIAD2 and OCIAD1 form the OCIA domain family. OCIAD1 is a gene that was identified by Luo et al. in 2001 by immunoscreening of an ovarian carcinoma cDNA expression library with ascites from ovarian cancer patients.( 29 ) The function of OCIAD2 has not been elucidated, but the protein may be immunosensitive as an antigen and, like OCIAD1, could be a cancer‐specific protein. The expression pattern of OCIAD2 in adenocarcinoma mixed subtype with BAC component is of considerable interest. It is not expressed in type A and B tumors (BAC) but is expressed in a proportion of type C tumors (small‐sized adenocarcinoma mixed subtype with BAC component) (2, 3, 4). Therefore, adenocarcinoma mixed subtype with BAC component includes tumors both with and without OCIAD2 expression.
At first, we expected that the expression of OCIAD2 might be related to poor prognosis, as a certain percentage of adenocarcinoma mixed subtype with BAC component, including type C tumors, expressed OCIAD2 but pure BAC (type A and B tumors) did not. However, the result was contrary to our expectation, and OCAID2 was shown to be a marker for a separate group of adenocarcinoma mixed subtype with BAC component that showed a favorable prognosis. This unexpected result may be explained as follows. Because only a pair of type A (BAC) and type C (small‐sized adenocarcinoma mixed subtype with BAC component) tumors was used for SSH analysis, there was a possibility that we might have chosen by chance a type C tumor expressing OCIAD2. The dynamics of OCIAD2 expression in the course of sequential progression of peripheral‐type lung adenocarcinoma is still unknown, but two possibilities can be suggested (Fig. 6). One is that OCIAD2 becomes expressed when the tumor progresses from BAC to adenocarcinoma mixed subtype with BAC component, but the expression decreases in accordance with malignant progression. The other possibility is that during malignant progression from BAC to adenocarcinoma mixed subtype with BAC component, a proportion of BAC begin to express OCIAD2 and form a group that shows favorable prognosis. In contrast, other tumors that remain negative for OCIAD2 continue to show malignant progression and have a poor prognosis.
Figure 6.

Scheme of morphological progression of lung adenocarcinoma with bronchioloalveolar adenocarcinoma (BAC) component. •, OCIAD2‐negative cells; ○, OCIAD2‐positive cells.  Malignant progression from BAC to adenocarcinoma mixed subtype with BAC component, a proportion of BAC begin to express OCIAD2.
  OCIAD2 becomes expressed when the tumor progressed from BAC to adenocarcinoma mixed subtype with BAC component, but the expression decreases in accordance with malignant progression.
Luo et al. have reported that patients who have tumors expressing OCIAD1 may develop an antibody against it.( 29 ) This means that OCIAD1 may be a cancer‐specific protein and could be applicable as a marker for detecting carcinoma. Recently, it has become possible to detect many small adenocarcinomas by CT screening. Among the carcinomas detected by CT, adenocarcinoma mixed subtype with BAC component will account for the major proportion. As adenocarcinoma mixed subtype with BAC component is a mixed population that includes tumors with an extremely favorable prognosis or a poor prognosis, there is a need for reliable markers to discriminate less‐aggressive tumors or tumors that can be treated by reduction or limited surgery, such as wedge resection or segmentectomy. If OCIAD2 triggers an immune response like OCAD1, it may be a candidate marker for distinguishing adenocarcinoma mixed subtype with BAC component and favorable prognosis from tumors with a poor prognosis.
In summary, we have identified an interesting molecule, OCIAD2, that is expressed at a significantly higher level in adenocarcinoma mixed subtype with BAC component but not in BAC (in situ adenocarcinoma). OCIAD2 is significantly associated with a favorable prognosis and may have potential as a molecular marker for selecting tumors that are treatable by limited surgery. In order to clarify the molecular mechanism of stepwise progression of peripheral‐type adenocarcinoma, it will be necessary to elucidate the function of OCIAD2.
Acknowledgments
This work was supported in part by a Grant‐in‐Aid for Cancer Research (16‐1) from the Ministry of Health, Labor, and Welfare of Japan.
References
- 1. Parkin DM. Global cancer statistics in the year 2000. Lancet Oncol 2001; 2: 533–43. [DOI] [PubMed] [Google Scholar]
- 2. Park I‐W, Wistuba II, Maitra Et Al. A Multiple clonal abnormalities in the bronchial epithelium of patients with lung cancer. J Natl Cancer Inst 1999; 91: 1863–8. [DOI] [PubMed] [Google Scholar]
- 3. Noguchi M, Morikawa A, Kawasaki M et al. Small adenocarcinoma of the lung. Cancer 1995; 75: 2844–52. [DOI] [PubMed] [Google Scholar]
- 4. Minami Y, Matsuno Y, Iijima T et al. Prognostication of small‐sized primary pulmonary adenocarcinomas by histopathological and karyometric analysis. Lung Cancer 2005; 48: 339–48. [DOI] [PubMed] [Google Scholar]
- 5. Suzuki K, Yokose T, Yoshida J et al. Prognostic significance of the size of central fibrosis in peripheral adenocarcinoma of the lung. Ann Thorac Surg 2000; 69: 893–7. [DOI] [PubMed] [Google Scholar]
- 6. Yokose T, Suzuki K, Nagai K, Nishiwaki Y, Sasaki S, Ochiai A. Favorable and unfavorable morphological prognostic factors in peripheral adenocarcinoma of the lung 3 cm or less in diameter. Lung Cancer 2000; 29: 179–88. [DOI] [PubMed] [Google Scholar]
- 7. Sakurai H, Maeshima A, Watanabe S et al. Grade of stromal invasion in small adenocarcinoma: histopathological minimal invasion and prognosis. Am J Surg Pathol 2004; 28: 198–206. [DOI] [PubMed] [Google Scholar]
- 8. Aoyagi Y, Yokose T, Minami Y et al. Accumulation of losses of heterozygosity and multistep carcinogenesis in pulmonary adenocarcinoma. Cancer Res 2001; 61: 7950–4. [PubMed] [Google Scholar]
- 9. Nakanishi K, Kawai T, Kumaki F, Hiroi S, Mukai M, Ikeda E. Survivin expression in atypical adenomatous hyperplasia of the lung. Am J Clin Pathol 2003; 120: 712–19. [DOI] [PubMed] [Google Scholar]
- 10. Saad RS, Liu Y, Han H, Landreneau RJ, Silverman JF. Prognostic significance of HER2/neu, p53, and vascular endothelial growth factor expression in early stage conventional adenocarcinoma and bronchioloalveolar carcinoma of the lung. Mod Pathol 2004; 17: 1235–42. [DOI] [PubMed] [Google Scholar]
- 11. Ghazizadeh M, Jin E, Shimizu H et al. Role of cdk4, 16INK4, and Rb expression in the prognosis of bronchioloalveolar carcinomas. Respiration 2005; 72: 68–73. [DOI] [PubMed] [Google Scholar]
- 12. Kerr KM, MacKenzie SJ, Ramasami S et al. Expression of Fhit, cell adhesion molecules and matrix metalloproteinases in atypical adenomatous hyperplasia and pulmonary adenocarcinoma. J Pathol 2004; 203: 638–44. [DOI] [PubMed] [Google Scholar]
- 13. Beer DG, Kardia SL, Huang CC et al. Gene‐expression profiles predict survival of patients with lung adenocarcinoma. Nat Med 2002; 8: 816–24. [DOI] [PubMed] [Google Scholar]
- 14. Borczuk AC, Kim HK, Yegen HA, Friedman RA, Powell CA. Lung adenocarcinoma global profiling identifies type II transforming growth factor‐β receptor as a repressor of invasiveness. Am J Respir Crit Care Med 2005; 172: 729–37. [DOI] [PMC free article] [PubMed] [Google Scholar]
- 15. Berrar D, Sturgeon B, Bradbury I, Downes CS, Dubitzky W. Survival trees for analyzing clinical outcome in lung adenocarcinomas based on gene expression profiles: identification of neogenin and diacylglycerol kinase alpha expression as critical factors. J Comput Biol 2005; 12: 534–44. [DOI] [PubMed] [Google Scholar]
- 16. Travis WD, Colby TV, Corrin B, Shimosato Y, Brambilla E. Histological Typing of Lung and Pleural Tumours, 3rd edn. World Health Organization International Histological Classification of Tumours. Berlin: Springer, 1999. [Google Scholar]
- 17. Mountain CF. Revisions in the international system for staging lung cancer. Chest 1997; 111: 1710–17. [DOI] [PubMed] [Google Scholar]
- 18. Aoyagi K, Tatsuta T, Nishigaki M et al. A faithful method for PCR‐mediated global mRNA amplification and its integration into microarray analysis on laser‐captured cells. Biochem Biophys Res Commun 2003; 300: 915–20. [DOI] [PubMed] [Google Scholar]
- 19. Buccheri G. Circulating biomarkers for lung cancer. Ann Ital Chir 1999; 70: 831–8. [PubMed] [Google Scholar]
- 20. Kitamura H, Kameda Y, Nakamura N et al. Atypical adenomatous hyperplasia and bronchoalveolar lung carcinoma. Analysis by morphometry and the expressions of p53 and carcinoembryonic antigen. Am J Surg Pathol 1996; 20: 553–62. [DOI] [PubMed] [Google Scholar]
- 21. Breen EC, Tang K. Calcyclin (S100A6) regulates pulmonary fibroblast proliferation, morphology, and cytoskeletal organization in vitro . J Cell Biochem 2003; 88: 848–54. [DOI] [PubMed] [Google Scholar]
- 22. Maelandsmo GM, Florenes VA, Mellingsaeter T, Hovig E, Kerbel RS, Fodstad O. Differential expression patterns of S100A2, S100A4 and S100A6 during progression of human malignant melanoma. Int J Cancer 1997; 74: 464–9. [DOI] [PubMed] [Google Scholar]
- 23. Went PT, Lugli A, Meier S et al. Frequent EpCam protein expression in human carcinomas. Hum Pathol 2004; 35: 122–8. [DOI] [PubMed] [Google Scholar]
- 24. Went P, Vasei M, Bubendorf L et al. Frequent high‐level expression of the immunotherapeutic target Ep‐CAM in colon, stomach, prostate and lung cancers. Br J Cancer 2006; 94: 128–35. [DOI] [PMC free article] [PubMed] [Google Scholar]
- 25. Kornberg A, Pricer WE Jr. Enzymatic synthesis of the coenzyme A derivatives of long chain fatty acids. J Biol Chem 1953; 204: 329–43. [PubMed] [Google Scholar]
- 26. Kim JH, Lewin TM, Coleman RA. Expression and characterization of recombinant rat Acyl‐CoA synthetases 1, 4, and 5: Selective inhibition by triacsin C and thiazolidinediones. J Biol Chem 2001; 276: 24 667–73. [DOI] [PubMed] [Google Scholar]
- 27. Hesler CB, Olymbios C, Haldar D. Transverse‐plane topography of long‐chain acyl‐CoA synthetase in the mitochondrial outer membrane. J Biol Chem 1990; 265: 6600–5. [PubMed] [Google Scholar]
- 28. Strausberg RL, Feingold EA, Grouse LH et al. Mammalian Gene Collection Program Team. Generation and initial analysis of more than 15 000 full‐length human and mouse cDNA sequences. Proc Natl Acad Sci USA 2002; 99: 16 899–903. [DOI] [PMC free article] [PubMed] [Google Scholar]
- 29. Luo LY, Soosaipillai A, Diamandis EP. Molecular cloning of a novel human gene on chromosome 4p11 by immunoscreening of an ovarian carcinoma cDNA library. Biochem Biophys Res Commun 2001; 280: 401–6. [DOI] [PubMed] [Google Scholar]