

Abstract
Colorectal carcinoma (CRC) is often lethal when invasion and/or metastasis occur. 15‐Lipoxygenase‐1 (15‐LO‐1), a member of the inflammatory eicosanoid pathway, oxidatively metabolizes linoleic acid and its expression is repressed in CRC. In this study, we investigated the hypothesis that the lack of 15‐LO‐1 expression in CRC cells might contribute to tumorigenesis. Therefore we introduced 15‐LO‐1 into HCT‐116 and HT‐29 cells that do not have detectable levels of 15‐LO‐1. Our data indicate that expression of 15‐LO‐1 significantly decreased cell proliferation and increased apoptosis. In addition, we observed a reduction in adhesion to fibronectin, anchorage‐independent growth on soft agar, cellular motility and ability to heal a scratch wound, and migratory and invasive capacity across Matrigel. 15‐LO‐1 expression also reduced the expression of metastasis associated protein‐1, a part of the nucleosome remodeling and histone deacetylase silencing complex. We propose that 15‐LO‐1 expression in CRC might contribute to the inhibition of metastatic capacity in vitro and can be exploited for therapeutic purposes. (Cancer Sci 2009;100: 2283–2291)
Colorectal cancer is one of the leading causes of cancer‐related deaths throughout the world.( 1 ) There is growing evidence that supports a functional role for the inflammatory COX and LO enzymes in cancer development.( 2 , 3 , 4 ) LOs, which can oxygenate arachidonic acid and linoleic acid, can be classified as procarcinogenic or anticarcinogenic; thus, 5‐, 8‐, and 12‐LO are classified as procarcinogenic, whereas 15‐LO‐2 is anticarcinogenic.( 5 , 6 ) 15‐LO‐1, however, has a controversial role in cancer. This enzyme preferentially catalyzes the conversion of linoleic acid to 13(S)‐HODE.( 7 , 8 ) 15‐LO‐1 has been unambiguously shown to have a protumorigenic role in prostate cancer and preliminary reports in CRC also assigned a procarcinogenic role to 15‐LO‐1 through activation of the MAPK pathway.( 9 , 10 , 11 , 12 , 13 , 14 , 15 ) However, surprisingly, subsequent studies have indicated a tumor suppressive nature of the enzyme as its expression was shown to be lost in CRC by immunohistochemistry.( 16 , 17 ) Promoter analysis of ALOX15 indicated that expression of the gene is suppressed in tumors by several mechanisms acting in concert, such as promoter methylation,( 18 ) binding of the nucleosome remodeling and histone deacetylase repression complex,( 19 ) and through the overexpression of the transcription factor GATA‐6.( 20 ) Forced expression of the enzyme in various colon cancer cell lines has shown a downregulation of anti‐apoptotic proteins and activation of apoptotic pathways.( 21 , 22 , 23 , 24 , 25 ) The gene can also be transcriptionally reactivated by histone deacetylase inhibitors and non‐steroidal anti‐inflammatory drugs to induce apoptosis.( 26 , 27 ) Additionally, selective molecular targeting of 15‐LO‐1 expression was shown to be sufficient to inhibit tumorigenesis in mice.( 24 ) A similar tumor suppressive role of 15‐LO‐1 has also been observed in bladder and pancreatic cancers.( 11 , 28 )
Although much is now known about the epigenetic regulation and tumor suppressive properties of 15‐LO‐1, data on the role of this enzyme in cellular behavior, such as motility and invasiveness, is scarce. We have attempted to examine the effect of forced expression of 15‐LO‐1 in two CRC cell lines HCT‐116 and HT‐29. We have confirmed here that expression of 15‐LO‐1 inhibited cell proliferation which could be reversed by incubation with the 15‐LO‐1 specific inhibitor PD146176. These cells also underwent apoptosis by the downregulation of the anti‐apoptotic protein XIAP and activation of caspase‐3. Furthermore, we show here for the first time a decrease in cell motility, anchorage‐independent growth, migration, and invasion across Matrigel as a result of 15‐LO‐1 expression. We also report a decrease in the expression of the metastasis‐related MTA‐1 protein when 15‐LO‐1 is expressed. We therefore propose that 15‐LO‐1 indeed has tumor suppressive properties and should be exploited for therapeutic benefits.
Materials and Methods
Cell culture. HCT‐116 human colon cancer cell line was obtained from Deutsche Sammlung von Mikroorganismen und Zellkulturen (Braunschweig, Germany). HT‐29 was purchased from ŞAP Enstitüsü (Ankara, Turkey). The cells were grown in phenol red‐free RPMI‐1640 medium containing 10% FBS in a humidified atmosphere containing 5% CO2 at 37°C. Cell culture media were supplemented with 1% penicillin/streptomycin. All cell culture media and supplements were purchased from Biochrom (Berlin, Germany).
The 15‐LO‐1 cDNA cloned into a pcDNA3.1 vector with a Zeocin mammalian marker was obtained from Dr Uddhav Kelavkar (University of Pittsburgh, Pittsburgh, PA, USA). The 15‐LO‐1 vector (5 μg) was transfected into HCT‐116 cells using FuGENE 6 (Roche, Mannheim, Germany). Monoclones were picked approximately 20 days after selection with 250 μg/mL Zeocin (Invitrogen, Carlsbad, CA, USA) using cloning cylinders (Chemicon, Temecula, CA, USA) and maintained in 125 μg/mL Zeocin. The concentration of Zeocin used was based on a kill curve assay. Several clones were screened and two monoclones (1E7 and 1F8) were further expanded. For transient transfections, 5 μg of the plasmid was transfected into HT‐29 cells using FuGENE HD (Roche). The cells were collected 48 h later and processed for protein or RNA extraction. Control cells included the cells transfected with the empty pcDNA3.1 vector as well as parental untransfected cells.
RNA isolation and RT‐PCR. Total cellular RNA was extracted from stable and transiently transfected cells using the RNeasy Minikit (Qiagen, Hilden, Germany) according to the manufacturer’s guidelines. First‐strand cDNA synthesis was carried out from total RNA (1 μg) using oligodT primers and was PCR amplified using 15‐LO‐1 gene‐specific primers and conditions as described by Kelavkar et al. ( 9 ) The final PCR products were electrophoresed on a 2% agarose gel and photographed under UV light.
Western blot analysis. Cell lysates were isolated using M‐PER assay buffer (Pierce, Rockford, IL, USA) containing protease inhibitors (Roche). The protein content was measured using the modified Bradford assay using a Coomassie Plus protein assay reagent (Pierce). Whole‐cell extracts (50–70 μg) were separated in a 10% polyacrylamide gel and transferred onto a nitrocellulose membrane (Bio‐Rad, Hercules, CA, USA). The membranes were blocked in 5–10% skim milk and were incubated overnight with the appropriate primary antibodies: 15‐LO‐1 (1:1000 dilution; Cayman Chemical, Ann Arbor, MI, USA); XIAP (1:500 dilution); or MTA‐1 (1:150 dilution; Santa Cruz Biotechnology, Santa Cruz, CA, USA); followed by incubation for 1 h with a HRP‐conjugated goat anti‐rabbit (1:3300), rabbit anti‐sheep (1:2000) or goat anti‐mouse (1:2000) secondary antibody. The bands were visualized using an enhanced chemiluminescence kit (ECL Plus; Pierce) according to the manufacturer’s instructions. Where indicated, a preincubation step with 1 μm of the 15‐LO‐1 specific inhibitor PD146176 (Cayman Chemical) for 24 h was carried out before extracting the protein lysates.
15‐LO‐1 activity measurement. The metabolic product of 15‐LO‐1 oxygenation of linoleic acid, 13(S)‐HODE, was measured with an enzyme immunoassay kit (Assay Designs, Ann Arbor, MI, USA) according to the manufacturer’s instructions. Briefly, 15‐LO‐1 expressing and control cells were grown for 72 h (HCT‐116) or 48 h (post‐transfection for HT‐29) in six‐well plates, harvested, lysed, and acidified with 0.2 N HCl. 13(S)‐HODE was extracted with water‐saturated ethyl acetate. The lysate was then applied to a 96‐well plate and the level of 13(S)‐HODE was measured colorimetrically at 405 nm in a Bio‐Rad microplate reader. The 13(S)‐HODE concentrations were determined from a standard curve generated with standard 13(S)‐HODE and expressed as ng per mg of crude protein. Where indicated, a preincubation step with 1 μm of the 15‐LO‐1 specific inhibitor PD146176 (Cayman Chemical) for 48 h was carried out before extracting 13(S)‐HODE.
Cellular proliferation. Cell proliferation was measured using the Vybrant MTT assay kit (Invitrogen) according to the manufacturer’s guidelines. Briefly, 10 000 cells (15‐LO‐1 expressing clones 1E7 and 1F8, empty vector expressing, and untransfected parental HCT‐116 cells) plated in a final volume of 100 μL in complete RPMI‐1640 medium in 96‐well tissue culture dishes. After 24, 48, 72, and 96 h, the MTT labeling reagent was added, incubated for 4 h, and solubilized with a 1% solution of SDS for 18 h. The absorbance was determined in a Bio‐Rad microplate reader at 570 nm. In some experiments, the 15‐LO‐1 expressing cells were grown for 48 h, incubated with PD146176 for 48 h, and assayed for proliferation by MTT as above. Parental HT‐29 cells (15 000) were seeded in 96‐well plates and transfected 24 h later with the 15‐LO‐1 vector or the empty pcDNA3.1 vector. The cells were allowed to grow for 48 h then the MTT assay was carried out as described above.
Apoptosis assays. Apoptosis was quantitatively evaluated by acridine orange staining examination to identify morphological changes. Single‐cell suspensions of 15‐LO‐1 expressing HCT‐116 and HT‐29 cells as well as control cells were fixed in 1% paraformaldehyde/PBS and stained with acridine orange (Sigma‐Aldrich, Taufkirchen, Germany) and visualized under a fluorescence microscope (Leica, Wetzlar, Germany) with a blue‐green filter. The apoptotic cells were defined as cells showing cytoplasmic and nuclear shrinkage and chromatin condensation or fragmentation. At least 500 cells were counted, and the number of apoptotic cells was determined.
In addition, caspase‐3 activity assay was carried out using a caspase‐3 kit (BioVision, Mountain View, CA, USA) according to the manufacturer’s protocol. Briefly, the cells were grown in six‐well plates until they were 80% confluent (HCT‐116) or 48 h post transfection (HT‐29), lysed and the supernatant (200 μg of total protein) was incubated with a reaction buffer and the substrate Asp‐Glu‐Val‐Asp (DEVD)‐p‐nitroanilide. In the presence of active Caspase‐3, the DEVD sequence is recognized, the substrate is cleaved, and the free chromophore p‐nitoanilide is released and detected in a microplate reader at 405 nm.
Colony formation in soft agar. To evaluate the ability of cells to grow in an anchorage‐independent manner, HCT‐116 cells expressing 15‐LO‐1 and control cells (60 000) were grown on noble agar (Difco; BD Biosciences, San Jose, CA, USA). A bottom agarose layer was prepared by layering 1 mL complete RPMI‐1640 medium containing 0.6% agar and allowing it to solidify for 1 h at room temperature in a six‐well plate. Transfected or control HCT‐116 cells were suspended in 400 μL RPMI‐1640 containing 0.33% agarose. This solution (1 mL) was added onto the solidified bottom layer. After 2 weeks the plates were stained with crystal violet (0.005%), the image was captured under a Leica light microscope with 10× objective and the colonies were counted manually.
In vitro scratch wound healing assay. Cellular motility was measured by an in vitro scratch wound healing assay. HCT‐116 cells stably expressing 15‐LO‐1 and control cells were seeded in six‐well plates and incubated until they were 80–90% confluent. The monolayer of cells was scratched with a sterile pipette tip. Debris was removed from the culture by washing twice with PBS, and the cells were then incubated in RPMI‐1640 complete medium. Immediately after wounding, images were captured with an inverted microscope with 10× objective (Olympus, Hamburg, Germany), and wound sizes were verified with an ocular ruler to ensure that all wounds were the same width at the beginning of the experiment. Wound closure was monitored with microscopy after the wound was formed for 72 h. The distances between the wound edges were measured from images of the wound using the ImageJ 1.42 program.
Cell adhesion assay. Tissue culture treated 96‐well plates were incubated with 75 μL fibronectin (50 μg/mL) (Biological Industries, Kibbutz Bert Haemek, Israel) for 45 min and blocked with 1% BSA. Stably transfected HCT‐116 cells and control cells transfected with the empty vector (4 × 10⁴) as well as HT‐29 cells transiently transfected for 24 h with the 15‐LO‐1 vector, empty vector, or mock transfected cells (4 × 10⁴) were added to each well and allowed to attach for 2 h at 37°C. The wells in one plate were then washed twice with PBS to withdraw non‐adherent cells gently, while the other plate retained all the cells to represent the total number of cells plated. MTT reagent (10 μL) was added to the wells and the plates were incubated for 4 h. The formazan crystals were solubilized with 100 μL of 0.1% SDS for 18 h and the absorbance was read at 570 nm in a Bio‐Rad microplate reader. The data was represented as percentage adherent cells with respect to the total number of cells plated.
Boyden chamber cell migration and invasion assays. The migration and invasive capacities of HCT‐116 and HT‐29 cells expressing 15‐LO‐1 were measured by an in vitro Boyden chamber assay. The cells (HCT‐116: 2.5 × 10⁴ cells for both migration and invasion; HT‐29: 5 × 10⁴ cells for migration and 10 × 104 cells for invasion) in 0.5 mL serum‐free RPMI‐1640 medium were added to the upper wells of Boyden chambers containing membranes with 8 μm pores (Sigma Aldrich Chemie GmbH, Munich, Germany), either coated with or without Matrigel (1:5) (BD Biosciences). Cells were allowed to migrate or invade for 72 h for HCT‐116 cells and 48 h for HT‐29 cells. Non‐migrated cells were removed by scrubbing with sterile cotton swabs. The chambers were fixed in 100% methanol for 10 min, stained with modified Giemsa staining solution for 2 min and washed twice in distilled water. The invasion and migration of HCT‐116 and HT‐29 cells were quantified under a Leica light microscope with 4× objective by counting five fields per membrane.
Statistical analyses. Data analysis and graphing was carried out using the GraphPad Prism 5 software package (La Jolla, CA, USA). Statistical analysis between experimental results was based on the Mann–Whitney U‐test. Significant difference was statistically considered at the level of P < 0.05.
Results
Expression of 15‐LO‐1 in HCT‐116 and HT‐29 cells. To study the biological effects of 15‐LO‐1 on CRC, we generated stable monoclonal transfectants of the HCT‐116 cells and transient transfectants of the HT‐29 cells using a pcDNA3.1‐15‐LO‐1 vector as described in ‘Materials and Methods’. As controls, HCT‐116 and HT‐29 cells were transfected with the empty pcDNA3.1 vector. The expression of 15‐LO‐1 was confirmed by semiquantitative RT‐PCR (Fig. 1A) and Western blot analysis (Fig. 1B) for two monoclones (1E7 and 1F8) stably expressing 15‐LO‐1 in HCT‐116 cells and the transiently transfected HT‐29 cell line. As can be seen from Figure 1A, the parental HCT‐116 cells did not express any endogenous 15‐LO‐1 protein. RT‐PCR carried out with cDNA from parental HT‐29 cells showed the presence of low levels of 15‐LO‐1 mRNA transcripts, however, we did not detect any protein expression by Western blot analysis (Fig. 1B).
Figure 1.
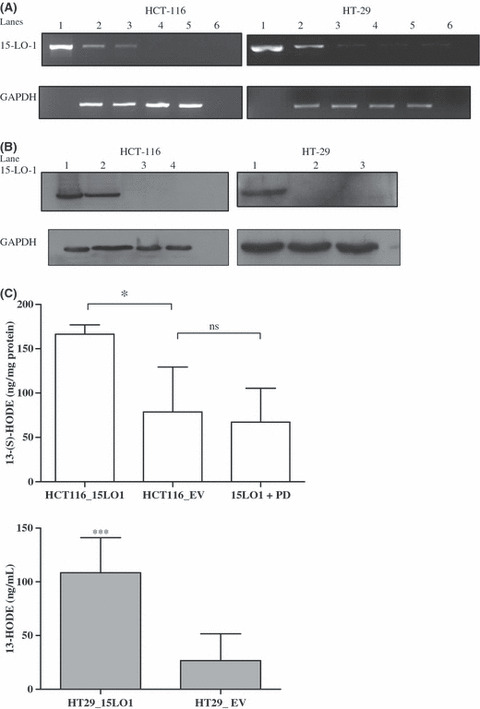
15‐Lipoxygenase‐1 (15‐LO‐1) overexpression in HCT‐116 and HT‐29 colorectal carcinoma cell lines. (A) RT‐PCR analysis of the 15‐LO‐1 transcript. For HCT‐116 cells: lane 1, 15‐LO‐1 vector (positive control); lane 2, 15‐LO‐1 expressing clone 1E7; lane 3, 15‐LO‐1 expressing clone 1F8; lane 4, empty vector (pcDNA3.1) transfected cells; lane 5, parental HCT‐116 cells; lane 6, negative control. For HT‐29 cells transiently transfected with a 15‐LO‐1 vector: lane 1, positive control; lane 2, 15‐LO‐1 expressing cells; lane 3, empty vector transfected cells; lane 4, mock transfected cells; lane 5, untransfected parental HT‐29 cells; lane 6, negative control. Band intensities were normalized using GAPDH. (B) Western blot analysis of 15‐LO‐1 protein expression. For HCT‐116: lane 1, 15‐LO‐1 expressing clone 1E7; lane 2, 15‐LO‐1 expressing clone 1F8; lane 3, empty vector transfected cells; lane 4, untransfected parental cells. For HT‐29 cells: lane 1, 15‐LO‐1 transfected cells; lane 2, empty vector transfected cells; lane 3, parental untransfected cells. Equal protein loading was confirmed by probing with a GAPDH antibody. (C) The enzymatic activity of 15‐LO‐1 transfected HCT‐116 (HCT116_15LO1, upper panel) and HT‐29 (HT29_15LO1, lower panel) cells was determined from their content of 13(S)‐HODE by an ELISA assay. A decrease in the enzymatic formation of 13(S)‐HODE was observed when HCT‐116 cells expressing 15‐LO‐1 were incubated with PD146176 (1 μm) for 24 h (15LO1 + PD, upper panel). *P < 0.05 (HCT‐116) and ***P < 0.001 (HT‐29) reflect significantly more 13(S)‐HODE compared to the empty vector (EV) expressing cells (HCT116_EV and HT29_EV). Error bars represent the SD of five independent experiments. ns, not significant.
The enzymatic function of 15‐LO‐1 was detected with an enzyme immunoassay kit for 13(S)‐HODE as described in ‘Materials and Methods’. The amount of 13(S)‐HODE detected in 15‐LO‐1 expressing HCT116 was 166.4 ng/mg protein compared to 78.8 ng/mg protein in empty vector transfected cells (*P < 0.05). When the cells were preincubated with the 15‐LO‐1 inhibitor PD146176, the enzymatic formation of 13(S)‐HODE was inhibited, however, the basal levels of 13(S)‐HODE, most likely produced by non‐enzymatic oxidation of linoleic acid, remained the same (Fig. 1C, upper panel). This is to be expected as PD146176 is a specific inhibitor of 15‐LO‐1 and lacks non‐specific antioxidant properties.( 29 ) For HT‐29 cells expressing 15‐LO‐1, the amount of 13(S)‐HODE was 108.4 ng/mg protein compared to 26.7 ng/mg protein in empty vector transfected cells (***P < 0.001).
Taken together, these data indicate that we could express a functionally active 15‐LO‐1 protein in both HCT‐116 and HT‐29 cell lines.
15‐LO‐1 expression reduces proliferation and induces apoptosis in vitro. 15‐LO‐1 expression in HCT‐116 and HT‐29 cell lines induced a decrease in proliferation of the cells significantly when analyzed by the colorimetric MTT assay. For the HCT‐116 clone 1E7, stably expressing 15‐LO‐1, the reduction in proliferation compared to the empty vector transfected cells reached statistical significance between 48 and 96 h after plating (***P < 0.001; Fig. 2A). The reduction in proliferation for 1F8 reached statistical significance at all time points (24–96 h) after plating (***P < 0.001, **P < 0.01; Fig. 2A). HT‐29 cells transiently transfected with the 15‐LO‐1 expression vector also proliferated significantly more slowly (***P < 0.001) compared to control cells (Fig. 2B). To determine whether this decrease in proliferation was a consequence of 15‐LO‐1 expression, the 1E7 cells were plated in 96‐well plates, grown for 48 h then incubated for 48 h with the specific 15‐LO‐1 inhibitor PD146176 (1 μm). The presence of the 15‐LO‐1 specific inhibitor could recover this reduced proliferation rate (Supplementary Fig. S1).
Figure 2.
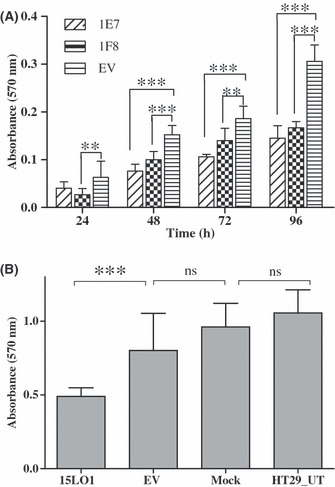
15‐Lipoxygenase‐1 (15‐LO‐1) reduces the proliferation of colon cancer cells. (A) Two clones of HCT‐116 cells stably expressing 15‐LO‐1 (1E7 and 1F8) were plated in a 96‐well plate and allow to grow for 96 h. The cellular proliferation was determined every 24 h by an MTT assay. The 15‐LO‐1 expressing cells proliferated significantly more slowly (**P < 0.01; ***P < 0.001) compared to empty vector (EV) transfected cells. (B) HT‐29 cells were seeded in 96‐well plates and transiently transfected with the 15‐LO‐1 vector. The proliferation was determined 48 h later by an MTT assay. Significantly slower growth (***P < 0.001) was observed when these cells were transfected with 15‐LO‐1 compared to empty pcDNA3.1 transfected, mock transfected, and parental untransfected HT‐29 cells (HT29_UT). Error bars represent the SD of three independent experiments. ns, not significant.
The ability of cancer cells to escape from apoptosis is a common requirement for tumorigenesis.( 30 )A qualitative analysis of apoptotic body formation and nuclear changes was carried out using the acridine orange assay as described in ‘Materials and Methods’. When the 15‐LO‐1 expressing and control cells were fixed, stained with acridine orange, and viewed under a fluorescent microscope, the apoptotic cells, with their denatured DNA, displayed an intense red fluorescence whereas non‐apoptotic cells appeared green. The results (Fig. 3A) indicate that 15‐LO‐1 expression significantly induced apoptosis in HCT‐116 and HT‐29 cell lines (**P < 0.01 for HCT‐116 and *P < 0.05 for HT‐29 compared with control cells).
Figure 3.
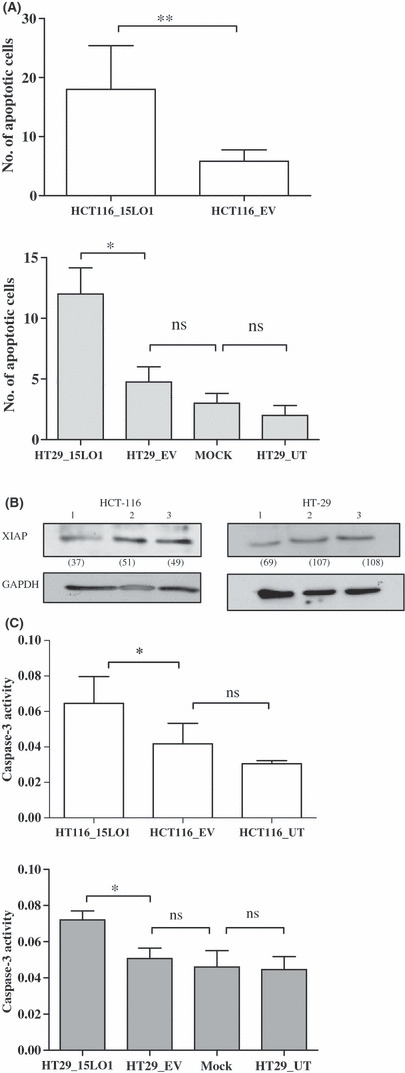
15‐Lipoxygenase‐1 (15‐LO‐1) expression induces apoptosis in colon cancer cells. (A) HCT‐116 cells stably expressing 15‐LO‐1 (HCT116_15LO1, upper panel) and HT‐29 cells transiently transfected with 15‐LO‐1 vector (HT29_15LO1, lower panel) as well as control cells were fixed and incubated with acridine orange dye to identify apoptotic cells. Both cell lines had significantly (**P < 0.01 for HCT‐116; *P < 0.05 for HT‐29) greater numbers of apoptotic cells compared to control cells. (B) Western blot analysis of X‐linked inhibitor of apoptosis (XIAP) in 15‐LO‐1 expressing cells (lane 1) showed reduced protein expression compared to EV transfected (lane 2) and parental HCT‐116 and HT‐29 cells (lane 3). Equal protein loading was confirmed by the levels of GAPDH. The numbers in parentheses indicate densitometric values after normalization to GAPDH. (C) Caspase‐3 activity assay carried out with a colorimetric kit indicates significantly higher caspase‐3 activity in HCT‐116 and HT‐29 cells expressing 15‐LO‐1 (*P < 0.05 for all comparisons) compared to control cells. Error bars represent SD of three independent experiments. ns, not significant.
We then examined the pathway by which 15‐LO‐1 expression induced apoptosis in these cell lines. Expression of the enzyme, either stably or transiently, reduced the expression of XIAP (Fig. 3B). Because XIAP can directly inhibit the activity of caspase‐3 as well as caspase‐7 and caspase‐9,( 31 ) we then examined the effect of 15‐LO‐1 expression of caspase‐3 activity. We observed that 15‐LO‐1 expression significantly increased caspase‐3 activity in HCT‐116 and HT‐29 cells compared with control cells (*P < 0.05 for all comparisons; Fig. 3C).
Expression of 15‐LO‐1 reduces anchorage‐independent growth, motility, and adhesion in HCT‐116 cells. Anchorage‐independent growth is regarded as an in vitro characteristic of neoplastic cells.( 9 ) To determine the effect of 15‐LO‐1 expression on the ability of HCT‐116 cells to grow in an anchorage‐independent manner, the soft agar assay was carried out for colony formation analysis. Our data (Fig. 4) indicates that 15‐LO‐1 expression significantly (**P < 0.01) decreased the number of colonies formed by HCT‐116 cells compared to empty vector transfected or parental cells. We, however, did not observe any difference in the size of the colonies.
Figure 4.
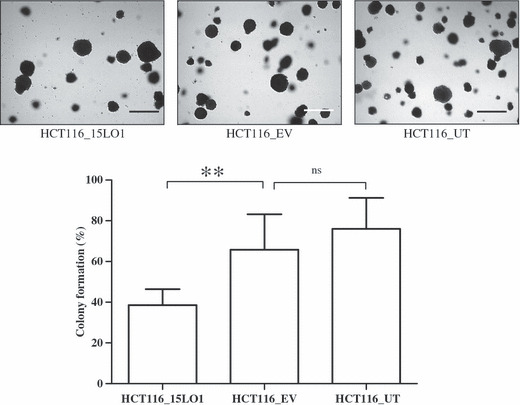
15‐Lipoxygenase‐1 (15‐LO‐1) expression decreases anchorage‐independent growth on soft agar. HCT‐116 colorectal carcinoma cells stably transfected with 15‐LO‐1 vector (HCT116_15LO1) or control cells were grown on 0.6% noble agar for 2 weeks. Colonies were stained with 0.005% crystal violet and counted under a light microscope. The cells expressing 15‐LO‐1 formed significantly fewer colonies (**P < 0.01) compared to empty vector (EV) transfected and parental untransfected (UT) cells (colony formation represented as 100%). Error bars represent three independent experiments carried out in triplicate. ns, not significant. Scale bars, 100 μm.
To determine the role of 15‐LO‐1 in the motility of HCT‐116 cells, the in vitro scratch wound healing assay was carried out. The results shown in Figure 5 indicate that after allowing the cells to grow for 72 h following application of the wound, the HCT116_15LO1 cells were less motile and could not close the wound (*P < 0.05) whereas the empty vector transfected and parental cells could completely heal the wound.
Figure 5.
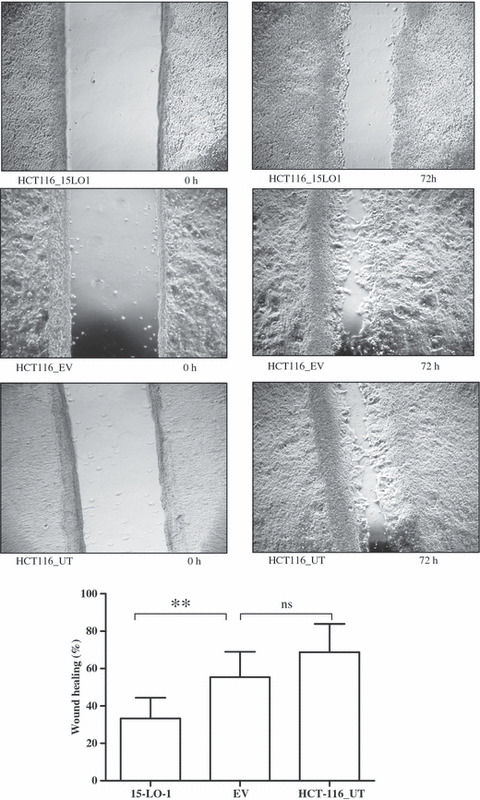
15‐Lipoxygenase‐1 (15‐LO‐1) expression causes a reduction in cell motility, represented as wound closing in confluent HCT‐116 colorectal carcinoma cells. Cells expressing 15‐LO‐1 (HCT116_15LO1) were not able to close the wound in the confluent culture, when compared with parental untransfected (HCT116_UT) and empty vector (HCT116_EV) controls, after 72 h. The graphs show 15‐LO‐1 expressing cells have significantly reduced motility (**P < 0.01) with 32% wound closure compared to 56% for EV expressing and 69% for parental HCT‐116 cells. The differences in wound closure between EV transfected and UT cells did not reach statistical significance. Error bars represent SD from three independent experiments each carried out three times. ns, not significant.
During tumor metastasis, cancer cell survival and adaptation to the new microenvironment is preceded by integrin‐mediated cell adhesion to and migration on the ECM proteins such as fibronectin. 15‐LO‐1 expression significantly reduced the ability of stably transfected HCT‐116 cells and transiently transfected HCT‐29 cells to adhere to fibronectin (***P < 0.001) (Fig. 6) when compared to control cells.
Figure 6.
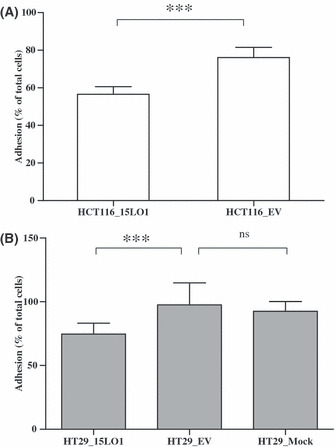
15‐Lipoxygenase‐1 (15‐LO‐1) expression reduces the ability of HCT‐116 and HT‐29 colorectal carcinoma cells to adhere to the ECM. (A) HCT‐116 cells stably transfected with 15‐LO‐1 or with the empty vector (EV) were seeded in 96‐well plates coated with 50 μg/mL fibronectin and blocked with BSA. The cells were allowed to attach for 2 h then the non‐adherent cells were removed and the MTT assay was carried out to quantify the attached cells at 570 nm. (B) HT‐29 cells transiently transfected for 24 h with the 15‐LO‐1 vector, EV, or mock transfected cells were allowed to attach to the fibronectin coated plates for 2 h. Non‐adherent cell removal and MTT assay were carried out as above. The 15‐LO‐1 expressing cells were found to adhere significantly less (***P < 0.001) to the fibronectin compared to the control cells. Error bars represent SD from two independent experiments carried out in five replicates. ns, not significant.
15‐LO‐1 expression reduces migration and invasion of colon cancer cells. In order to show the effect of 15‐LO‐1 expression on the migration and mobility of HCT‐116 and HT‐29 cells, the in vitro cell migration and Matrigel invasion assays were carried out based on the principle of the Boyden chamber assay. The Matrigel served as a reconstituted basement membrane in vitro. Cells in medium containing 1% serum were added to Transwell inserts containing membranes with 8 μm pores coated with (for invasion assays) or without (for migration assays) Matrigel. The bottom chambers contained medium with 10% FBS and 5 μg/mL fibronectin. After 72 h (for HCT‐116 cells) or 48 h (for HT‐29 cells), the membranes were fixed and stained and the number of cells that had migrated or invaded through the membrane was counted under a Leica light microscope (10× objective) and a representative image was captured using the 4× objective. Both HCT‐116 and HT‐29 cells expressing 15‐LO‐1 showed a significant decrease in the number of cells that were able to migrate (Fig. 7A and Supplementary Fig. S2) and invade across Matrigel‐coated membranes (Fig. 7B and Supplementary Fig. S3) compared to empty vector transfected cells (**P < 0.01 for all comparisons). Thus, the forced expression of 15‐LO‐1 significantly inhibited the migration and invasion of both HCT‐116 and HT‐29 cells.
Figure 7.
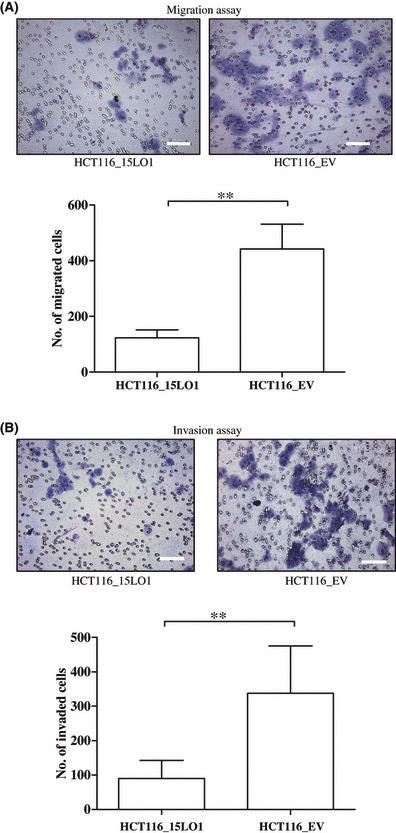
15‐Lipoxygenase‐1 (15‐LO‐1) expression reduces migration and invasion in HCT‐116 colorectal carcinoma cells when compared to empty vector (EV) controls. (A) A Transwell migration assay was done in the presence of serum as a chemoattractant. 15‐LO‐1 transfected HCT‐116 cells migrated through the 8 μm pores of the Transwell in significantly less numbers (**P < 0.01) compared to the control cells. (B) A Transwell invasion assay assaying the ability of the HCT‐116 cells to invade through Matrigel, a reconstituted basement membrane. The photographs were captured in a Leica light microscope under 4× magnification. 15‐LO‐1 expression significantly reduces (**P < 0.01) the ability of HCT‐116 cells to invade through the basement membrane in vitro. The column graph represents the number of cells that could migrate or invade through the Transwell in the experimental and control cell lines. Error bars represent SD from three independent experiments carried out in four replicates. Scale bars, 40 μm.
We next examined the pathway through which 15‐LO‐1 could be inhibiting cellular motility and invasiveness. To that extent, we examined the expression of metastasis associated protein MTA‐1, by Western blot analysis using a mouse mAb. The data (Fig. 8) indicates that both HCT‐116 and HT‐29 cells lines, transfected with 15‐LO‐1, had reduced protein levels of MTA‐1 when compared to the empty vector expressing and parental cells. Additionally, preincubation with 1 μm of the 15‐LO‐1 specific inhibitor PD146176 restored the expression of MTA‐1 to the same level as the control cells.
Figure 8.
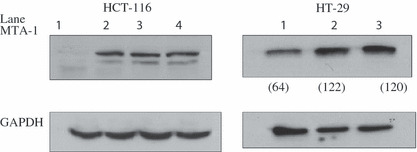
Metastasis associated protein‐1 (MTA‐1) expression is reduced in 15‐lipoxygenase‐1 (15‐LO‐1) expressing colon cancer cells. Total protein lysate isolated from HCT‐116 cells stably expressing 15‐LO‐1 (left) and HT‐29 cells transiently expressing 15‐LO‐1 (right) were probed for MTA‐1 expression using a mouse mAb. A decrease in the protein levels of MTA‐1 is observed in both cell lines in the presence of 15‐LO‐1 expression. For HCT‐116 cells: lane 1, 15‐LO‐1 expressing cells; lane 2, 15‐LO‐1 expressing cells treated with PD146176; lane 3, empty vector expressing cells; lane 4, untransfected parental cells. For HT‐29 cells: lane 1, 15‐LO‐1 expressing cells; lane 2, empty vector expressing cells; lane 3, untransfected parental cells. Equal protein loading was confirmed with the use of GAPDH. The numbers in parentheses for HT‐29 cells indicate densitometric values after normalization to GAPDH.
Discussion
In this study we have described the effect of forced expression of 15‐LO‐1 on cellular characteristics of CRC cell lines HCT‐116 and HT‐29, particularly on the ability of the protein to inhibit the metastatic potential of these cells. The gene was expressed stably in two monoclones of HCT‐116 (1E7 and 1F8) cells and transiently in HT‐29 cells. The protein was also enzymatically active as we could detect higher amounts of the enzymatic product of linoleic acid oxygenation, 13(S)‐HODE.
We then examined the effect of expression of the enzyme on cellular proliferation and apoptosis. Our data showed that the proliferation of two clones of HCT‐116 cells stably expressing 15‐LO‐1 (1E7 and 1F8) and the HT‐29 cells transiently expressing 15‐LO‐1 was slower when compared to the empty vector transfected cells. As both of the monoclones of HCT‐116 behaved similarly in their expression of 15‐LO‐1 and the rate of proliferation, we carried out all further experiments with the 1E7 clone of HCT‐116 and have also confirmed the results in the HT‐29 cell line transiently expressing 15‐LO‐1. A similar reduction in proliferation 72–96 h following transient transfection in HCT‐116 cells of 15‐LO‐1, using adenoviral delivery, has been recently reported.( 24 ) Additionally, 15‐LO‐1 expression has been shown to decrease cellular proliferation in 15‐LO‐1 overexpressing MiaPaCa2 and S2‐O13 pancreatic cancer cell lines.( 28 ) We observed that increased apoptosis contributed towards this reduced growth rate of 15‐LO‐1 expressing cells, as seen from the increased number of apoptotic cells by acridine orange staining, increased caspase‐3 activation, and decreased expression of the anti‐apoptotic XIAP protein. Wu et al. ( 24 )recently reported that 15‐LO‐1 expression decreases the expression of the anti‐apoptotic proteins XIAP and BclXL and increases caspase‐3 activity in HT‐29 and HCT‐116 cell lines.( 24 ) Our results, therefore, further confirm the findings of that study on the ability of 15‐LO‐1 to induce apoptosis, especially in CRC.
Although much is known and confirmed about the ability of 15‐LO‐1 to suppress tumorigenesis,( 6 , 18 , 21 , 25 , 28 , 32 , 33 , 34 ) the effect of this protein on metastasis needs further examination. Our findings indicate that 15‐LO‐1 expression in HCT‐116 cells could reduce anchorage‐independent growth by forming fewer colonies on soft agar compared to empty pcDNA3.1 expressing cells and untransfected cells. The cells also displayed slower motility, as shown by their inability to heal a scratch wound, whereas parental HCT‐116 and empty vector transfected cells could almost completely heal the wound within 72 h.
Two critical steps in metastasis are adhesion and migration of the primary tumor cell on the ECM at a distant site.( 35 ) We observed that stable and transient expression of 15‐LO‐1 in HCT‐116 and HT‐29, respectively, significantly reduced the ability of the cells to adhere to fibronectin, a component of the ECM. A similar reduction in the binding of cancer cells to components of the ECM has been attributed to the metastasis suppressive properties of geftinib,( 36 ) galectin‐9,( 37 ) and 15‐hydroxyprostaglandin dehydrogenase( 38 ) on CRC. We then examined the ability of HCT‐116 and HT‐29 cells to migrate through a Transwell insert membrane with 8 μm pores and invade through Matrigel, a reconstituted basement membrane. These systems are in vitro analyses of the invasive potential of malignant as well as normal cells. Our data indicates that 15‐LO‐1 expression reduced the ability of both HCT‐116 and HT‐29 cells to migrate through the Transwell insert membranes. Additionally, when a layer of the Matrigel matrix was added to the insert membranes, the cells’ ability to digest the Matrigel matrix occluding the membrane and migrating through the pores was significantly inhibited when they expressed 15‐LO‐1. Taken together our data provides, for the first time, compelling evidence supporting an inhibitory role for 15‐LO‐1 on the metastatic potential of CRC cell lines.
We then wanted to identify how 15‐LO‐1 modulates the migratory behavior of colon cancer cells. MTA‐1, a component of the nucleosome remodeling and histone deacetylase repression complex, is involved in the transcriptional repression of many different genes including 15‐LO‐1,( 19 ) estrogen receptor,( 39 ) and BRCA1.( 40 ) MTA‐1 is regulated by the epidermal growth factor receptor family and is found to be overexpressed in epithelial cancers including breast and colorectal carcinoma,( 19 , 41 , 42 ) and forced overexpression of the protein is associated with increased invasiveness and anchorage‐independent growth.( 39 , 43 ) We have observed decreased expression of MTA‐1 protein when 15‐LO‐1 is expressed stably in HCT‐116 and transiently in HT‐29 cell lines. Furthermore, when the HCT‐116 ells expressing 15‐LO‐1 were incubated with 1 μm PD146176, the expression of MTA‐1 was restored to the same level as the control cells. We propose that the decrease in the invasive phenotype observed for the 15‐LO‐1 overexpressing cells might be due to the reduced expression of MTA‐1. Zuo et al. ( 19 ) have shown a negative correlation between 15‐LO‐1 and MTA‐1 expression in paired normal and cancerous colorectal mucosa. Based on this study and ours, we speculate the possible presence of a negative feedback loop between 15‐LO‐1 and MTA‐1 expression, an idea that warrants further studies. Forced expression of 15‐LO‐1 causes a loss of MTA‐1 expression and results in a decrease in cellular motility and invasion. Overexpression of MTA‐1, commonly observed in malignant epithelial cells, causes a repression of 15‐LO‐1 expression and increases the migratory capacity of the cells.
Taken together, we have shown in this study that: (i) 15‐LO‐1 expression, either transiently or stably, causes a decrease in proliferation and increase in apoptosis of the colon cancer cell lines HCT‐116 and HT‐29; (ii) cells expressing 15‐LO‐1 have a marked reduction in their motility, lose their capacity for anchorage‐independent growth and show decreased adhesion to the extracellular matrix; (iii) 15‐LO‐1 expression causes the CRC cells to lose their invasive and migratory capacity; and (iv) cells expressing 15‐LO‐1 show decreased expression of MTA‐1, which might indicate the possible presence of a negative feedback loop regulating 15‐LO‐1 expression and the metastatic potential of colon cancer cells. These properties of 15‐LO‐1 further emphasize the importance of this protein as a possible therapeutic option in colorectal carcinogenesis.
Abbreviations
- 13(S)‐HODE
13(S)‐Hydro(per)oxyoctadecadienoic acid
- 15‐LO‐1
15‐Lipoxygenase‐1
- CRC
Colorectal carcinoma
- LO
Lipoxygenase
- MTA‐1
Metastasis associated protein‐1
- XIAP
X‐linked inhibitor of apoptosis
Supporting information
Fig. S1. The lower proliferation of 15‐LO‐1 expressing cells can be reversed with the use of a specific inhibitor PD146176. HCT‐116 cells stably expressing 15‐LO‐1 and empty vector expressing control cells were plated and allowed to grow for 48 h. The cells were then either treated or not with 1 &mgr;m PD146176 for 48 h. The cellular proliferation was then determined by an MTT assay and read colorimetrically at 570 nm.
Fig. S2. 15‐LO‐1 expression reduces migration across a Transwell membrane in HT‐29 cells. A Transwell migration assay was done in the presence of serum as a chemoattractant. 15‐LO‐1 transfected HT‐29 cells migrated through the 8 m pores of the Transwell in significantly less numbers (**P < 0.01) compared to the control cells. The bar diagram represents the number of cells that could migrate through the Transwell in the experimental and control cells lines. Error bars represent SD from two independent experiments carried out in four replicates.
Fig. S3. 15‐LO‐1 expression reduces invasion through Matrigel in HT‐29 cells. A Transwell invasion assay assaying the ability of the HT‐29 cells to invade through Matrigel, a reconstituted basement membrane was carried out. 15‐LO‐1 expression significantly reduces (**P < 0.01) the ability of HT‐29 cells to invade through the basement membrane in vitro compared to empty vector expressing control cells. The bar diagram represents the number of cells that could invade through the Matrigel coated Transwell inserts in the experimental and control cells lines. Error bars represent SD from two independent experiments carried out in four replicates.
Please note: Wiley‐Blackwell are not responsible for the content or functionality of any supporting materials supplied by the authors. Any queries (other than missing material) should be directed to the corresponding author for the article.
Supporting info item
Supporting info item
Acknowledgments
The authors wish to thank Dr Elif Erson for critically reading the manuscript and for helpful advice and discussions during the course of this study, Dr Uddhav Kelavkar for the 15‐LO‐1 pcDNA3.1 plasmid. The research was supported by TUBITAK grant no. 106S193 to S.B. The authors state that they do not have any conflicts of interest.
References
- 1. McCormick D, Kibbe PJ, Morgan SW. Colon cancer: prevention, diagnosis, treatment. Gastroenterol Nurs 2002; 25: 204–11; quiz, 11‐2. [PubMed] [Google Scholar]
- 2. Krishnamoorthy S, Honn KV. Eicosanoids in tumor progression and metastasis. Subcell Biochem 2008; 49: 145–68. [DOI] [PubMed] [Google Scholar]
- 3. Jones R, Adel‐Alvarez LA, Alvarez OR, Broaddus R, Das S. Arachidonic acid and colorectal carcinogenesis. Mol Cell Biochem 2003; 253: 141–9. [DOI] [PubMed] [Google Scholar]
- 4. Cuendet M, Pezzuto JM. The role of cyclooxygenase and lipoxygenase in cancer chemoprevention. Drug Metabol Drug Interact 2000; 17: 109–57. [DOI] [PubMed] [Google Scholar]
- 5. Furstenberger G, Krieg P, Muller‐Decker K, Habenicht AJ. What are cyclooxygenases and lipoxygenases doing in the driver’s seat of carcinogenesis? Int J Cancer 2006; 119: 2247–54. [DOI] [PubMed] [Google Scholar]
- 6. Shureiqi I, Lippman SM. Lipoxygenase modulation to reverse carcinogenesis. Cancer Res 2001; 61: 6307–12. [PubMed] [Google Scholar]
- 7. Nagy L, Tontonoz P, Alvarez JG, Chen H, Evans RM. Oxidized LDL regulates macrophage gene expression through ligand activation of PPARgamma. Cell 1998; 93: 229–40. [DOI] [PubMed] [Google Scholar]
- 8. Zuo X, Wu Y, Morris JS et al. Oxidative metabolism of linoleic acid modulates PPAR‐beta/delta suppression of PPAR‐gamma activity. Oncogene 2006; 25: 1225–41. [DOI] [PMC free article] [PubMed] [Google Scholar]
- 9. Kelavkar UP, Nixon JB, Cohen C, Dillehay D, Eling TE, Badr KF. Overexpression of 15‐lipoxygenase‐1 in PC‐3 human prostate cancer cells increases tumorigenesis. Carcinogenesis 2001; 22: 1765–73. [DOI] [PubMed] [Google Scholar]
- 10. Kelavkar U, Cohen C, Eling T, Badr K. 15‐lipoxygenase‐1 overexpression in prostate adenocarcinoma. Adv Exp Med Biol 2002; 507: 133–45. [DOI] [PubMed] [Google Scholar]
- 11. Kelavkar UP, Harya NS, Hutzley J et al. DNA methylation paradigm shift: 15‐lipoxygenase‐1 upregulation in prostatic intraepithelial neoplasia and prostate cancer by atypical promoter hypermethylation. Prostaglandins Other Lipid Mediat 2007; 82: 185–97. [DOI] [PubMed] [Google Scholar]
- 12. Hsi LC, Wilson LC, Eling TE. Opposing effects of 15‐lipoxygenase‐1 and ‐2 metabolites on MAPK signaling in prostate. Alteration in peroxisome proliferator‐activated receptor gamma. J Biol Chem 2002; 277: 40549–56. [DOI] [PubMed] [Google Scholar]
- 13. Hsi LC, Wilson L, Nixon J, Eling TE. 15‐lipoxygenase‐1 metabolites down‐regulate peroxisome proliferator‐activated receptor gamma via the MAPK signaling pathway. J Biol Chem 2001; 276: 34545–52. [DOI] [PubMed] [Google Scholar]
- 14. Yoshinaga M, Buchanan FG, DuBois RN. 15‐LOX‐1 inhibits p21 (Cip/WAF 1) expression by enhancing MEK‐ERK 1/2 signaling in colon carcinoma cells. Prostaglandins Other Lipid Mediat 2004; 73: 111–22. [DOI] [PubMed] [Google Scholar]
- 15. Ikawa H, Kamitani H, Calvo BF, Foley JF, Eling TE. Expression of 15‐lipoxygenase‐1 in human colorectal cancer. Cancer Res 1999; 59: 360–6. [PubMed] [Google Scholar]
- 16. Shureiqi I, Wojno KJ, Poore JA et al. Decreased 13‐S‐hydroxyoctadecadienoic acid levels and 15‐lipoxygenase‐1 expression in human colon cancers. Carcinogenesis 1999; 20: 1985–95. [DOI] [PubMed] [Google Scholar]
- 17. Yuri M, Sasahira T, Nakai K, Ishimaru S, Ohmori H, Kuniyasu H. Reversal of expression of 15‐lipoxygenase‐1 to cyclooxygenase‐2 is associated with development of colonic cancer. Histopathology 2007; 51: 520–7. [DOI] [PubMed] [Google Scholar]
- 18. Liu C, Xu D, Sjoberg J, Forsell P, Bjorkholm M, Claesson HE. Transcriptional regulation of 15‐lipoxygenase expression by promoter methylation. Exp Cell Res 2004; 297: 61–7. [DOI] [PubMed] [Google Scholar]
- 19. Zuo X, Morris JS, Broaddus R, Shureiqi I. 15‐LOX‐1 transcription suppression through the NuRD complex in colon cancer cells. Oncogene 2009; 28: 1496–505. [DOI] [PMC free article] [PubMed] [Google Scholar]
- 20. Shureiqi I, Zuo X, Broaddus R et al. The transcription factor GATA‐6 is overexpressed in vivo and contributes to silencing 15‐LOX‐1 in vitro in human colon cancer. FASEB J 2007; 21: 743–53. [DOI] [PMC free article] [PubMed] [Google Scholar]
- 21. Nixon JB, Kim KS, Lamb PW, Bottone FG, Eling TE. 15‐Lipoxygenase‐1 has anti‐tumorigenic effects in colorectal cancer. Prostaglandins Leukot Essent Fatty Acids 2004; 70: 7–15. [DOI] [PubMed] [Google Scholar]
- 22. Kim JS, Baek SJ, Bottone FG Jr, Sali T, Eling TE. Overexpression of 15‐lipoxygenase‐1 induces growth arrest through phosphorylation of p53 in human colorectal cancer cells. Mol Cancer Res 2005; 3: 511–7. [DOI] [PubMed] [Google Scholar]
- 23. Shureiqi I, Wu Y, Chen D et al. The critical role of 15‐lipoxygenase‐1 in colorectal epithelial cell terminal differentiation and tumorigenesis. Cancer Res 2005; 65: 11486–92. [DOI] [PMC free article] [PubMed] [Google Scholar]
- 24. Wu Y, Fang B, Yang XQ et al. Therapeutic molecular targeting of 15‐lipoxygenase‐1 in colon cancer. Mol Ther 2008; 16: 886–92. [DOI] [PMC free article] [PubMed] [Google Scholar]
- 25. Zhu H, Glasgow W, George MD et al. 15‐lipoxygenase‐1 activates tumor suppressor p53 independent of enzymatic activity. Int J Cancer 2008; 123: 2741–9. [DOI] [PMC free article] [PubMed] [Google Scholar]
- 26. Shureiqi I, Chen D, Lotan R et al. 15‐Lipoxygenase‐1 mediates nonsteroidal anti‐inflammatory drug‐induced apoptosis independently of cyclooxygenase‐2 in colon cancer cells. Cancer Res 2000; 60: 6846–50. [PubMed] [Google Scholar]
- 27. Kamitani H, Taniura S, Ikawa H, Watanabe T, Kelavkar UP, Eling TE. Expression of 15‐lipoxygenase‐1 is regulated by histone acetylation in human colorectal carcinoma. Carcinogenesis 2001; 22: 187–91. [DOI] [PubMed] [Google Scholar]
- 28. Hennig R, Kehl T, Noor S et al. 15‐lipoxygenase‐1 production is lost in pancreatic cancer and overexpression of the gene inhibits tumor cell growth. Neoplasia 2007; 9: 917–26. [DOI] [PMC free article] [PubMed] [Google Scholar]
- 29. Sendobry SM, Cornicelli JA, Welch K et al. Attenuation of diet‐induced atherosclerosis in rabbits with a highly selective 15‐lipoxygenase inhibitor lacking significant antioxidant properties. Br J Pharmacol 1997; 120: 1199–206. [DOI] [PMC free article] [PubMed] [Google Scholar]
- 30. Hanahan D, Weinberg RA. The hallmarks of cancer. Cell 2000; 100: 57–70. [DOI] [PubMed] [Google Scholar]
- 31. Dubrez‐Daloz L, Dupoux A, Cartier J. IAPs: more than just inhibitors of apoptosis proteins. Cell Cycle 2008; 7: 1036–46. [DOI] [PubMed] [Google Scholar]
- 32. Hsi LC, Xi X, Lotan R, Shureiqi I, Lippman SM. The histone deacetylase inhibitor suberoylanilide hydroxamic acid induces apoptosis via induction of 15‐lipoxygenase‐1 in colorectal cancer cells. Cancer Res 2004; 64: 8778–81. [DOI] [PubMed] [Google Scholar]
- 33. Philips BJ, Dhir R, Hutzley J, Sen M, Kelavkar UP. Polyunsaturated fatty acid metabolizing 15‐Lipoxygenase‐1 (15‐LO‐1) expression in normal and tumorigenic human bladder tissues. Appl Immunohistochem Mol Morphol 2008; 16: 159–64. [DOI] [PubMed] [Google Scholar]
- 34. Shureiqi I, Jiang W, Zuo X et al. The 15‐lipoxygenase‐1 product 13‐S‐hydroxyoctadecadienoic acid down‐regulates PPAR‐delta to induce apoptosis in colorectal cancer cells. Proc Natl Acad Sci U S A 2003; 100: 9968–73. [DOI] [PMC free article] [PubMed] [Google Scholar]
- 35. Joyce JA, Pollard JW. Microenvironmental regulation of metastasis. Nat Rev Cancer 2009; 9: 239–52. [DOI] [PMC free article] [PubMed] [Google Scholar]
- 36. Toda D, Ota T, Tsukuda K et al. Gefitinib decreases the synthesis of matrix metalloproteinase and the adhesion to extracellular matrix proteins of colon cancer cells. Anticancer Res 2006; 26: 129–34. [PubMed] [Google Scholar]
- 37. Nobumoto A, Nagahara K, Oomizu S et al. Galectin‐9 suppresses tumor metastasis by blocking adhesion to endothelium and extracellular matrices. Glycobiology 2008; 18: 735–44. [DOI] [PubMed] [Google Scholar]
- 38. Li M, Xie J, Cheng L et al. Suppression of invasive properties of colorectal carcinoma SW480 cells by 15‐hydroxyprostaglandin dehydrogenase gene. Cancer Invest 2008; 26: 905–12. [DOI] [PubMed] [Google Scholar]
- 39. Mazumdar A, Wang RA, Mishra SK et al. Transcriptional repression of oestrogen receptor by metastasis‐associated protein 1 corepressor. Nat Cell Biol 2001; 3: 30–7. [DOI] [PubMed] [Google Scholar]
- 40. Molli PR, Singh RR, Lee SW, Kumar R. MTA1‐mediated transcriptional repression of BRCA1 tumor suppressor gene. Oncogene 2008; 27: 1971–80. [DOI] [PMC free article] [PubMed] [Google Scholar]
- 41. Nicolson GL, Nawa A, Toh Y, Taniguchi S, Nishimori K, Moustafa A. Tumor metastasis‐associated human MTA1 gene and its MTA1 protein product: role in epithelial cancer cell invasion, proliferation and nuclear regulation. Clin Exp Metastasis 2003; 20: 19–24. [DOI] [PubMed] [Google Scholar]
- 42. Giannini R, Cavallini A. Expression analysis of a subset of coregulators and three nuclear receptors in human colorectal carcinoma. Anticancer Res 2005; 25: 4287–92. [PubMed] [Google Scholar]
- 43. Mahoney MG, Simpson A, Jost M et al. Metastasis‐associated protein (MTA)1 enhances migration, invasion, and anchorage‐independent survival of immortalized human keratinocytes. Oncogene 2002; 21: 2161–70. [DOI] [PubMed] [Google Scholar]
Associated Data
This section collects any data citations, data availability statements, or supplementary materials included in this article.
Supplementary Materials
Fig. S1. The lower proliferation of 15‐LO‐1 expressing cells can be reversed with the use of a specific inhibitor PD146176. HCT‐116 cells stably expressing 15‐LO‐1 and empty vector expressing control cells were plated and allowed to grow for 48 h. The cells were then either treated or not with 1 &mgr;m PD146176 for 48 h. The cellular proliferation was then determined by an MTT assay and read colorimetrically at 570 nm.
Fig. S2. 15‐LO‐1 expression reduces migration across a Transwell membrane in HT‐29 cells. A Transwell migration assay was done in the presence of serum as a chemoattractant. 15‐LO‐1 transfected HT‐29 cells migrated through the 8 m pores of the Transwell in significantly less numbers (**P < 0.01) compared to the control cells. The bar diagram represents the number of cells that could migrate through the Transwell in the experimental and control cells lines. Error bars represent SD from two independent experiments carried out in four replicates.
Fig. S3. 15‐LO‐1 expression reduces invasion through Matrigel in HT‐29 cells. A Transwell invasion assay assaying the ability of the HT‐29 cells to invade through Matrigel, a reconstituted basement membrane was carried out. 15‐LO‐1 expression significantly reduces (**P < 0.01) the ability of HT‐29 cells to invade through the basement membrane in vitro compared to empty vector expressing control cells. The bar diagram represents the number of cells that could invade through the Matrigel coated Transwell inserts in the experimental and control cells lines. Error bars represent SD from two independent experiments carried out in four replicates.
Please note: Wiley‐Blackwell are not responsible for the content or functionality of any supporting materials supplied by the authors. Any queries (other than missing material) should be directed to the corresponding author for the article.
Supporting info item
Supporting info item