

Abstract
Pancreatic ductal adenocarcinoma is often characterized by an abundant desmoplastic stroma that is partially induced by activated pancreatic stellate cells (PSCs). Indirect co‐culture has often been used to investigate the effects of cancer–stromal interactions on the proliferation of cancer cells, but the effects of cell–cell adhesion and juxtacrine signaling between cancer and stromal cells cannot be evaluated using this method. This study aimed to establish a simplified direct co‐culture system that could be used to quantify populations of cancer cells in co‐culture with PSCs, and to evaluate the effects of direct cell contact on the proliferation of cancer cells. We established three green fluorescent protein (GFP)‐expressing pancreatic cancer cell lines and were able to quantify them with high reliability and reproducibility, even when co‐cultured directly with PSCs, using a color plate reader. We assessed the differential effects of direct and indirect co‐culture with PSCs on the proliferation of cancer cells, and found that the proliferation of GFP‐expressing pancreatic cancer cell lines was dramatically enhanced by direct co‐culture with PSCs, compared with the indirect co‐culture system. We also found that direct co‐culture of cancer cells and PSCs activated the Notch signaling pathway in both cell types. Direct cell contact between cancer cells and PSCs plays an important role in the control of cancer cell proliferation, and is essential to the understanding of tumor–stromal interactions. (Cancer Sci 2009; 100: 2309–2317)
Pancreatic ductal adenocarcinoma (PDAC) is often characterized by an abundant desmoplastic stroma,( 1 , 2 , 3 ) which is defined as a proliferation of fibrotic tissue with an altered extracellular matrix (ECM) that is conductive to tumor growth and metastasis.( 4 , 5 , 6 , 7 ) The host’s desmoplastic reaction is characterized by complex interactions between normal host epithelial cells, invading tumor cells, stromal fibroblasts, inflammatory cells, proliferating endothelial cells, the altered ECM, and growth factors, which activate oncogenic signaling pathways by autocrine and paracrine mechanisms.( 7 , 8 , 9 , 10 ) Recently, a pronounced increase in the number of α‐smooth muscle actin (α‐SMA)‐positive myofibroblasts was reported in PDAC.( 3 ) In addition, other studies have demonstrated that pancreatic stellate cells (PSCs) are associated with tumor desmoplasia.( 1 , 8 , 11 ) Although the desmoplastic reaction was initially regarded as a host barrier against tumor invasion, it has become evident that pancreatic cancer cells induce fibrosis by activating PSCs to synthesize excessive ECM.( 1 , 3 , 12 ) The ECM influences the growth, differentiation, survival, and motility of cells by both providing a physical scaffold and acting as a reservoir for soluble mitogens.( 5 , 6 , 9 , 10 ) PSCs have also been reported to inhibit apoptosis( 13 , 14 ) and enhance the migration and invasion of pancreatic cancer cells.( 14 , 15 ) The tumor‐supportive microenvironment is thus a dynamic environment that promotes tumor growth and invasion.
Several models have been established to investigate tumor–stromal interactions, including in vivo xenograft models,( 16 , 17 , 18 , 19 , 20 ) in vitro three‐dimensional co‐culture models,( 21 , 22 , 23 , 24 ) in vitro two‐chamber co‐culture models using culture inserts,( 10 , 18 , 25 , 26 , 27 , 28 , 29 ) and in vitro direct co‐culture models.( 30 , 31 , 32 ) The two‐chamber co‐culture models, which are often used for in vitro experiments, are not suitable for investigating the effects of direct cell contacts between stromal cells and cancer cells on tumor biology. In contrast, the in vivo xenograft and in vitro direct co‐culture models can be used to evaluate the effects of cell–cell adhesion and juxtacrine signaling, but simple and reproducible quantitative assessment of cell populations using these methods remains problematic. Krtolica et al. ( 33 , 34 ) established a method for quantifying a population of epithelial cells directly co‐cultured with fibroblasts using fluorescence imaging of 4,6‐diamidino‐2‐phenylindole (DAPI) and green fluorescent protein (GFP). In the present study, we modified and simplified this method to investigate the parameters affecting cell growth with high sensitivity, high reproducibility, and ease of handling, which are difficult to achieve with other available methods. We quantified the population of GFP‐expressing cells using a color plate reader,( 35 , 36 , 37 , 38 ) and were able to quantitatively detect GFP‐expressing cancer cells, even in direct co‐culture with PSCs. We compared the use of direct and indirect co‐culture systems for investigating the effects of cell interactions with PSCs on the proliferation of GFP‐expressing pancreatic cancer cell lines. Furthermore, to investigate the effects of the juxtacrine mechanism, we assessed the associations of the Notch signaling pathway with these two co‐culture systems.
Materials and Methods
Establishment of cell lines constitutively expressing GFP. We used three pancreatic cancer cell lines in our study (Table 1). SUIT‐2 and Panc‐1 were generously provided by Dr H. Iguchi, (National Shikoku Cancer Center, Matsuyama, Japan), and MIA PaCa‐2 was obtained from the Japanese Cancer Resource Bank (Tokyo, Japan). Cells were maintained as previously described.( 18 ) A pAcGFP1‐N1 vector (Clontech, Palo Alto, CA, USA) encoding GFP was used to create stable GFP‐expressing cell lines (GFP‐SUIT‐2, GFP‐Panc‐1, and GFP‐MIA PaCa2). The pAcGFP1‐N1 vector was electroporated into SUIT‐2, Panc‐1, and MIA PaCa‐2 cell lines using Nucleofector (Amaxa Biosystems, Koln, Germany), according to the manufacturer’s instructions. SUIT‐2 cells electroporated with pAcGFP1‐N1 were selected for neomycin resistance (G418, 800 μg/mL) in Dulbecco’s modified Eagle’s medium (DMEM; Sigma Chemical Co., St. Louis, MO, USA) supplemented with 10% fetal bovine serum (FBS), streptomycin (100 μg/mL), and penicillin (100 U/mL). Green colonies were isolated and grown in the absence of selective pressure for several months. Panc‐1 and MIA PaCa‐2 cells electroporated with pAcGFP1‐N1 were sorted using a cell sorter (Epics Altra; Beckman Coulter, Fullerton, CA, USA), according to the manufacturer’s instructions.
Table 1.
Cell lines
| Cell line | Tissue origin | Diagnosis | Doubling time (h) |
|---|---|---|---|
| Pancreatic cancer cell lines constitutively expressing GFP | |||
| GFP‐SUIT‐2 | Liver metastasis | PDAC | 19.56 ± 0.73 |
| GFP‐Panc‐1 | Pancreas | PDAC | 22.24 ± 1.10 |
| GFP‐MIA PaCa‐2 | Pancreas | PDAC | 16.81 ± 0.15 |
| Fibroblast cell line | |||
| MRC5 | Human embryonic lung | 27.75 ± 1.37 | |
| Primary cultured myofibroblasts | |||
| NPF‐1 | Normal pancreas | Benign endocrine tumor | 24.26 ± 2.48 |
| NPF‐2 | Normal pancreas | Bile duct carcinoma | 53.28 ± 2.47 |
| PCF‐1 | Pancreatic cancer | PDAC | 40.60 ± 0.75 |
| PCF‐2 | Pancreatic cancer | PDAC | 21.74 ± 2.18 |
| MCF‐1 | Metastatic tumor of abdominal wall | PDAC | 30.84 ± 3.15 |
GFP, green fluorescence protein; PDAC, pancreatic ductal adenocarcinoma.
Fibroblasts and myofibroblasts including PSCs. We used a human fibroblast cell line MRC5 (Riken, Tokyo, Japan). Two cultures of PSCs derived from normal pancreases without pancreatitis (NPF‐1, from a patient with a benign endocrine tumor of the pancreas, and NPF‐2, from a patient with bile duct cancer), two cultures of PSCs derived from pancreatic cancer tissues of patients with PDAC (PCF‐1 and PCF‐2), and a culture of myofibroblasts derived from a metastatic tumor of the abdominal wall in a patient with PDAC (MCF‐1) were also used in this study (Table 1). All primary cultures of myofibroblasts were isolated using the outgrowth method, as described previously.( 39 ) Cells were maintained as described previously.( 18 )
Propidium iodide (PI) assay. To calculate the doubling time of each cell line, cells were seeded in 24‐well plates (Becton Dickinson Labware, Bedford, MA, USA) at a density of 1 × 10⁴ cells/well, using cell numbers previously counted using a particle distribution analyzer (CDA 500; Sysmex, Kobe, Japan). Cell populations were evaluated by measuring the fluorescence intensity of PI at specified times, as described previously.( 40 )
GFP fluorescence measurements. The fluorescence of cells in multiwell plates was quantified in triplicate using a Cytofluor II (Perseptive Biosystems, Framingham, MA, USA) at gain 80, with filter settings of excitation at 485 nm with a bandwidth of 20 nm and emission at 530 nm with a bandwidth of 25 nm, as described previously.( 35 , 36 , 37 , 38 ) Fluorescence intensity was calculated in relative fluorescence units (RFU). The nonspecific signal of wells containing cell‐free medium or PSCs alone (blank value) was subtracted from the results to give the fluorescence signal of the GFP‐expressing cells. To obtain sensitive and reproducible measurements, we used DMEM without phenol red.
In vitro direct co‐culture system. For proliferation assays, 1 × 10⁴ GFP‐expressing cancer cells were mixed with 1 × 10⁴ stromal cells. Each cell mixture was seeded in a 24‐well plate (1 × 10⁴ cancer cells/well) in triplicate, and cultured in DMEM supplemented with 1% or 10% FBS. The fluorescence signals of each well were detected at specified times. To analyze GFP expression, 5 × 10⁴ GFP‐SUIT‐2 cells were mixed with 5 × 10⁴ PSCs, seeded in a six‐well plate in triplicate, and cultured in DMEM supplemented with 10% FBS for 3 days. After harvesting the cells, the total cell number was determined using the CDA 500. The PSC/GFP‐SUIT‐2 cell proportion was determined using a cell sorter (Epics Altra) based on the GFP fluorescence as described previously,( 30 , 32 ) and we isolated GFP‐SUIT‐2 cells and GFP‐negative PSCs according to the manufacturer’s instructions.
In vitro indirect co‐culture system. For proliferation assays, 1 × 10⁴ GFP‐expressing cancer cells were seeded in triplicate into the lower wells of a transwell cell culture system (24‐well type, fluoroblock membrane with 3‐μm pores; Becton Dickinson, San Jose, CA, USA) and 1 × 10⁴ PSCs were seeded into the upper chambers (cell culture inserts), and cultured in DMEM supplemented with 1% or 10% FBS. The fluorescence signals of each well were detected at specified times. To analyze GFP expression, 5 × 10⁴ GFP‐SUIT‐2 cells were seeded in triplicate into the lower wells of a transwell cell culture system (six‐well type, 3‐μm pores; Becton Dickinson) and 5 × 10⁴ PSCs were seeded into the upper chambers, and cultured in DMEM supplemented with 10% FBS for 3 days. After harvesting the cells, the total cell number was determined using the CDA 500.
Immunoblot analysis for α‐smooth muscle actin (α‐SMA). Immunoblot analysis for α‐SMA was performed as described previously.( 18 ) Briefly, whole‐cell lysates were fractionated by 10% sodium dodecyl sulfate–polyacrylamide gel electrophoresis and transferred to a polyvinylidene difluoride membrane (Millipore, Bedford, MA, USA). The membrane was incubated with 1:500 dilutions of monoclonal mouse antihuman α‐SMA antibody (Dako, Glostrup, Denmark) overnight at 4°C, and then probed with antimouse IgG conjugated with horseradish peroxidase (Invitrogen, Carlsbad, CA, USA) for 1 h at room temperature. Immunoblots were detected using the enhanced chemiluminescence system (Amersham Biosciences, Little Chalfont, UK) and visualized with a Molecular Imager (ChemiDoc XRS System; Bio‐Rad Laboratories, Hercules, CA, USA). The membrane was stripped and probed with anti‐β‐actin antibody (Santa Cruz Biotechnology, Santa Cruz, CA, USA), as an internal control.
Immunofluorescence staining of α‐SMA. PSCs (5 × 10⁴) were seeded on six‐well plates and cultured in DMEM supplemented with 10% FBS for 24 h. Cells were fixed with 4% paraformaldehyde for 10 min, permeabilized with 0.2% Triton X‐100, blocked with blocking solution (1% FBS and 1% BSA in PBS), and incubated with 1:500 dilutions of monoclonal mouse antihuman α‐SMA antibody (Dako) for 2 h at room temperature. The cells were then incubated for 1 h with Alexa 546‐conjugated antimouse IgG (Molecular Probes, Eugene, OR, USA) and 0.05 μg/mL DAPI. A TE‐2000U inverted microscope (Nikon, Tokyo, Japan) was used for immunofluorescence microphotography and images were managed using VB‐Viewer software (Keyence, Osaka, Japan).
Flow cytometry. Cellular expression of α‐SMA was examined by flow cytometry (Epics Altra) using a phycoerythrin (PE)‐conjugated monoclonal mouse antihuman α‐SMA antibody (R&D Systems, Minneapolis, MN, USA) according to the manufacturer’s instructions. Non‐specific mouse IgG (Miltenyi Biotec, Auburn, CA, USA) was used as a negative control.
Quantitative real‐time reverse transcription–polymerase chain reaction (qRT–PCR). Total RNA was extracted from cultured cells using a High Pure RNA Isolation Kit (Roche Diagnostics, Mannheim, Germany), according to the manufacturer’s protocol. qRT–PCR was performed using a QuantiTect SYBR Green RT–PCR Kit (Qiagen, Tokyo, Japan) with Opticon4 (Bio‐Rad Laboratories), as described previously.( 41 ) Briefly, the reaction mixture was first incubated at 50°C for 15 min to allow reverse transcription. PCR was initiated with one cycle at 95°C for 10 min to activate modified Taq polymerase, followed by 45 cycles at 94°C for 15 s, 55°C for 20 s, and 72°C for 10 s, and one cycle at 95°C for 0 s, 65°C for 15 s, and +0.1°C/s to 95°C for melting analysis. Each sample was run in triplicate. The 10% deviation was calculated from the concentrations determined from the calibration curve. The level of mRNA expression was calculated from a standard curve constructed using total RNA from MRC5 cells. We designed specific primers (Table 2), and screened a database with BLASTN to confirm the specificity of these primers. Primers for Snail were designed by Takara Bio (primer set ID: HA075019; Ohtsu, Shiga, Japan). Expression of each mRNA was normalized to that of 18S rRNA.
Table 2.
Primer sequences and product size
| Primer | Forward | Reverse | Product size |
|---|---|---|---|
| Sequence 5′–3′ | Sequence 5′–3′ | ||
| α‐SMA | ccgggagaaaatgactcaaa | gcgtccagaggcatagagag | 97 |
| COL1 | acgtgatctgtgacgagacc | agcaaagtttcctccgaggc | 250 |
| Snail | Takara Bio (primer set ID: HA075019) | ||
| Vimentin | tgcccttaaaggaaccaatg | gcttcaacggcaaagttctc | 72 |
| N‐cadherin | aggatcaaccccatacacca | tggtttgaccacggtgacta | 125 |
| Notch‐1 | tccaccagtttgaatggtca | cgcagagggttgtattggtt | 80 |
| Hes‐1 | ccaaagacagcatctgagca | tcagctggctcagactttca | 91 |
| Jagged‐1 | ctgcctctctgatccctgtc | tggggaacactcacactcaa | 76 |
| 18S rRNA | gtaacccgttgaaccccatt | ccatccaatcggtagtagcg | 151 |
α‐SMA, α‐smooth muscle actin; COL1, collagen type I; Hes‐1, hairy and enhancer‐of‐split homolog‐1.
Statistical analysis. Statistical analyses and graph presentations were carried out using JMP 7 (SAS Institute, Cary, NC, USA). Values were expressed as the mean ± SD. Comparisons between two groups were performed using Student’s t‐test. The level of statistical significance was set at P < 0.05. Correlations between two groups were statistically evaluated by regression analysis and by calculating Spearman’s rank‐correlation coefficient.
Results
Correlation between the number of cells and fluorescence intensity of GFP. We established three pancreatic cancer cell lines constitutively expressing GFP, as described in the Materials and Methods (Fig. 1a). These clones were confirmed by flow cytometry to be >99% GFP‐positive in comparison with the non‐GFP‐expressing parental cell lines (Fig. 1b). In the first series of experiments, we evaluated the efficiency of GFP fluorescence for the determination of cell numbers (Fig. 1c). Regression analysis confirmed that the fluorescence intensity of total GFP‐SUIT‐2 cells was correlated with the cell numbers counted within the range from 5 × 10³–1 × 10⁶ cells/well (Fig. 1d; Spearman’s rank‐correlation coefficient: 0.995, P < 0.0001). Similarly, there were significant correlations between fluorescence intensity and the numbers of GFP‐Panc1 and GFP‐MIA PaCa‐2 cells (data not shown). In addition, we found a significant correlation between GFP fluorescence and PI fluorescence calculated by PI assay as another method for evaluating cell proliferation (Supporting Information Fig. S1a,b; Spearman’s rank‐correlation coefficient: 0.998, P < 0.0001). The lower limit of detection for GFP fluorescence was in the order of 1000 cells/well for these cell lines (data not shown). At ≥1 × 10⁶ cells/well, cells became confluent in flat‐bottomed 24‐well plates; thus, 1 × 10⁴–5 × 10⁵ cells were used in subsequent experiments.
Figure 1.

(a) Microphotographs of three pancreatic cancer cell lines constitutively expressing green fluorescent protein (GFP). (b) The GFP‐SUIT‐2, GFP‐Panc‐1, and GFP‐MIA PaCa‐2 clones used for subsequent experiments were confirmed by flow cytometry to be >99% GFP‐positive in comparison with the non‐GFP‐expressing parental cell lines. (c) GFP fluorescence intensity of GFP‐SUIT‐2 cells. (d) Regression analysis confirmed that the fluorescence intensity of GFP‐SUIT‐2 cells was correlated with the number of cells counted within the range from 5 × 10³–1 × 10⁶ cells/well (Spearman’s rank‐correlation coefficient: 0.994, P < 0.0001).
α‐SMA expression in myofibroblasts. To elucidate tumor–stromal interactions between pancreatic cancer cells and PSCs, we isolated bulky lines of myofibroblasts from resected normal pancreas, pancreatic cancer tissue, and a metastatic tumor from a patient with PDAC using the outgrowth method, as described previously.( 39 ) To confirm that PSCs expressed high levels of α‐SMA and collagen type I (COL1),( 1 , 12 , 39 , 42 ) we analyzed the expression levels of α‐SMA and COL1 mRNAs in these myofibroblast cultures. All myofibroblast cultures expressed higher levels of α‐SMA and COL1 mRNA than MRC5 and cancer cells (Fig. 2a,b). Interestingly, MCF‐1 myofibroblasts derived from a metastatic tumor also expressed high levels of α‐SMA and COL1 mRNAs. Immunoblot analysis and immunofluorescence staining revealed that these myofibroblast cultures expressed α‐SMA protein (Fig. 2c,d). We further found that >80% of PSCs and myofibroblasts expressed α‐SMA by flow cytometry (Fig. 2e,f). We used these four PSC cultures and one myofibroblast culture to establish a simplified direct co‐culture system using GFP‐expressing cancer cells in the following experiments.
Figure 2.
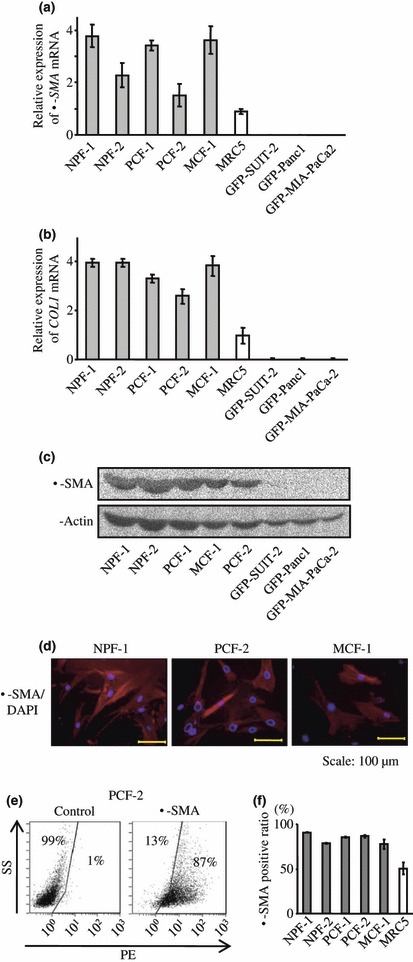
(a,b) Pancreatic stellate cells (PSCs) expressed higher levels of α‐smooth muscle actin (α‐SMA) and collagen type I (COL1) mRNAs than MRC5 and cancer cells. (c,d) Immunoblot analysis and immunofluorescence staining revealed that these myofibroblasts expressed α‐SMA protein. (e,f), Flow cytometry demonstrates that >80% of the PSCs and myofibroblasts expressed α‐SMA.
Effects of co‐culture on cell morphology. Indirect co‐culture has often been used to investigate the effects of cancer–stromal interactions on the proliferation of cancer cells, because of its easy evaluation (Fig. 3a). However, the effects of cell–cell adhesion and juxtacrine signaling between cancer and stromal cells cannot be evaluated by this method. To evaluate these effects, we established a direct co‐culture system using GFP‐expressing cells (Fig. 3a). Initially, we assessed the effects of direct co‐culture with PSCs on the morphology of cancer cells. Monocultured GFP‐SUIT‐2 cells were almost round in shape (Fig. 3b), whereas indirectly and directly co‐cultured cells exhibited a fibroblastoid morphology (Fig. 3b). These findings suggest that co‐culture with PSCs promoted the epithelial–mesenchymal transition (EMT)( 43 ) of GFP‐SUIT‐2 cells. We evaluated the effects of the morphological alterations on the GFP expression levels in GFP‐SUIT‐2 cells by flow cytometry and found that there was no significant difference between monocultured and co‐cultured cells (Fig. 3c). To confirm the induction of the EMT in co‐cultured GFP‐SUIT‐2 cells, we isolated them using a cell sorter (Fig. 3d), and quantified the mRNA levels of EMT markers, including Snail, Vimentin, and N‐cadherin (Fig. 3e). Directly co‐cultured GFP‐SUIT‐2 cells expressed significantly higher levels of these mRNAs than monocultured cells.
Figure 3.

(a) Schemas of the two co‐culture systems. (b) Representative microphotographs of green fluorescent protein (GFP)‐SUIT‐2 cells in monoculture (left), indirect co‐culture with PCF‐2 cells (center), and direct co‐culture with PCF‐2 cells (right). Monocultured GFP‐SUIT‐2 cells were almost round in shape, whereas co‐cultured cells exhibited a fibroblastoid morphology. (c) There was no significant difference in the GFP expression levels between monocultured and co‐cultured cells. (d) The PSC/GFP‐SUIT‐2 cell proportion was determined, and GFP‐expressing cancer cells and GFP‐negative PSCs were isolated using a cell sorter. (e) Directly co‐cultured GFP‐SUIT‐2 cells expressed significantly higher mRNA levels for the epithelial–mesenchymal transition (EMT) markers Snail, Vimentin, and N‐cadherin, compared with monocultured cells.
Proliferation of cancer cells in direct and indirect co‐culture systems. In our preliminary study, we evaluated the effects of co‐culture on the fluorescence intensity of GFP‐SUIT‐2 cells. Both types of GFP‐SUIT‐2 (5 × 10⁴) co‐cultures expressed similar levels of fluorescence intensity to monocultured cells, regardless of the number of co‐cultured PSCs (Supporting Information Fig. S1c), and the fluorescence intensity of GFP‐SUIT‐2 cells (1 × 10⁴–2 × 10⁵) was correlated with the number of cells, despite the coexistence of PSCs (4 × 10⁴) and their EMT‐like morphological changes (Supporting Information Fig. S1d,e; Spearman’s rank‐correlation coefficient: 0.993, P < 0.0001). These correlations indicate that coexistence with PSCs did not affect the fluorescence intensity of GFP‐SUIT‐2 cells. Taken together, these data suggest that this direct co‐culture system is well suited for investigating cancer–stromal interactions through direct cell contacts, because it represents a quantitative and reproducible method for evaluating cell populations (Supporting Information Fig. S1a–e).
Using in vitro direct and indirect co‐culture systems, we analyzed the proliferation of GFP‐expressing cancer cells. In order to compare both co‐culture systems, we assessed the proliferation ratios and compared them with that of monocultured cells. In our preliminary study, we assessed the effects of co‐culture with the human embryonic lung fibroblast cell line MRC5 on the proliferation of GFP‐SUIT‐2 cells cultured in DMEM supplemented with 1% or 10% FBS. Although direct co‐culture with MRC5 cells enhanced the proliferation of GFP‐SUIT‐2 cells in the presence of both concentrations of FBS, the enhancement was more evident for 10% FBS (Fig. 4a,b). NPF‐1 and PCF‐2 cells also significantly enhanced the proliferation of GFP‐SUIT‐2 cells in the direct co‐culture system compared with the indirect co‐culture system and monocultured cells, especially in the presence of 10% FBS (Fig. 4c–f). Therefore, we evaluated the effects of co‐cultures with 10% FBS in the following experiments.
Figure 4.

(a–f) Proliferation ratios of green fluorescent protein (GFP)‐SUIT‐2 cells in direct and indirect co‐cultures with MRC5 (a,b), NPF‐1 (c,d), and PCF‐2 (e,f) cells compared with monocultures in the presence of 1% FBS (a,c,e) and 10% FBS (b,d,f). In direct co‐culture MRC5, NPF‐1, and PCF‐2 cells significantly enhanced the proliferation of GFP‐SUIT‐2 cells compared with indirect co‐culture and monoculture, at 72 h after seeding (†P < 0.05), especially in the presence of 10% FBS. (g) Proliferation ratios of the three pancreatic cancer cell lines in the two co‐culture systems at 72 h after seeding in the presence of 10% FBS compared with monocultures. Direct co‐culture with both types of pancreatic stellate cells (PSCs) significantly enhanced the proliferation of the three pancreatic cancer cell lines compared with those in indirect co‐culture (†P < 0.05).
In similar experiments, we compared the proliferation ratios of GFP‐SUIT‐2, GFP‐Panc1, and GFP‐MIA PaCa‐2 pancreatic cancer cells in direct and indirect co‐culture systems at 72 h after seeding. We found that direct co‐culture with PSCs significantly enhanced the proliferation of the three pancreatic cancer cell lines compared with indirect co‐culture (P < 0.05) (Fig. 4g). These data suggest that direct cell contacts and juxtacrine signaling between cancer cells and PSCs, which cannot be evaluated in paracrine models such as indirect co‐cultures, have significant effects on the growth of cancer cells.
We also observed the distributions of GFP‐SUIT‐2 cells and PSCs after 72 h of direct co‐culture (Fig. 5a). PSCs proliferated around the GFP‐expressing cancer cells, as observed in the surrounding desmoplastic stroma. To confirm the enhancement of proliferation in the direct co‐culture system, we calculated the cell numbers after 72 h of incubation by flow cytometry (Fig. 5b), as described previously.( 30 , 32 ) The numbers of GFP‐SUIT‐2 cells directly co‐cultured with NPF‐1 and PCF‐2 cells were significantly higher than those of indirectly co‐cultured and monocultured cells (Fig. 5c). Next, to evaluate the effects of co‐culture on PSCs, we calculated the numbers of GFP‐negative PSCs and measured COL1 mRNA levels in sorted PSCs (Fig. 5d,e). Indirect and direct co‐culture with GFP‐SUIT‐2 cells significantly enhanced the proliferation of NPF‐1 and PCF‐2 cells (Fig. 5d). In addition, COL1 mRNA levels in co‐cultured NPF‐1 and PCF‐2 cells were significantly higher than those in monocultured cells (Fig. 5e). These data suggest that co‐culture with cancer cells enhanced the proliferation and collagen synthesis of PSCs.
Figure 5.

(a) Representative microphotographs of direct co‐cultures of green fluorescent protein (GFP)‐SUIT‐2 cells with NPF‐1 and PCF‐2 cells at 72 h after seeding. Pancreatic stellate cells (PSCs) proliferated around the GFP‐positive cancer cells, as observed in the surrounding desmoplastic stroma. (b,c,d) The numbers of GFP‐expressing cancer cells and GFP‐negative PSCs were calculated from the total cell numbers using the PSC/GFP‐SUIT‐2 proportions determined by flow cytometry. The numbers of directly co‐cultured GFP‐SUIT‐2 cells and PSCs were significantly higher than those of indirectly co‐cultured and monocultured cells (c). Co‐culture with GFP‐SUIT‐2 cells significantly enhanced the proliferation of PSCs (d). (e) The COL1 mRNA levels in co‐cultured PSCs were significantly higher than those in monocultured cells.
Notch signaling pathway in co‐cultured cells. To investigate the effects of the juxtacrine mechanism between cancer and stromal cells, we assessed the Notch signaling pathway by quantifying the mRNA levels of Notch‐1, hairy and enhancer‐of‐split homolog‐1 (Hes‐1; a downstream protein of Notch signaling), and Jagged‐1 (a ligand of Notch receptor) in both types of cells. Although Notch‐1 mRNA levels were only elevated in directly co‐cultured GFP‐SUIT‐2 and NPF‐1 cells (Fig. 6a), Hes‐1 and Jagged‐1 mRNA levels in directly co‐cultured cells were dramatically elevated compared with those in monocultured cells (Fig 6b,c).
Figure 6.
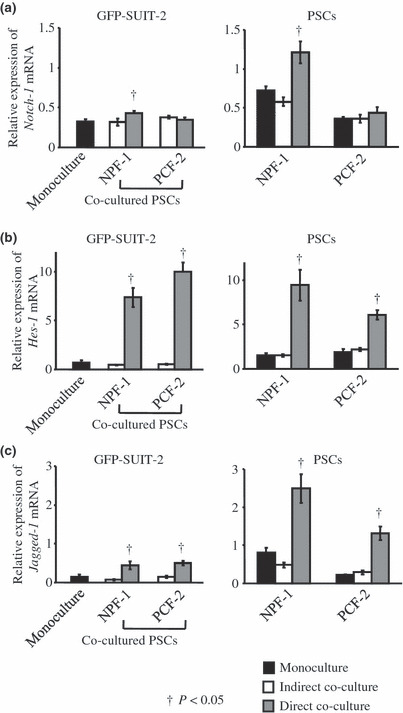
(a) The Notch‐1 levels were only elevated in directly co‐cultured GFP‐SUIT‐2 and NPF‐1 cells. (b,c) The hairy and enhancer‐of‐split homolog‐1 (Hes‐1) and Jagged‐1 mRNA levels in directly co‐cultured cells were dramatically elevated compared with those in indirectly co‐cultured and monocultured cells.
Discussion
To date, many methods have been used to evaluate the proliferation of cancer cells directly co‐cultured with stromal cells, such as flow cytometry,( 30 , 32 ) [3H]thymidine incorporation assays,( 25 ) and counting the numbers of cells or colonies under a microscope.( 23 , 31 , 32 ) In the current study, we simplified the fluorescence imaging–based proliferation assay established by Krtolica et al.,( 33 , 34 ) and developed a method that allowed the quantitative measurement of populations of GFP‐expressing cancer cells. Using this method, we found that cell growth could be monitored even when the cancer cells were directly co‐cultured with PSCs and transformed into a fibroblastoid morphology, resembling the EMT.( 43 ) Our method did not require fixation, staining, or harvesting of the cultured cells, and no complicated handling, image analysis, or use of radioisotopes was needed. Moreover, we were able to quantify populations of live GFP‐expressing cells in the same wells at specific times. The present method is therefore an easy and highly reproducible method that does not require many cells or culture plates. It is a simple and objective method, unlike in vivo co‐culture assays, and could be suitable for the evaluation of other cell–cell interactions, such as cancer cell–endothelial cell and cancer cell–inflammatory cell interactions. However, this co‐culture system needs further fundamental experiments to evaluate the relevance of co‐cultures with cancer cells under other culture conditions, because other types of cells, including endothelial cells and inflammatory cells, need to be cultured under specific culture conditions.
Recent evidence has shown that pancreatic cancer cells increase their proliferative ability when exposed to conditioned medium from human PSCs, and this effect is caused by not only inhibition of apoptosis but also increased DNA synthesis.( 13 , 14 ) In the current study, indirect co‐culture with PSCs (to examine paracrine mechanisms) also enhanced the proliferation of pancreatic cancer cells. Moreover, direct co‐culture with PSCs (which allows the evaluation of direct cell contacts, juxtacrine mechanisms, and ECMs produced by PSCs, as well as paracrine mechanisms), further accelerated the proliferative ability of pancreatic cancer cells. Samoszuk et al. ( 32 ) revealed that clonogenic growth of human breast cancer cells directly co‐cultured with serum‐activated fibroblasts was significantly enhanced compared with indirectly co‐cultured or monocultured cells. These results are consistent with our data. Meanwhile, Che et al. ( 21 ) demonstrated that direct co‐culture with Swiss 3T3 fibroblasts using collagen‐based three‐dimensional co‐culture models enhanced the invasiveness of oral epithelial cancer cells more than indirect co‐culture or monoculture. Taken together, these results suggest that the direct cell contacts involved in cancer–stromal interactions support the progression of cancer cells, in addition to the paracrine promoting effects of growth factors or chemokines.
Bachem et al. ( 1 , 15 ) demonstrated that pancreatic carcinoma cells stimulate the proliferation and matrix synthesis of PSCs via paracrine mechanisms. In the current study, we further found that both direct and indirect co‐cultures stimulated the proliferation of PSCs and increased their COL1 mRNA levels, suggesting that cancer–PSC interactions may induce desmoplasia in PDAC. Meanwhile, recent evidences have revealed that collagen type 1 increases the proliferation of pancreatic cancer cells by enhancing DNA synthesis and inhibiting apoptosis.( 4 , 6 ) Although there was no significant difference between COL1 mRNA levels in the two co‐culture systems, cancer cells may be affected more strongly by local interactions with collagen type 1 in the direct co‐culture system.
Several studies have demonstrated that activation of the Notch signaling pathway, one of the juxtacrine mechanisms, plays significant roles in the progression of pancreatic cancer.( 44 , 45 , 46 , 47 ) Binding of Notch‐1 receptor to its ligands, such as Jagged‐1, expressed on adjacent cells leads to γ‐secretase‐mediated cleavage of the intracellular domain of Notch‐1 (NIC1), which then translocates into the nucleus and results in the activation of Notch signaling.( 48 ) In the current study, we found that direct co‐culture of pancreatic cancer cells and PSCs dramatically increased the mRNA levels of Hes‐1 (a downstream protein of Notch signaling) in both cell types, suggesting that direct cell contacts activated Notch signaling. Therefore, activation of the Notch signaling pathway may play a crucial role in enhancing the proliferation of cancer cells in the direct co‐culture system.
In our preliminary study, we found that human embryonic lung fibroblast, MRC5, also enhanced proliferation of pancreatic cancer cells, induced EMT‐like morphological change (Supporting Information Fig. S2a), and activated the Notch signaling pathway (Supporting Information Fig. S2c–e) in our co‐culture systems as well as in PSCs. These findings indicates that enhancement of pancreatic cancer cell proliferation by direct co‐culture with stromal cells is not specific in stromal cells derived from the pancreas. In the current study, we found that MCF‐1 cells, a culture of myofibroblast derived from metastatic tumor of the abdominal wall, also enhanced proliferation of pancreatic cancer cells in our co‐culture systems. Therefore, cancer cells may possibly proliferate via direct interactions with stromal cells derived from other organs when the cells form metastatic tumors.
In conclusion, we have established a direct co‐culture system that enabled us to quantitatively and reproducibly evaluate GFP‐expressing cell populations, even in co‐culture with other cells. This method could be widely applied to elucidate cell–cell interactions involving not only paracrine factors, but also direct cell contacts and juxtacrine factors. Moreover, our data provide evidence that PSCs and α‐SMA‐positive stromal myofibroblasts control the proliferation of pancreatic cancer cells via tumor–stromal interactions involving direct cell contacts and juxtacrine mechanisms, as well as paracrine mechanisms. The identification of α‐SMA‐positive myofibroblast‐derived factors and clarification of their mechanisms of action are the subjects of ongoing investigations, and may lead to the development of novel therapeutic strategies directed at the PDAC microenvironment.
Supporting information
Fig. S1. (a) Propidium iodide (PI) fluorescence intensity of green fluorescent protein (GFP)‐SUIT‐2 cells. (b) The GFP fluorescence intensity was correlated with the PI fluorescence intensity (Spearman’s rank‐correlation coefficient: 0.998, P < 0.0001). (c) GFP‐SUIT‐2 cells expressed similar levels of fluorescence intensity to monocultured cells, regardless of the number of co‐cultured pancreatic stellate cells (PSCs). (c,d) Regression analysis confirmed that the fluorescence intensity of GFP‐SUIT‐2 cells was correlated with the number of cells, despite the coexistence of myofibroblasts and their morphological alterations (Spearman’s rank‐correlation coefficient: 0.993, P < 0.0001).
Fig. S2. (a) Representative microphotographs of green fluorescent protein (GFP)‐SUIT‐2 cells in monoculture (left), indirect co‐culture with MRC5 fibroblasts (center), and direct co‐culture with MRC5 fibroblasts (right). Monocultured GFP‐SUIT‐2 cells were almost round in shape, whereas co‐cultured cells exhibit a fibroblastoid morphology. (b) GFP‐expressing cancer cells and GFP‐negative MRC5 fibroblasts were isolated using a cell sorter. (c) The Notch‐1 levels were only elevated in directly co‐cultured MRC5 fibroblasts. (d,e) The hairy and enhancer‐of‐split homolog‐1 (Hes‐1) and Jagged‐1 mRNA levels in directly co‐cultured cells were dramatically elevated compared with those in indirectly co‐cultured and monocultured cells.
Please note: Wiley‐Blackwell are not responsible for the content or functionality of any supporting materials supplied by the authors. Any queries (other than missing material) should be directed to the corresponding author for the article.
Supporting info item
Supporting info item
Acknowledgments
This work was supported by a grant (no. H20‐Nanchi‐Ippan‐027) from the Ministry of Health, Labor and Welfare of Japan. H.F. is a Scientific Research Fellow of the Japan Health Sciences Foundation. This work was also supported, in part, by a Grant‐in‐Aid from the Ministry of Education, Culture, Sports, Science and Technology of Japan, and by grants from the Japanese Society of Gastroenterology and the Pancreas Research Foundation of Japan.We thank Mrs S. Sadatomi, Miss M. Sato and Miss E. Manabe (Department of Surgery and Oncology, Kyushu University Hospital, Fukuoka, Japan) for skillful examination and analysis.
References
- 1. Bachem MG, Schunemann M, Ramadani M et al. Pancreatic carcinoma cells induce fibrosis by stimulating proliferation and matrix synthesis of stellate cells. Gastroenterology 2005; 128: 907–21. [DOI] [PubMed] [Google Scholar]
- 2. Korc M. Pancreatic cancer‐associated stroma production. Am J Surg 2007; 194: S84–6. [DOI] [PMC free article] [PubMed] [Google Scholar]
- 3. Yen TW, Aardal NP, Bronner MP et al. Myofibroblasts are responsible for the desmoplastic reaction surrounding human pancreatic carcinomas. Surgery 2002; 131: 129–34. [DOI] [PubMed] [Google Scholar]
- 4. Armstrong T, Packham G, Murphy LB et al. Type I collagen promotes the malignant phenotype of pancreatic ductal adenocarcinoma. Clin Cancer Res 2004; 10: 7427–37. [DOI] [PubMed] [Google Scholar]
- 5. Crnogorac‐Jurcevic T, Efthimiou E, Capelli P et al. Gene expression profiles of pancreatic cancer and stromal desmoplasia. Oncogene 2001; 20: 7437–46. [DOI] [PubMed] [Google Scholar]
- 6. Koenig A, Mueller C, Hasel C, Adler G, Menke A. Collagen type I induces disruption of E‐cadherin‐mediated cell‐cell contacts and promotes proliferation of pancreatic carcinoma cells. Cancer Res 2006; 66: 4662–71. [DOI] [PubMed] [Google Scholar]
- 7. Mahadevan D, Von Hoff DD. Tumor–stroma interactions in pancreatic ductal adenocarcinoma. Mol Cancer Ther 2007; 6: 1186–97. [DOI] [PubMed] [Google Scholar]
- 8. Apte MV, Park S, Phillips PA et al. Desmoplastic reaction in pancreatic cancer: role of pancreatic stellate cells. Pancreas 2004; 29: 179–87. [DOI] [PubMed] [Google Scholar]
- 9. Jaskiewicz K, Nalecz A, Rzepko R, Sledzinski Z. Immunocytes and activated stellate cells in pancreatic fibrogenesis. Pancreas 2003; 26: 239–42. [DOI] [PubMed] [Google Scholar]
- 10. Lohr M, Schmidt C, Ringel J et al. Transforming growth factor‐beta1 induces desmoplasia in an experimental model of human pancreatic carcinoma. Cancer Res 2001; 61: 550–5. [PubMed] [Google Scholar]
- 11. Yoshida S, Yokota T, Ujiki M et al. Pancreatic cancer stimulates pancreatic stellate cell proliferation and TIMP‐1 production through the MAP kinase pathway. Biochem Biophys Res Commun 2004; 323: 1241–5. [DOI] [PubMed] [Google Scholar]
- 12. Haber PS, Keogh GW, Apte MV et al. Activation of pancreatic stellate cells in human and experimental pancreatic fibrosis. Am J Pathol 1999; 155: 1087–95. [DOI] [PMC free article] [PubMed] [Google Scholar]
- 13. Hwang RF, Moore T, Arumugam T et al. Cancer‐associated stromal fibroblasts promote pancreatic tumor progression. Cancer Res 2008; 68: 918–26. [DOI] [PMC free article] [PubMed] [Google Scholar]
- 14. Vonlaufen A, Joshi S, Qu C et al. Pancreatic stellate cells: partners in crime with pancreatic cancer cells. Cancer Res 2008; 68: 2085–93. [DOI] [PubMed] [Google Scholar]
- 15. Bachem MG, Zhou S, Buck K, Schneiderhan W, Siech M. Pancreatic stellate cells – role in pancreas cancer. Langenbecks Arch Surg 2008; 393: 891–900. [DOI] [PubMed] [Google Scholar]
- 16. Camps JL, Chang SM, Hsu TC et al. Fibroblast‐mediated acceleration of human epithelial tumor growth in vivo. Proc Natl Acad Sci U S A 1990; 87: 75–9. [DOI] [PMC free article] [PubMed] [Google Scholar]
- 17. Kuperwasser C, Chavarria T, Wu M et al. Reconstruction of functionally normal and malignant human breast tissues in mice. Proc Natl Acad Sci U S A 2004; 101: 4966–71. [DOI] [PMC free article] [PubMed] [Google Scholar]
- 18. Ohuchida K, Mizumoto K, Murakami M et al. Radiation to stromal fibroblasts increases invasiveness of pancreatic cancer cells through tumor–stromal interactions. Cancer Res 2004; 64: 3215–22. [DOI] [PubMed] [Google Scholar]
- 19. Verona EV, Elkahloun AG, Yang J, Bandyopadhyay A, Yeh IT, Sun LZ. Transforming growth factor‐beta signaling in prostate stromal cells supports prostate carcinoma growth by up‐regulating stromal genes related to tissue remodeling. Cancer Res 2007; 67: 5737–46. [DOI] [PubMed] [Google Scholar]
- 20. Yang G, Rosen DG, Zhang Z et al. The chemokine growth‐regulated oncogene 1 (Gro‐1) links RAS signaling to the senescence of stromal fibroblasts and ovarian tumorigenesis. Proc Natl Acad Sci U S A 2006; 103: 16472–7. [DOI] [PMC free article] [PubMed] [Google Scholar]
- 21. Che ZM, Jung TH, Choi JH et al. Collagen‐based co‐culture for invasive study on cancer cells–fibroblasts interaction. Biochem Biophys Res Commun 2006; 346: 268–75. [DOI] [PubMed] [Google Scholar]
- 22. Gudjonsson T, Ronnov‐Jessen L, Villadsen R, Bissell MJ, Petersen OW. To create the correct microenvironment: three‐dimensional heterotypic collagen assays for human breast epithelial morphogenesis and neoplasia. Methods 2003; 30: 247–55. [DOI] [PMC free article] [PubMed] [Google Scholar]
- 23. Rossi L, Reverberi D, Podesta G, Lastraioli S, Corvo R. Co‐culture with human fibroblasts increases the radiosensitivity of MCF‐7 mammary carcinoma cells in collagen gels. Int J Cancer 2000; 85: 667–73. [DOI] [PubMed] [Google Scholar]
- 24. Tanaka R, Saito T, Ashihara K, Nishimura M, Mizumoto H, Kudo R. Three‐dimensional coculture of endometrial cancer cells and fibroblasts in human placenta derived collagen sponges and expression matrix metalloproteinases in these cells. Gynecol Oncol 2003; 90: 297–304. [DOI] [PubMed] [Google Scholar]
- 25. Dong‐Le Bourhis X, Berthois Y, Millot G et al. Effect of stromal and epithelial cells derived from normal and tumorous breast tissue on the proliferation of human breast cancer cell lines in co‐culture. Int J Cancer 1997; 71: 42–8. [DOI] [PubMed] [Google Scholar]
- 26. Muerkoster S, Wegehenkel K, Arlt A et al. Tumor stroma interactions induce chemoresistance in pancreatic ductal carcinoma cells involving increased secretion and paracrine effects of nitric oxide and interleukin‐1beta. Cancer Res 2004; 64: 1331–7. [DOI] [PubMed] [Google Scholar]
- 27. Qian LW, Mizumoto K, Maehara N et al. Co‐cultivation of pancreatic cancer cells with orthotopic tumor‐derived fibroblasts: fibroblasts stimulate tumor cell invasion via HGF secretion whereas cancer cells exert a minor regulative effect on fibroblasts HGF production. Cancer Lett 2003; 190: 105–12. [DOI] [PubMed] [Google Scholar]
- 28. Sato N, Fukushima N, Maehara N et al. SPARC/osteonectin is a frequent target for aberrant methylation in pancreatic adenocarcinoma and a mediator of tumor–stromal interactions. Oncogene 2003; 22: 5021–30. [DOI] [PubMed] [Google Scholar]
- 29. Sato N, Maehara N, Goggins M. Gene expression profiling of tumor–stromal interactions between pancreatic cancer cells and stromal fibroblasts. Cancer Res 2004; 64: 6950–6. [DOI] [PubMed] [Google Scholar]
- 30. Bavik C, Coleman I, Dean JP, Knudsen B, Plymate S, Nelson PS. The gene expression program of prostate fibroblast senescence modulates neoplastic epithelial cell proliferation through paracrine mechanisms. Cancer Res 2006; 66: 794–802. [DOI] [PubMed] [Google Scholar]
- 31. Kummermehr J, Malinen E, Freykowski S, Sund M, Trott KR. The influence of autologous tumor fibroblasts on the radiosensitivity of squamous cell carcinoma megacolonies. Int J Radiat Oncol Biol Phys 2001; 50: 229–37. [DOI] [PubMed] [Google Scholar]
- 32. Samoszuk M, Tan J, Chorn G. Clonogenic growth of human breast cancer cells co‐cultured in direct contact with serum‐activated fibroblasts. Breast Cancer Res 2005; 7: R274–83. [DOI] [PMC free article] [PubMed] [Google Scholar]
- 33. Krtolica A, Ortiz de Solorzano C, Lockett S, Campisi J. Quantification of epithelial cells in coculture with fibroblasts by fluorescence image analysis. Cytometry 2002; 49: 73–82. [DOI] [PubMed] [Google Scholar]
- 34. Krtolica A, Parrinello S, Lockett S, Desprez PY, Campisi J. Senescent fibroblasts promote epithelial cell growth and tumorigenesis: a link between cancer and aging. Proc Natl Acad Sci U S A 2001; 98: 12072–7. [DOI] [PMC free article] [PubMed] [Google Scholar]
- 35. Gerena‐Lopez Y, Nolan J, Wang L, Gaigalas A, Schwartz A, Fernandez‐Repollet E. Quantification of EGFP expression on Molt‐4 T cells using calibration standards. Cytometry A 2004; 60: 21–8. [DOI] [PubMed] [Google Scholar]
- 36. Gervaix A, West D, Leoni LM, Richman DD, Wong‐Staal F, Corbeil J. A new reporter cell line to monitor HIV infection and drug susceptibility in vitro. Proc Natl Acad Sci U S A 1997; 94: 4653–8. [DOI] [PMC free article] [PubMed] [Google Scholar]
- 37. Hunt L, Batard P, Jordan M, Wurm FM. Fluorescent proteins in animal cells for process development: optimization of sodium butyrate treatment as an example. Biotechnol Bioeng 2002; 77: 528–37. [DOI] [PubMed] [Google Scholar]
- 38. Hunt L, Jordan M, De Jesus M, Wurm FM. GFP‐expressing mammalian cells for fast, sensitive, noninvasive cell growth assessment in a kinetic mode. Biotechnol Bioeng 1999; 65: 201–5. [DOI] [PubMed] [Google Scholar]
- 39. Bachem MG, Schneider E, Gross H et al. Identification, culture, and characterization of pancreatic stellate cells in rats and humans. Gastroenterology 1998; 115: 421–32. [DOI] [PubMed] [Google Scholar]
- 40. Zhang L, Mizumoto K, Sato N et al. Quantitative determination of apoptotic death in cultured human pancreatic cancer cells by propidium iodide and digitonin. Cancer Lett 1999; 142: 129–37. [DOI] [PubMed] [Google Scholar]
- 41. Ohuchida K, Mizumoto K, Ogura Y et al. Quantitative assessment of telomerase activity and human telomerase reverse transcriptase messenger RNA levels in pancreatic juice samples for the diagnosis of pancreatic cancer. Clin Cancer Res 2005; 11: 2285–92. [DOI] [PubMed] [Google Scholar]
- 42. Erkan M, Kleeff J, Gorbachevski A et al. Periostin creates a tumor‐supportive microenvironment in the pancreas by sustaining fibrogenic stellate cell activity. Gastroenterology 2007; 132: 1447–64. [DOI] [PubMed] [Google Scholar]
- 43. Grunert S, Jechlinger M, Beung H. Diverse cellular and molecular mechanisms contribute to epithelial plasticity and metastasis. Nature Rev Mol Cell Biol 2003; 4: 657–65. [DOI] [PubMed] [Google Scholar]
- 44. Mullendore ME, Koorstra JB, Li YM et al. Ligand‐dependent Notch signaling is involved in tumor initiation and tumor maintenance in pancreatic cancer. Clin Cancer Res 2009; 15: 2291–301. [DOI] [PMC free article] [PubMed] [Google Scholar]
- 45. Plentz R, Park JS, Rhim AD et al. Inhibition of gamma‐secretase activity inhibits tumor progression in a mouse model of pancreatic ductal adenocarcinoma. Gastroenterology 2009; 136: 1741–9. e6. [DOI] [PMC free article] [PubMed] [Google Scholar]
- 46. Wang Z, Banerjee S, Li Y, Rahman KM, Zhang Y, Sarkar FH. Down‐regulation of notch‐1 inhibits invasion by inactivation of nuclear factor‐kappaB, vascular endothelial growth factor, and matrix metalloproteinase‐9 in pancreatic cancer cells. Cancer Res 2006; 66: 2778–84. [DOI] [PubMed] [Google Scholar]
- 47. Wang Z, Zhang Y, Banerjee S, Li Y, Sarkar FH. Notch‐1 down‐regulation by curcumin is associated with the inhibition of cell growth and the induction of apoptosis in pancreatic cancer cells. Cancer 2006; 106: 2503–13. [DOI] [PubMed] [Google Scholar]
- 48. Liu T, Hu B, Choi YY et al. Notch1 signaling in FIZZ1 induction of myofibroblast differentiation. Am J Pathol 2009; 174: 1745–55. [DOI] [PMC free article] [PubMed] [Google Scholar]
Associated Data
This section collects any data citations, data availability statements, or supplementary materials included in this article.
Supplementary Materials
Fig. S1. (a) Propidium iodide (PI) fluorescence intensity of green fluorescent protein (GFP)‐SUIT‐2 cells. (b) The GFP fluorescence intensity was correlated with the PI fluorescence intensity (Spearman’s rank‐correlation coefficient: 0.998, P < 0.0001). (c) GFP‐SUIT‐2 cells expressed similar levels of fluorescence intensity to monocultured cells, regardless of the number of co‐cultured pancreatic stellate cells (PSCs). (c,d) Regression analysis confirmed that the fluorescence intensity of GFP‐SUIT‐2 cells was correlated with the number of cells, despite the coexistence of myofibroblasts and their morphological alterations (Spearman’s rank‐correlation coefficient: 0.993, P < 0.0001).
Fig. S2. (a) Representative microphotographs of green fluorescent protein (GFP)‐SUIT‐2 cells in monoculture (left), indirect co‐culture with MRC5 fibroblasts (center), and direct co‐culture with MRC5 fibroblasts (right). Monocultured GFP‐SUIT‐2 cells were almost round in shape, whereas co‐cultured cells exhibit a fibroblastoid morphology. (b) GFP‐expressing cancer cells and GFP‐negative MRC5 fibroblasts were isolated using a cell sorter. (c) The Notch‐1 levels were only elevated in directly co‐cultured MRC5 fibroblasts. (d,e) The hairy and enhancer‐of‐split homolog‐1 (Hes‐1) and Jagged‐1 mRNA levels in directly co‐cultured cells were dramatically elevated compared with those in indirectly co‐cultured and monocultured cells.
Please note: Wiley‐Blackwell are not responsible for the content or functionality of any supporting materials supplied by the authors. Any queries (other than missing material) should be directed to the corresponding author for the article.
Supporting info item
Supporting info item