

Abstract
Lymph node metastasis (LNM) is the most important prognostic factor in patients undergoing surgical resection of pancreatic ductal adenocarcinoma (PDAC). In this study, we aimed to identify molecular markers associated with LNM in PDAC using genome‐wide expression profiling. In this study, laser microdissection and genome‐wide transcriptional profiling were used to identify genes that were differentially expressed between PDAC cells with and without LNM obtained from 20 patients with PDAC. Immunohistochemical staining was used to confirm the clinical significance of these markers in an additional validation set of 43 patients. In the results, microarray profiling identified 46 genes that were differently expressed between PDAC with and without LNM with certain significance. Four of these biomarkers were validated by immunohistochemical staining for association with LNM in PDAC in an additional validation set of patients. In 63 patients with PDAC, significant LNM predictors in PDAC elucidated from multivariate analysis were low expression of activating enhancer binding protein 2 (AP2α) (P = 0.012) and high expression of mucin 17 (MUC17) (P = 0.0192). Furthermore, multivariate analysis revealed that AP2α‐low expression and MUC17‐high expression are independent prognostic factors for poor overall survival (P = 0.0012, 0.0001, respectively). In conclusion, AP2α and MUC17 were independent markers associated with LNM of PDAC. These two markers were also associated with survival in patients with resected PDAC. We demonstrate that AP2α and MUC17 may serve as potential prognostic molecular markers for LNM in patients with PDAC. (Cancer Sci 2009)
Pancreatic ductal adenocarcinoma (PDAC) has the worst survival rate of all cancers, with a 5‐year survival rate of <5%. To date, the only curative treatment for PDAC is surgery, but <20% of patients who undergo surgery are alive after 5 years.( 1 , 2 ) Numerous studies have demonstrated that the presence of LNM is the most important prognostic factor for patients undergoing surgery for PDAC.( 1 , 2 , 3 , 4 , 5 ) Understanding the molecular events involved in the development of LNM in PDAC could aid researchers in the identification of biologic determinants, and will aid in the identification of diagnostic biomarkers and development of more effective therapies.
Gene expression profiles provide a lot of important information about the molecular characteristics of the cancers and can be used to distinguish related cancer subtypes. Recently, several studies have used gene expression profiling technologies to identify differentially expressed genes in PDAC compared with normal pancreas.( 6 , 7 , 8 ) In the present study, we focused on and identified the genes associated with LNM, which is the most important prognostic factor in patients who undergo surgical resection for PDAC. Gene identification was accomplished by comparison of gene expression profiles between PDAC with and without LNM.
Most microarray studies of PDAC were performed in cell lines partly representing the whole character of PDAC or the whole resected tissues of pancreatic cancer, which contained a number of different cell types including normal ductal, acinar, islet, inflammatory, and nerve cells, because of the characteristics of PDAC.( 6 , 9 , 10 ) Therefore, the expression profiles for the whole resected tissues represent characteristics of both tumor and adjacent non‐neoplastic cells. In this study, we performed gene expression profiling using pure PDAC cells obtained selectively by microdissection to elucidate molecular profiles of PDAC more accurately.( 11 , 12 )
In this study, we identified the genes associated with LNM in PDAC using gene expression profiling, and validated their usefulness as diagnostic and prognostic biomarkers for PDAC by protein expression analysis using immunohistochemical staining.
Materials and Methods
Patients and tissue samples. The ethical committee of the chamber of physicians in the Center Institute of Japanese Foundation for Cancer Research Hospital and Wakayama Medical University Hospital approved this study. Informed consent was obtained from all patients before their inclusion in the study. Our study population consisted of 63 patients with resected PDAC who had undergone radical operations between January 2004 and May 2007, had available stored frozen tissue blocks, and had tumor‐free resection margins on microscopic examination of the surgical specimen. None of the patients had received neoadjuvant chemotherapy or radiation therapy before surgery. The patients characteristics were: males/female = 25/38; age range, 49–87 years (mean, 70 years). The tumors were located in head of the pancreas in 45 patients and in body or tail in 18 patients, and 19 patients had tumors of more than 4.0 cm whereas 44 patients had tumors of <4.0 cm. Histologically, there were 25 patients with well differentiated adenocarcinoma, 27 with moderate, and 11 with poor differentiated adenocarcinoma. The TNM staging criteria of the International Union Against Cancer (UICC) (6th edition) were used for histologic classification:( 13 ) T1 in two patients, T2 in 11 patients, and T3 in 50 patients. The patients included two with stage IA, seven with stage IB, 19 with stage IIA, 19 with stage IIB, and 16 with stage IV. Among them, 35 patients had histologically confirmed LNM, and 28 had no LNM. Median follow‐up duration after surgery was 475 days (range, 18–1792 days).
Immediately after surgical resection, tissue samples including tumor and adjacent normal cells were embedded in Tissue‐Tek OCT compound (Sakura Finetek, Torrance, CA, USA) by freezing tissue blocks in liquid nitrogen; the blocks were then stored at −143°C until further processing.
Laser microdissection and RNA extraction. The specimens of PDAC were cut into 9‐μm sections at −20°C with the use of the Leica cryostat (model 3050S; Leica, Tokyo, Japan). We prepared more than 30 specimens of PDAC, ranging from 30 to 120 specimens, for gene expression profiling. Specimens containing only cancer cells of the pancreas were then obtained from the primary tumors by laser microdissection. Total RNA was extracted from the harvest cells with the RNeasy Micro Kit (Qiagen, Hilden, Germany). The concentration of each total RNA sample was measured with a Nanodrop ND‐1000 spectrophotometer (Nanodrop Technologies, Wilmington, DE, USA). RNA integrity was determined by capillary electrophoresis with an Agilent 2100 Bioanalyzer (Agilent, Santa Clara, CA, USA), and the extracted RNA was accepted for experiments if the RNA integrity number was over 7.0. Eventually, we selected 20 PDAC (59%) among consecutive 34 surgical resections, because the RNA integrity number of PDAC of 14 other patients was <7.0. The pathological characteristics of the 20 patients with PDAC were: 10 patients with well differentiated adenocarcinoma, nine with moderate, and one with poor differentiated adenocarcinoma. Two patients had tumors of more than 4.0 cm and 18 patients had tumors of <4.0 cm. Among them, 11 patients had histologically confirmed LNM, and nine had no LNM. According to UICC TNM staging, the 20 patients included three with stage IB, six with stage IIA, four with stage IIB, and seven with stage IV.
Gene expression profile. Gene expression of 20 RNA samples (11 positive and nine negative LNM patients) of pancreatic cancer cells was analyzed with Human Genome U133 Plus 2.0 GeneChips (Affymetrix, Santa Clara, CA, USA). The manufacturer’s instructions for protocols and use of reagents for hybridization, washing, and staining were followed. Briefly, 100 ng of total RNA of each sample was reverse transcribed with a poly(T) primer containing a T7 promoter, and the cDNA was generated as a double strand. An in vitro transcription was performed to produce unlabeled cRNA. Next, first‐strand cDNA was produced from a random primed reaction. cDNA was converted to a double strand in a reaction with a poly(T) primer containing a T7 promoter. Finally, an in vitro transcription was performed with biotinylated ribonucleotides to produce biotin‐labeled cRNA. Labeled cRNA was then hybridized with the GeneChips for 16 h at 45°C. The chips were washed and stained with streptavidin–phycoerythrin with the use of an Affymetrix FS‐450 fluidics station. Data were collected with an Affymetrix GeneChip Scanner 3000. The CEL files were obtained with Affymetrix Suite 5.0 software; then the array data was imported into DNA‐Chip Analyzer (dChip, http://www.dchip.org) for high‐level analysis.
Immunohistochemistry. The choice of antibody was empirical and was based on availability and suitability for frozen tissues. Each antibody was titrated three to five different dilutions, according to the manufacturer’s recommendation. If the signal‐to‐background ratio was not acceptable for the dilution tested, the incubation time was readjusted. First, 9‐μm cryosections were fixed in 4% paraformaldehyde solution for 10 minutes, and then washed in 1% PBS. Endogenous peroxidase activity was blocked with 3% hydrogen peroxide in methanol, and nonspecific binding sites were blocked with 10% normal rabbit or goat serum. Primary antibodies diluted in PBS as follows: DOK7 (1:100, rabbit polyclonal; Santa Cruz Biotechnology, Santa Cruz, CA, USA), AP2α (1:50, mouse monoclonal; Santa Cruz Biotechnology), FOXL1 (1:1000, rabbit polyclonal; CeMines, Evergreen, CO, USA), LI‐cadherin (1:150, goat polyclonal; Santa Cruz Biotechnology), Granzyme A (1:50, mouse monoclonal; Abcam, Cambridge, UK): MUC17 (1:150, goat polyclonal; Santa Cruz Biotechnology), C4BPB (1:25, goat polyclonal; Santa Cruz Biotechnology), XK (1:100, goat polyclonal; Santa Cruz Biotechnology), and LSD1 (1:1000, mouse monoclonal; Abcam). Diluted primary antibodies were added and samples were incubated overnight at 4°C. Antibody binding was then immunodetected with the avidin–biotin–peroxidase complex, as described by the supplier (Nichirei, Tokyo, Japan). Finally, the reaction product was demonstrated by a DAB substrate, and then counterstained with hematoxylin, dehydrated with ethanol, and fixed with xylene. Immunostains were scored semiquantitatively by two independent pathologists blinded to clinical and pathologic data.
Statistical analysis. The association between lymph node status and each protein’s immunoreactivites and clinicopathological characteristics was tested by means of a χ2‐test or the Mann–Whitney U‐test. Logistic regression was performed for multivariate analysis of parameters potentially associated with LNM. Overall survival was defined as the time interval between the date of resection and the date of death from any cause, or censoring based on the date of last contact. Survival curves were calculated by the Kaplan–Meier method and then compared by the log‐rank test. Cox’s proportional hazards regression model with stepwise analysis was used to analyze the independent prognostic factors. Statistical procedures were performed with SPSS version 17.0 (SPSS, Chicago, IL, USA). A P‐value <0.05 was considered statistically significant.
Results
Identification of transcriptional biomarkers for PDAC with LNM. Using microdissection, we obtained cancer tissues from surgical specimens from 11 PDAC patients with LNM and from nine without LNM. To identify transcriptional gene expression changes associated with lymph node status, we performed microarray profiling of PDAC using Human Genome U133 Plus 2.0 GeneChips. Genes with altered expression levels were determined by the comparison of PDACs with and without LNM on the basis of the following criteria: (i) a 1.5‐fold or greater change in the expression levels between the means of the two groups; (ii) a >100 of absolute difference between the means of the expression levels of the two groups; and (iii) a P‐value <0.05. From the results, the 46 genes expressed differentially between two groups were selected, including 17 genes that were down‐regulated, whereas 29 were up‐regulated in the PDAC with LNM group (Table 1).
Table 1.
Underexpressed and overexpressed genes in pancreatic ductal adenocarcinoma with lymph node metastasis identified by expression profile
| Probe ID | Gene name | Fold |
|---|---|---|
| A. Underexpressed genes in pancreatic ductal adenocarcinoma with lymph node metastasis | ||
| 204124_at | Solute carrier family 34 (sodium phosphate), member 2 | −5.27 |
| 1559072_a_at | Leucine rich repeat containing 62 | −3.84 |
| 203404_at | Armadillo repeat containing, X‐linkedn2 | −3.36 |
| 208063_s_at | Calpain 9 | −3.32 |
| 229041_s_at | Homo specimens, clone IMAGE:5205388, mRNA | −3.11 |
| 212776_s_at | Obscuring‐like 1 | −2.90 |
| 240633_at | Docking protein 7 (DOK7) | −2.77 |
| 205129_at | Nucleophosmin/nucleoplasmin, 3 | −2.74 |
| 226344_at | Zinc finger, matrin type 1 | −2.74 |
| 204284_at | Protein phosphatase 1, regulatory (inhibitor) subunit 3C | −2.65 |
| 205541_s_at | G1 to S phase trandition 2 | −2.63 |
| 221869_at | Zinc finger protein 512B | −2.56 |
| 55872_at | Zinc finger protein 512B | −2.53 |
| 212775_at | Obscuring‐like 1 | −2.49 |
| 238751_at | CDNA clone IMAGE:4791597 | −2.40 |
| 204653_at | Transcription factor AP‐2 alpha (activating enhancer binding protein 2 alpha) (AP2α) | −2.39 |
| 228384_s_at | Chromosome 10 open reading frame 33 | −2.38 |
| 243409_at | Forkhead box L1 (FOXL1) | −2.09 |
| 225484_at | Testis specific, 14 | −1.99 |
| 225485_at | Testis specific, 14 | −1.93 |
| B. Overexpressed genes in pancreatic ductal adenocarcinoma with lymph node metastasis | ||
| 220639_at | Transmembrane | 25.16 |
| 1553296_at | G protein‐coupled receptor 128 | 6.86 |
| 228974_at | CDNA FLJ42233 fis, clone THYMU3000420 | 5.56 |
| 209847_at | Cadherin 17, LI cadherin (liver–intestine) (LI cadherin) | 5.17 |
| 204607_at | 3‐hydroxy‐3‐methylgultalyl‐Coenzyme A synthase 2 (mitochondrial) | 4.77 |
| 224355_s_at | Membrane‐spanning 4‐domains, subfamily A, member 8B | 4.72 |
| 207259_at | Chromosome 17 open reading frame 73 | 4.29 |
| 205488_at | Granzyme A | 4.24 |
| 232321_at | Mucin 17, cell surface associated (MUC17) | 4.19 |
| 240110_at | 3‐hydroxy‐3‐ methylgultalyl‐Coenzyme A synthase 2 (mitochondrial) | 4.09 |
| 223303_at | UNC‐112 related protein 2 | 4.05 |
| 235301_at | KIAA 1324‐like | 3.78 |
| 206084_at | Protein thyrosine phosphatase, receptor type, R | 3.54 |
| 244771_at | Kelch domain containing 6 | 3.44 |
| 242447_at | Hypothetical gene supported by AK091454 | 3.44 |
| 243774_at | Mucin 20, cell surface associated | 3.38 |
| 220421_at | Butyrophilin‐like 8 similar to Butylphilin‐like protein 8 precursor | 3.24 |
| 208029_s_at | Complement component 4 binding protein beta (C4BPB) | 3.04 |
| 239294_at | Transcribed locus | 3.01 |
| 206698_at | X‐linked Kx blood group (McLeod syndrome) (XK) | 2.96 |
| 210675_s_at | Protein thyrosine phosphatase, receptor type, R | 2.89 |
| 223960_s_at | Chromosome 16 open reading frame 5 | 2.86 |
| 218510_x_at | Family with sequence similarity 134, member B | 2.81 |
| 208170_s_at | Tripartite motif‐containing 31 | 2.71 |
| 231941_s_at | Mucin 20, cell surface associated | 2.59 |
| 224480_s_at | Lung cancer metastasis‐associated protein | 2.47 |
| 209668_x_at | Carboxylesterase 2 (intensine, liver) | 2.40 |
| 238032_at | Transcribed locus | 2.29 |
| 235256_s_at | Galactose mutarotase (aldose 1‐epimerase) | 2.28 |
| 1555897_at | Amine oxidase (flavin containing) domain 2 (LSD1) | 2.09 |
| 238851_at | Ankyrin repeat domain 13A | 2.07 |
Using the selected 46 genes, we performed hierarchical clustering on the samples from 20 patients by Pearson’s correlation distance metric and average linkage. In the results, the dendrogram contained two main branches, one of which contained only PDAC samples with LNM; the other branch contained all PDAC samples without LNM and two with LNM, suggesting the potential significance of these genes as transcriptional biomarkers for PDAC with LNM (Fig. 1).
Figure 1.

Supervised hierarchical clustering of pancreatic ductal adenocarcinoma with and without lymph node metastasis using the selected 46 genes expressed differentially between two groups. Red, overexpressed genes; blue, underexpressed genes. LNM (+), positive lymph node metastasis; LNM (−), negative lymph node metastasis.
Evaluation of biomarker candidate gene product by immunohistochemical analysis. First, to validate the data obtained by transcriptional gene expression profile at the protein level, we investigated the expression of nine gene products (DOK7, AP2α, FOXL1, LI‐cadherin, Granzyme A, MUC17, C4BPB, XK, and LSD1) for which antibodies were found to be available by preliminary immunohistochemical screenings. Immunoreactivities of DOK7, LI‐cadherin, MUC17, and XK were located in the plasma membrane; those of AP2α, FOXL1, and LSD1 were located in the nucleus; and those of Granzyme A and C4BPB were located in the cytoplasm. We performed immunohistochemical analysis of these nine genes identified by expression analysis in samples from 20 PDAC patients, which were used in expression profiling (training set). FOXL1 and LSD1 proteins were expressed in more than 95% of tumor nuclei in all 20 samples, showing no significant difference between the two groups; therefore, these proteins were excluded as biomarker candidates. The results of the immunohistochemical staining of the remaining seven gene products were evaluated. The percentage of positively stained tumor nuclei (AP2α) was scored as follows: score 0, <10%; score 1, ≧10% to 20%; score 2, ≧20% to 50%; score 3, ≧50%. The intensity and percentage of positively stained tumor membrane or cytoplasm (DOK7, LI‐cadherin, Granzyme A, MUC17, C4BPB, and XK) were as follows: score 0, stain, <10%; score 1, weak stain, ≧10% to 50%; score 2, weak stain, ≧50%; or strong stain, ≧10% to 50%; score 3, strong stain, ≧50%. We calculated the accuracy for lymph node status by immunohistochemical staining intensities of each gene product using all available cut‐off points (i.e. score 0 vs 1, 2, 3; score 0, 1 vs 2, 3; score 0, 1, 2 vs 3) in the training set. Then, as shown in Table 2, the binarization of score data for these seven markers was performed as ‘‘low expression’’versus‘‘high expression’’ at the binary score cut‐off points at which the accuracy value was the highest in the training set.( 14 )
Table 2.
Accuracy for lymph node metastasis in pancreatic ductal adenocarcinoma by immunohistochemical staining intensities of 7 genes using all available cut‐off points in the training set (n = 20)
| Marker | Accuracy in scoring criteria | ||
|---|---|---|---|
| Score 0 vs 1, 2, 3 | Score 0, 1 vs 2, 3 | Score 0, 1, 2 vs 3 | |
| DOK7 | 75% | 65% | 55% |
| AP2α | 60% | 65% | 85% |
| LI‐cadherin | 85% | 85% | 70% |
| Granzyme A | 55% | 65% | 75% |
| MUC17 | 95% | 85% | 70% |
| C4BPB | 80% | 70% | 70% |
| XK | 60% | 75% | 70% |
AP2α, activating enhancer binding protein 2; C4BPB, complement component 4 binding protein, beta; DOK7, docking protein 7; LI cadherin, liver–intestine cadherin; MUC17, mucin 17; XK, X‐linked Kx blood group.
Next, immunohistochemical analysis was also performed in other samples from 43 patients including 24 patients with LNM and 19 patients without LNM in PDAC for further confirmation (validation set). We compared the immunohistochemical staining intensities of each gene product in PDAC between with and without LNM. For protein expression of AP2α, LI‐cadherin, MUC17, and XK, immunohistochemical analysis resulted in significant differences between PDAC with and without LNM in both training and validation sets (Table 3). The expression of these four marker proteins was significantly related to lymph node status, which was consistent with the results of transcriptional expression profiling, and moreover, these four marker proteins were only expressed in PDAC but not in normal pancreas tissues (Fig. 2).
Table 3.
Immunohistochemical analysis between pancreatic ductal adenocarcinoma patients with and without lymph node metastasis
| Marker | Lymph node metastasis (±) vs (−) | ||
|---|---|---|---|
| Training set (n = 20) | Validation set (n = 43) | ||
| P‐values | P‐values | Accuracy (%) | |
| DOK7 | 0.0241 | 0.1073 | 63 |
| AP2α | 0.0012 | <0.0001 | 81 |
| LI cadherin | 0.0017 | 0.0046 | 70 |
| Granzyme A | 0.0277 | 0.1386 | 61 |
| MUC17 | <0.0001 | 0.0005 | 74 |
| C4BPB | 0.0030 | 0.1434 | 53 |
| XK | 0.0171 | 0.0223 | 91 |
AP2α, activating enhancer binding protein 2; C4BPB, complement component 4 binding protein, beta; DOK7, docking protein 7; LI cadherin, liver–intestine cadherin; MUC17, mucin 17; XK, X‐linked Kx blood group.
Figure 2.

Immunohistochemical staining of four genes associated with lymph node metastasis in pancreatic ductal adenocarcinoma patients (A–D). Activating enhancer binding protein 2 (AP2α) expressed in nucleus of pancreatic cancer cells (A). Liver–intestine cadherin (LI‐cadherin) (B), mucin 17 (MUC17) (C), and X‐linked Kx blood group (XK) (D) expressed in membrane of pancreatic cancer cells.
Factors related to LNM. The median number of lymph nodes examined was 21 (range, 3–63). There were no significant differences concerning to the number of lymph nodes examined between the patients with LNM and without LNM (median, 25 vs 21.5; P = 0.0617).
The univariate analysis for 63 patients with PDAC indicated that LNM was significantly higher for female patients (P = 0.0113) and patients with T3 or 4 disease (P = 0.0435), and for PDAC with low expression of AP2α (P < 0.0001), or with high expression of LI‐cadherin (P < 0.0001), MUC17 (P < 0.0001), and XK (P = 0.0013) (Table 4). On multivariate analysis, however, expression of AP2α and MUC17 was shown to be the only significant independent factors associated with LNM of PDAC (Table 4).
Table 4.
Univariate and multivariate analysis of factors associated with lymph node metastasis in pancreatic ductal adenocarcinoma (n = 63)
| Factors ratio | Lymph node metastasis (−) | Lymph node metastasis (±) | Univariate analysis | Multivariate analysis | ||
|---|---|---|---|---|---|---|
| No | % | No. | % | P‐values | P‐values, odds ratio (95% CI) | |
| Clinicopathological features | ||||||
| Age | ||||||
| ≧70 | 15 | 54 | 19 | 54 | 0.9549 | 0.2642 |
| <70 | 13 | 46 | 16 | 46 | ||
| Sex | ||||||
| Male | 16 | 57 | 9 | 26 | 0.0113 | 0.905 |
| Female | 12 | 43 | 26 | 74 | ||
| Location of tumor | ||||||
| Head | 18 | 64 | 27 | 77 | 0.2617 | 0.2038 |
| Body and/or tail | 10 | 36 | 8 | 23 | ||
| Tumor size (cm) | ||||||
| ≧4 | 8 | 29 | 11 | 31 | 0.8060 | 0.3607 |
| <4 | 20 | 71 | 24 | 69 | ||
| T stage† | ||||||
| T1/2 | 9 | 32 | 4 | 11 | 0.0435 | 0.4889 |
| T3/4 | 19 | 68 | 31 | 89 | ||
| Differentiation | ||||||
| Well/moderate | 24 | 86 | 30 | 86 | >0.9999 | 0.8649 |
| Poor | 4 | 14 | 5 | 14 | ||
| Biomarkers | ||||||
| AP2α | ||||||
| Low expression 20.9 (1.95–223) | 19 | 68 | 2 | 6 | <0.0001 | 0.0120 |
| High expression | 9 | 32 | 33 | 94 | ||
| LI‐cadherin | ||||||
| Low expression | 4 | 14 | 23 | 66 | <0.0001 | 0.0650 |
| High expression | 24 | 86 | 12 | 34 | ||
| MUC17 | ||||||
| Low expression 12.2 (1.50–98.5) | 3 | 11 | 26 | 74 | <0.0001 | 0.0192 |
| High expression | 25 | 89 | 9 | 26 | ||
| XK | ||||||
| Low expression | 7 | 25 | 23 | 66 | 0.0013 | 0.9867 |
| High expression | 21 | 75 | 12 | 34 | ||
†UICC on TNM staging criteria, 6th edition.( 12 ) AP2α, activating enhancer binding protein 2; C4BPB, complement component 4 binding protein, beta; CI, confidence interval; DOK7, docking protein 7; LI cadherin, liver–intestine cadherin; moderate, moderately differentiated adenocarcinoma; MUC17, mucin 17; poor, poorly differentiated adenocarcinoma; well, well‐differentiated adenocarcinoma; XK, X‐linked Kx blood group.
Furthermore, for the patients with LNM, both the metastatic lymph node number and the lymph node ratio, determined by dividing the number of lymph node metastasis by the total number of examined lymph nodes, were significantly higher in patients with MUC17‐high expression than in patients with MUC17‐low expression (metastatic lymph node number, 4 vs 1, P = 0.0027; lymph node ratio, 0.16 vs 0.06, P = 0.0062). However, there were no different significances between those for patients with AP2α‐low expression and with AP2α‐high expression.
Expression of molecular markers in metastatic lymph node tissues from PDAC. Protein expression of AP2α, LI‐cadherin, MUC17, and XK in 11 metastatic lymph node tissue samples of PDAC patients was examined by immunohistochemical staining. Among 11 metastatic lymph node tissues of PDAC, low expression of AP2α was shown in 11 (100%) metastatic lymph nodes, and high expression of LI‐cadherin, MUC17, and XK was shown in eight (73%), 11 (100%), and 11 (100%), respectively (Fig. 3).
Figure 3.

Immunohistochemical staining in metastatic lymph node tissues from pancreatic ductal adenocarcinoma (A–C). High expression of liver–intestine cadherin (LI‐cadherin) (A), mucin 17 (MUC17) (B), and X‐linked Kx blood group (XK) (C) are shown in metastatic adenocarcinoma in lymph node.
Prognostic factor for patients with PDAC. The overall survival period of patients without LNM (n = 28) was better than that of patients with LNM (n = 35) (median, 844 vs 470 days, P = 0.0174, log‐rank test; Fig. 4A). The survival of patients with AP2α‐low expression was significantly worse than for those with AP2α‐high expression (P = 0.0015, log‐rank test; Fig. 4B). In addition, the survival of patients with MUC17‐high expression was significantly worse than for those with MUC17‐low expression (median, 451 vs 567 days, P = 0.0368, log‐rank test; Fig. 4C). In the combined evaluation of AP2α and MUC17 expression, patients with AP2α‐low and MUC17‐high expression had a worse survival than those with AP2α‐high and MUC17‐low expression; a significant difference for survival was found between the two groups (P = 0.0009, log‐rank test; Fig. 4D).
Figure 4.
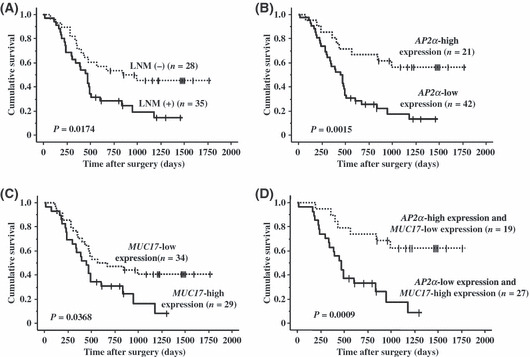
(A) Overall survival (OS) without lymph node metastasis was better (median, 844 vs 470 days). (B) OS with AP2α‐low expression was worse than that of high expression. (C) OS with MUC17‐high expression was worse than that of low expression (median, 451 vs 567 days). (D) OS with AP2α‐low and MUC17‐high expression was worse than that of AP2α‐high and MUC17‐low expression. LNM (+), positive lymph node metastasis; LNM (−), negative lymph node metastasis.
Multivariate analysis with factors proven to be significant in the univariate analysis revealed that poor differentiation, AP2α‐low expression, MUC17‐high expression, and AP2α‐low and MUC17‐high expression were independent prognostic factors for poor overall survival (Table 5).
Table 5.
Multivariate analysis using Cox’s proportional hazards regression model to determine prognostic parameters in patients with pancreatic ductal adenocarcinoma (n = 63)
| Factors | P‐values | Relative risk | 95% CI |
|---|---|---|---|
| Lymph node status | 0.6489 | 0.342 | 0.342–1.950 |
| Histologic differentiation | 0.0037 | 1.435 | 1.435–6.415 |
| AP2α‐low expression | 0.0012 | 5.412 | 1.944–15.06 |
| MUC17‐high expression | 0.0001 | 42.07 | 6.355–278.5 |
| AP2α‐low/MUC17‐high expression | <0.0001 | 46.57 | 6.953–312.0 |
AP2α, activating enhancer binding protein 2; CI, confidence interval; MUC17, mucin 17; poor, poorly differentiated adenocarcinoma.
Discussion
Recent clinical studies have revealed that the most important prognostic factor in PDAC is the presence of LNM in patients with PDAC who have undergone surgery.( 1 , 2 , 3 , 4 , 5 ) In the post‐genomic era, the search for novel prognostic and therapeutic targets for PDAC has been extensively performed;( 6 , 7 , 8 , 15 ) however, there remain no effective molecular markers of clinical utility in PDAC. In this study, we focused on and identified specific genes that have characteristics of lymphatic metastasis in PDAC, and that may be used as diagnostic and prognostic markers.
Some large studies using genome‐wide expression profiling revealed that metastases of human cancer arose from primary cancer tissues in which the vast majority of cancer cells had already obtained the ability to metastasize,( 16 , 17 , 18 ) suggesting that comparison between primary pancreatic cancer cells with and without LNM by expression profiling could lead to identifying the genes associated with LNM in PDAC, because the differences of gene expression between PDAC with and without LNM depend on the differences of biological nature of the tumor, but not the stage of tumor progression. Therefore, we decided to identify the genes related to LNM using the primary tissues of PDAC. Some studies using gene expression profiling have assayed and described the data by using the whole tissues of pancreatic cancer.( 6 , 7 , 8 ) One should consider the limitation of these previous studies in terms of the component heterogeneity in PDAC, because the stromal portion in PDAC usually exceeds the cancer cell proportion. Therefore, we obtained highly purified cancer cells by microdissection for a genome gene expression analysis. A few studies, which identified the genes associated with LNM in PDAC by gene expression analysis using microdissection, have been reported.( 12 ) However, the genes associated with LNM in PDAC identified in this study are not included in these studies, and the differences in the results probably may depend on the samples collected in each study. Furthermore, for effective utilization of the vast amount of information gathered through microarray studies, we performed protein expression analysis using immunohistochemical staining to validate the nine genes associated with LNM in PDAC that were identified by expression profiling and had available antibodies. In the results, we could identify four molecular markers (AP2α, LI‐cadherin, MUC17, and XK) associated with LNM in PDAC. Indeed, AP2α had low expression and LI‐cadherin, MUC17, and XK had high expression in PDAC of patients with LNM. In addition, low expression of AP2α and high expression of MUC17 were confirmed as definitively independent factors associated with LNM in PDAC by multivariate analysis. Furthermore, low expression of AP2α and high expression of MUC17 were shown to serve as prognostic factors for survival in patients with PDAC.
Activator protein 2 (AP2), which had low expression in PDAC of patients with LNM in this study, is a cell type‐specific DNA‐binding transcription factor family that has the ability to specifically regulate the expression of other genes in vertebrate organisms. The AP2 family comprises five isoforms of 52 kDa protein: AP2α, AP2β, AP2γ, AP2δ, and AP2ε.( 19 ) They share a common structure, possessing a proline/glutamine‐rich transactivation domain in the N‐terminal region and a helix‐span‐helix domain in the C‐terminal region, which mediates dimerization and site‐specific DNA binding.( 19 , 20 , 21 ) Loss of AP2α expression has been associated with progression of melanoma, colorectal cancer, breast cancer, and pancreatic cancer, indicating that AP2α may have a tumor suppressive role.( 20 , 21 , 22 , 23 ) We first found that the expression of AP2α was associated with not only LNM but also survival of PDAC patients.
In this study, we found that high expressions of three biomarkers (MUC17, LI‐cadherin, and XK) were associated with LNM in PDAC, and these biomarkers were frequently expressed in metastatic lymph nodes in PDAC. Mucin 17 (MUC17), whose high expression was not only an independent factor associated with LNM in PDAC but also a prognostic factor in patients with PDAC, is a membrane‐bound mucin identified recently and located in the mucin cluster at the chromosomal locus 7q22, along with MUC3A/B, MUC11, and MUC12 mucins.( 24 ) The full‐length coding sequence of MUC17 transcribes a 14.2 kb mRNA encompassing 13 exons.( 24 , 25 ) Alternate splicing generates two variant codings, a membrane‐anchored and a secreted form.( 24 , 25 ) Moniaux et al. ( 25 ) reported that MUC17 in pancreatic tumor cell lines and tumor tissues was overexpressed compared with the normal pancreas. Moreover, our data demonstrated that pancreatic cancer patients with LNM had higher expression of MUC17. Here, we show that MUC17 is a new prognostic marker in PDAC patients through lymphatic metastasis, indicating that MUC17 might be a molecular target for therapy of PDAC.
Previous studies showed that LI‐cadherin was expressed only in the rat liver and intestine;( 26 ) however, recent reports have revealed that various kinds of cancer in humans overexpressed LI‐cadherin, including liver, stomach, colon, and pancreas cancers.( 27 , 28 ) The structure of LI‐cadherin is different from that of the classic type I cadherins such as E‐cadherin, in which the cytoplasmic domain contains only 20 amino acids; therefore, LI‐cadherin has no interaction with the catenin network or the actin cytoskelton.( 26 ) However, the role of LI‐cadherin in cancer is still not fully understood. XK is highly expressed in erythroid tissues, skeletal muscle, and the heart and brain.( 29 ) Absence of XK expression at the surface of red blood cells and weakened Kell antigens define the McLeod syndrome phenotype through neurologic impairments.( 29 , 30 ) No previous studies have reported the relationship between XK expression with carcinogenesis.
Although some genes that do not have available antibodies have likely been missed in the present study, AP2α and MUC17 may be important in the metastasis of PDAC, suggesting that these genes may lead to improvements in making an early diagnosis and to the discovery of innovative therapeutic approaches for PDAC patients. The antibodies of AP2α and MUC17 used in this study are also available for paraffin‐embedded tissues; therefore, these antibodies may be useful for clinical markers. However, further molecular and cellular studies are needed to fully make use of this information.
Abbreviations
- AP2
activating enhancer binding protein 2
- C4BPB
complement component 4 binding protein, beta
- DAB
3,3′‐diaminobenzidine
- DOK7
docking protein 7
- FOXL1
forkhead box L1
- LI‐cadherin
liver–intestine cadherin
- LNM
lymph node metastasis
- LSD1
lysine‐specific demethylase 1
- MUC17
mucin 17
- PDAC
pancreatic ductal adenocarcinoma
- XK
X‐linked Kx blood group
References
- 1. Yamada S, Takeda S, Fujii T et al. Clinical implications of peritoneal cytology in potentially resectable pancreatic cancer. Ann Surg 2007; 246: 254–8. [DOI] [PMC free article] [PubMed] [Google Scholar]
- 2. Raut CP, Tseng JF, Sun CC et al. Impact of resection status on pattern of failure and survival after pancreaticoduodenectomy for pancreatic adenocarcinoma. Ann Surg 2007; 246: 52–60. [DOI] [PMC free article] [PubMed] [Google Scholar]
- 3. Pawlik TM, Gleisner AL, Cameron JL et al. Prognostic relevance of lymph node ratio following pancreaticoduodenectomy for pancreatic cancer. Surgery 2007; 141: 610–8. [DOI] [PubMed] [Google Scholar]
- 4. Schwarz RE, Smith DD. Extent of lymph node retrieval and pancreatic cancer survival: information from a large US population database. Ann Surg Oncol 2006; 13: 1189–200. [DOI] [PubMed] [Google Scholar]
- 5. Shimada K, Sakamoto Y, Sano T, Kosuge T. Prognostic factors after distal pancreatectomy with extended lymphadectomy for invasive pancreatic adenocarcinoma of the body and tail. Surgery 2006; 139: 288–95. [DOI] [PubMed] [Google Scholar]
- 6. Logsdon CD, Simeone DM, Binkley C et al. Molecular profiling of pancreatic adenocarcinoma and chronic pancreatitis identifies multiple genes differentially regulated in pancreatic cancer. Cancer Res 2003; 63: 2649–57. [PubMed] [Google Scholar]
- 7. Iacobuzio‐Donahue CA, Ashfaq R, Maitra A et al. Highly expressed genes in pancreatic ductal adenocarcinoma: a comprehensive characterization and comparison of the transcription profiles obtained from three major technologies. Cancer Res 2003; 63: 8614–22. [PubMed] [Google Scholar]
- 8. Hosokawa M, Kashiwaya K, Eguchi H et al. Over‐expression of cysteine proteinase inhibitor cystain 6 promotes pancreatic cancer growth. Cancer Sci 2008; 99: 1626–32. [DOI] [PMC free article] [PubMed] [Google Scholar]
- 9. Missiaglia E, Blaveri E, Terris B et al. Analysis of gene expression in cancer cell lines identifies candidate markers for pancreatic tumorigenesis and metastasis. Int J Cancer 2004; 112: 100–12. [DOI] [PubMed] [Google Scholar]
- 10. Grutzmann R, Pilarsky C, Ammerpohl O et al. Gene expression profiling of microdissected pancreatic ductal carcinomas using high‐density DNA microarrays. Neoplasis 2004; 6: 611–22. [DOI] [PMC free article] [PubMed] [Google Scholar]
- 11. Emmert‐Buck MR, Bonner RF, Smith PD et al. Laser capture microdissection. Science 1996; 274: 998–1001. [DOI] [PubMed] [Google Scholar]
- 12. Nakamura T, Furukawa Y, Nakagawa H et al. Genome‐wide cDNA microarray analysis of gene expression profiles in pancreatic cancers using populations of tumor cells and normal ductal epithelial cells selected for purity by laser microdissection. Oncogene 2004; 23: 2385–400. [DOI] [PubMed] [Google Scholar]
- 13. Sobin LH, Wittekind CH. TNM Classification of Malignant Tumors, 6th edn. New York, NY: John Wiley & Sons, 2002. [Google Scholar]
- 14. Makretsov NA, Huntsman DG, Nielsen TO et al. Hierarchical clustering analysis of tissue microarray immunostaining data identifies prognostically significant groups of breast carcinoma. Clin Cancer Res 2004; 10: 6143–51. [DOI] [PubMed] [Google Scholar]
- 15. Kim J, Reber HA, Hines OJ et al. The clinical significance of MAGEA3 expression in pancreatic cancer. Int J Cancer 2006; 118: 2269–75. [DOI] [PubMed] [Google Scholar]
- 16. Van De Vijver MJ, He YD, Veer LJ et al. A gene‐expression signature as a predictor of survival in breast cancer. New Engl J Med 2002; 347: 1999–2009. [DOI] [PubMed] [Google Scholar]
- 17. Ramaswamy S, Ross KN, Lander ES, Golub TR. A molecular signature of metastasis in primary solid tumors. Nat Genet 2003; 33: 49–54. [DOI] [PubMed] [Google Scholar]
- 18. Veer LJ, Weigelt B. Road map to metastasis. Nat Med 2003; 9: 999–1000. [DOI] [PubMed] [Google Scholar]
- 19. Williams T, Admon A, Luscher B, Tjian R. Cloning and expression of AP‐2, a cell‐type‐specific transcription factor that activates inducible enhancer elements. Gene Dev 1988; 2: 1557–69. [DOI] [PubMed] [Google Scholar]
- 20. Kyo S, Takakura M, Fujiwara T, Inoue M. Understanding and exploiting hTERT promoter regulation for diagnosis and treatment of human cancers. Cancer Sci 2008; 99: 1528–38. [DOI] [PMC free article] [PubMed] [Google Scholar]
- 21. Schwartz B, Melnikova VO, Tellez C et al. Loss of AP‐2α results in deregulation of E‐cadherin and MMP‐9 and an increase in tumorigenicity of colon cancer cells in vivo. Oncogene 2007; 26: 4049–58. [DOI] [PubMed] [Google Scholar]
- 22. Karjalainen JM, Kellokoski JK, Eskelinen MJ, Alhava EM, Kosma VM. Downregulation of transcription factor AP‐2 predicts poor survival in stage I cutaneous malignant melanoma. J Clin Oncol 1998; 16: 3584–91. [DOI] [PubMed] [Google Scholar]
- 23. Fauquette V, Aubert S, Groux‐Degroote S et al. Transcription factor AP‐2αrepresses both the mucin MUC4 expression and pancreatic cancer cell proliferation. Carcinogenesis 2007; 28: 2305–12. [DOI] [PubMed] [Google Scholar]
- 24. Gum JR, Crawley SC, Hicks JW, Szymkowski DE, Kim YS. Muc17, a novel membrane‐tethered mucin. Biochem Biophys Res Commun 2002; 291: 466–75. [DOI] [PubMed] [Google Scholar]
- 25. Moniaux N, Junker WM, Singh AP, Jones AM, Batra SK. Characterization of human mucin MUC17. J Biol Chem 2006; 281: 23676–85. [DOI] [PubMed] [Google Scholar]
- 26. Gessner R, Tauber R. Intestinal cell adhesion molecules. Liver‐intestine cadherin. Ann N Y Acad Sci 2000; 915: 136–43. [DOI] [PubMed] [Google Scholar]
- 27. Varghese S, Surness M, Xu H, Beresnev T, Pingpank J, Alexander HR. Site‐specific gene expression profiles and novel molecular prognostic factors in patients with lower gastrointestinal adenocarcinoma diffusely metastatic to liver or peritoneum. Ann Surg Oncol 2007; 14: 3460–71. [DOI] [PubMed] [Google Scholar]
- 28. Wang XQ, Luk JM, Leung PP, Wong BW, Stanbridge EJ, Fan ST. Alternative mRNA splicing of liver intestine‐cadherin in hepatocellular carcinoma. Clin Cancer Res 2005; 11: 483–9. [PubMed] [Google Scholar]
- 29. Ho M, Chelly J, Carter N, Danek A, Crocker P, Monaco AP. Isolation of the gene for McLeod syndrome that encodes a novel membrane transport protein. Cell 1994; 77: 869–80. [DOI] [PubMed] [Google Scholar]
- 30. Claperon A, Hattab C, Armand V, Trottier S, Bertrand O, Ouimet T. The Kell and XK proteins of the Kell blood group are not co‐expressed in the central nervous system. Brain Res 2007; 1147: 12–24. [DOI] [PubMed] [Google Scholar]