Abstract
We analyzed the correlation between interferon‐α (IFNα) response and gene expression profiles to predict IFNα sensitivity and identified key molecules regulating the IFNα response in renal cell carcinoma (RCC) cell lines. To classify eight RCC cell lines of the SKRC series into three subgroups according to IFNα sensitivity, that is, sensitive, resistant and intermediate group, responses to IFNα (300–3000 IU/mL) were quantified by WST‐1 assay. Microarray, followed by supervised hierarchical clustering analysis, was applied to selected genes according to IFNα sensitivity. In order to find alteration of expression profiles induced by IFNα, sequential microarray analyses were performed at 3, 6, and 12 h after IFNα treatment of RCC cell lines and mRNA expression level was confirmed using quantitative real time polymerase chain reaction. According to the sequential microarray analysis between IFNα‐sensitive and ‐resistant line, seven genes were selected as candidates for IFNα‐sensitivity‐related genes in RCC cell lines. Among these seven genes, we further developed a model to predict tumor inhibition with four genes, that is, adipose differentiation‐related protein, microphthalmia associated transcription factor, mitochondrial tumor suppressor 1, and troponin T1 using multiple linear regression analysis (coefficient = 0.948, P = 0.0291) and validated the model using other RCC cell lines including six primary cultured RCC cells. The expression levels of the combined selected genes may provide predictive information on the IFNα response in RCC. Furthermore, the IFNα response to RCC might be modulated by regulation of the expression level of these molecules. (Cancer Sci 2007; 98: 529–534)
The prognosis of patients with metastatic renal cell carcinoma (RCC) is pessimistic because resection of the tumor is the most effective known treatment. The U.S. Food and Drug Administration recently approved sorafenib and sunitinib, a molecular targeting agent combining a multikinase inhibitor with a vascular endothelial growth factor (VEGF) inhibitor, as a new treatment for advanced RCC. Although the indication of these new agents needs to be investigated further, molecular targeting therapy may be a promising treatment for patients with metastatic RCC.( 1 , 2 ) From this point of view, identification of new targeting molecules could be of great value in the treatment of advanced RCC.
Interferon‐α (IFNα) is currently one of the standard therapies for these patients, but the response rate is only 15–20%,( 3 , 4 ) and recently it has been reported that treatment with IFNα has several adverse side‐effects.( 5 ) The anti‐tumor effect of IFNα consists of the direct inhibition of tumor proliferation and the biological response modifiers (BRM). Because of complexity of the approach to molecular mechanism of BRM, we focused on investigating the direct inhibition of IFNα to cancer cells.
The molecular mechanism of IFNα resistance remains to be fully elucidated, not only in RCC but also in other cancers, for example malignant melanoma and lymphoma, that are resistant to IFNα. Defective Jak‐STAT pathways( 6 ) and loss of ISGF3 components( 7 ) which were key molecules of the IFN signal transduction pathway, have been identified in vitro in human melanoma cell lines as molecular mechanisms of IFNα resistance. It was also reported that a lack of STAT1 expression was associated with IFNα resistance in a T‐cell lymphoma cell line( 8 ) and in RCC.( 9 ) Although STAT1 is required for IFNα‐induced growth inhibition, gene alterations of the Jak‐STAT pathway in RCC have not been often reported.
Therefore, in this study we focused on identification of new molecular targets that are associated with IFNα resistance, particularly changes in IFNα‐stimulated genes in RCC cell lines that properly express known IFN‐signaling molecules participating in the Jak‐STAT pathway.
Materials and Methods
RCC cell lines and RNA extraction. Eight species of SKRC cell lines (SKRC‐1, ‐6, ‐12, ‐14, ‐17, ‐33, ‐52, and ‐59) were cultured in RPMI 1640 medium with 10% fetal bovine serum and 1% L‐glutamine in an incubator at 37°C and 5% CO2 atmosphere. First, the IFNα sensitivity of the cells was evaluated as described in the following section, and then the gene expression profiles were analyzed.
At 80% confluence (5–10 × 106 cells), the RNA was extracted from each cell line before addition of IFNα. Briefly, cells were washed with phosphate‐buffered saline (PBS) and lyzed with 1 mL of TRIzol reagent (a phenol and guanidine isocyanate solution; Gibco BRL, Grand Island, NY, USA). Chloroform (200 µL) was added, and the mixture was centrifuged at 4°C and 12 000 g for 15 min. The liquid phase was precipitated with isopropanol. The RNA pellets were dissolved in Tris EDTA (TE) buffer. In addition, RNA was extracted from the selected cell lines at 3, 6, and 12 h after IFNα treatment. The cell line RPTEC 5477‐1 (Clonetics, San Diego, CA, USA) derived from epithelial cells of the human renal proximal tubule was used as a control for RNA expression.
Twelve another RCC cells derive from RCC cell lines (SKRC‐10, ‐24, ‐29, ‐35, ‐38 and SN12C) and unsubcloned primary culture cells of resected RCC specimens, called RCC10, OS‐RC‐2, TUHR10TKB, TUHR16TKB, TUHR25TKB and 598RCC were used to validate this analysis. OS‐RC‐2, TUHR10TKB, TUHR16TKB 598RCC and TUHR25TKB were obtained by primary culturing of RCC specimens of four clear cell carcinomas and spindle cell carcinoma, respectively. Original histology of RCC10 was unfortunately unknown. RNA extraction from these cells was performed according to the same procedure as mentioned above.
IFNα response in RCC cell lines. Fourteen cell lines (SKRC‐1, ‐6, ‐10, ‐12, ‐14, ‐17, ‐24, ‐29, ‐33, ‐35, ‐38, ‐52, and ‐59 and SN12C) and six RCC cells (RCC10, OS‐RC‐2, TUHR10TKB, TUHR16TKB, TUHR25TKB and 598RCC) were evaluated for growth inhibition after IFNα treatment. Cells were treated with serial dilutions of IFNα from 300 to 3000 IU/mL at the final concentration according to the previous study,( 10 , 11 ) and then the growth inhibition was assessed at 3, 5, and 7 days after treatment using a WST‐1 assay (Dojindo, Tokyo, Japan) according to the manufacturer's directions. The WST‐1 assay was repeated at least five times on each cell line to obtain reproducible results. Based on the average inhibition of the treated concentration between 300 and 3000 IU/mL at the 5th day compared with the control (without IFNα treatment), cell lines were divided into three subgroups that were designated sensitive, resistant, and intermediate. A line was designated sensitive if the inhibition was more than 40% inhibition at 300 IU/mL of IFNα treatment. If less than 20% inhibition occurred at 3000 IU/mL of IFNα, it was considered a resistant line. The other cell lines were considered intermediate.
Microarray analysis. A CodeLink human 20 k microarray (GE Healthcare, Tokyo, Japan) was used to profile gene expressions of RCC cell lines according to the manufacturer's instructions. Global correction was used to standardize the expression level of each array slide. Gene expression profiling was analyzed by GeneSpring™ 5.0 software (Silicon Genetics, CA, USA). Expression level of each gene was determined by comparison with median expression level based on per tip normalization. Supervised hierarchical gene clustering was performed on IFNα‐sensitive lines and ‐resistant cell lines in a static phase before IFNα treatment. Briefly, genes of which expression elevated commonly within the group at least three times higher than the expression of those in the other group, were clustered among the 20 k genes. Then, in a dynamic phase after IFNα treatment, sequential changes in the expression levels of these clustered genes were analyzed and select genes of which difference in expression was increased or at least steady after IFNα treatment. An additional gene clustering was performed to select gene sets of which expression did not only alter commonly within the group but also changed in a different manner between groups after IFNα treatment using gene ontology analysis.
Western blot analyses. To evaluate the expression of known IFNα‐signaling molecules, Western blotting was done using specific antibodies against IFNα receptor (IFNR), Jak1, Tyk2, STAT1, STAT2, ISGF3γ, and tyrosine phosphorylated STAT1 in the selected IFNα‐sensitive and ‐resistant lines. Briefly, to extract protein, RCC cells were lyzed in SDS sample buffer at 0, 3, 6, 12, and 24 h after IFNα treatment. For each sample, 25 µg of protein was separated on a 7% SDS‐polyacrylamide gel and transferred onto nitrocellulose filters. The mouse monoclonal antibodies used were IFN‐α/βRα (R‐100, diluted 1/200; Santa Cruz Biochemicals, Inc., Santa Cruz, CA, USA), Anti‐JAK1 (#J24320, diluted 1/250; Transduction Laboratory, San Jose, CA, USA), Anti‐Tyk2 T20220, diluted 1/250; Transduction Laboratory), Anti‐STAT1 (#G16920, diluted 1/250; Transduction Laboratory), Anti‐STAT2 (#S21220, diluted 1/250; Transduction Laboratory), Anti‐ISGF3γ (#I29320, diluted 1/250; Transduction Laboratory), and antiphospho‐Stat1 (Tyr701, diluted 1/2000; Cell Signaling Technology, Beverly, MA, USA) against IFNα receptor, JAK1, Tyk2, STAT1, STAT2, ISGF3γ, and STAT1 with tyrosine phosphorylation, respectively. Antibody binding was visualized using chemiluminescence (ECL, Amersham) according to the manufacturer's directions.
Real‐time quantitative PCR. According to results of the microarray analyses using GeneSpring in the static and dynamic phases of IFNα treatment, mRNA expressions of selected genes were quantified using the ABI PRISM®7000 Sequence Detection System (Applied Biosystems, Foster City, CA, USA). All RNA samples were isolated from cell lines as described above. Complementary DNA was synthesized from total RNA using a standard reverse transcription system, SuperScript First Strand system (#11904–018, Invitrogen, Tokyo, Japan), and diluted with TE buffer to 20 µL. Primers and TaqMan probe sequences were designed with Assays‐on‐Demand Gene Expression probes (Applied Biosystems) according to the Assay ID corresponding to the GenBank Public ID for the selected gene sequence. Real time PCR was performed using TagMan Universal PCR Master Mix (Applied Biosystems), the above primers, and a TagMan probe. To obtain an average level of gene expression, RNA quantification of each gene was duplicated, and expression of the mRNA level was standardized using the 18S ribosomal RNA expression of each sample as an internal control.
Statistical analysis for prediction of IFNα response according to gene expression quantity. To develop a model to predict the rate of growth inhibition due to IFNα in RCC cell lines, multiple linear regression analysis was applied using the relative quantity of RNA from selected gene expressions as described previously.( 12 ) The rate of growth inhibition when treated with 1000 IU/mL IFNα was used in this statistical analysis.
Validation of the model for prediction of IFNα response using other RCC cells. Messenger RNA expression levels of candidate genes selected by microarray based gene expression profile were quantified in 12 RCC cells, which were six primary culture cells, that is RCC10, OS‐RC‐2, TUHR10TKB, TUHR16TKB, TUHR25TKB and 598RCC, and six other RCC cell lines, that is SKRC‐10, ‐24, ‐29, ‐35, ‐38 and SN12C. Then response to IFNα was calculated by the model created by the above‐mentioned procedure and was evaluated and correlated with actual IFNα response.
Results
IFNα response of RCC cell lines. Growth inhibition of the SKRC cell lines was evaluated on the fifth day after the addition of serial concentrations of IFNα (Table 1). According to the degree of growth inhibition, SKRC‐17 and ‐59, SKRC‐12 and ‐33, and the other cell lines were considered sensitive, resistant, and intermediate, respectively.
Table 1.
Growth inhibition of SKRC cell lines after interferon‐α (IFNα) treatment
| IFNα | Growth inhibition (%) of SKRC cell line | |||||||
|---|---|---|---|---|---|---|---|---|
| Concentration | 1 | 6 | 12 | 14 | 17 | 33 | 52 | 59 |
| 300 IU/mL | 37.0 | 38.7 | −10.9 | 13.7 | 46.3 | 0.6 | 36.3 | 43.0 |
| 1000 IU/mL | 24.9 | 33.9 | −4.5 | 17.5 | 51.3 | 8.9 | 42.8 | 47.0 |
| 3000 IU/mL | 41.6 | 46.7 | 13.6 | 36.9 | 59.8 | 17.1 | 57.6 | 49.5 |
Western blotting for IFNα signaling molecules in IFNα‐sensitive and ‐resistant RCC cell lines. Western blotting showed that both sensitive and resistant cell lines (SKRC‐12, ‐17, and ‐33, ‐59, respectively) expressed IFNα‐receptors and IFNα‐signaling molecules (JAK1, Tyk2, STAT1, STAT2, and ISGF3γ) at the protein level independent of IFNα sensitivity (Fig. 1a,b). Expression of ISGF3γ, which is a molecule involved in the last phase of IFNα signaling, that is a DNA‐binding protein, was increased in all cell lines at 6–12 h after IFNα treatment. Phosphorylation of STAT1 was observed in all four cell lines at 3 h after IFNα treatment (Fig. 1b).
Figure 1.
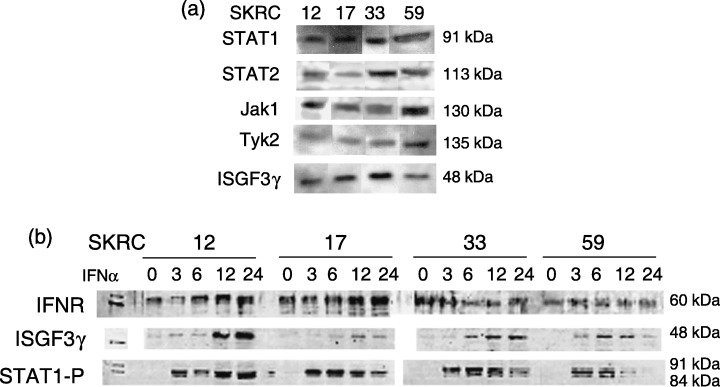
In the interferon‐α (IFNα)‐sensitive and ‐resistant lines, known IFN signaling molecules, STAT1, STAT2, Jak1, Tyk2, and ISGF3γ, are expressed with no apparent difference between cell lines (a). Sequential Western blot analyses show that IFN receptor (IFNR) was continuously expressed and that expression of ISGF3γ was increased after IFNα treatment. Additionally, it was confirmed that phosphorylation of STAT1 (STAT1‐P) is observed at 3 h after IFNα treatment equally in IFNα‐sensitive and ‐resistant lines (b).
Microarray analysis of IFNα‐sensitive and ‐resistant RCC cell lines. Supervised hierarchical clustering analysis according to IFNα‐response using the 20 k cDNA microarray revealed differences between IFNα‐sensitive lines (SKRC‐17 and ‐59) and ‐resistant lines (SKRC‐12 and ‐33) in 40 genes (Fig. 2). Among these 40 genes, seven were eventually selected as candidates for predictors of IFNα sensitivity because sequential microarray analyses showed that the difference in these seven gene expressions between IFNα‐sensitive and ‐resistant groups was increased or at least steady after IFNα treatment (2, 3). Gene ontology revealed that a few genes regulating cell cycle or apoptosis commonly changed according to IFNα sensitivity. In the dynamic gene expression profile after IFNα treatment, several cell‐cycle‐related genes (polo‐like kinase 3 and RAP1A, member of RAS oncogene family) and apoptosis‐related genes (programmed cell death 5, NCK‐associated protein 1, CD27 binding protein and BCL2‐associated transcription factor 1) were commonly induced in the IFNα‐resistant group.
Figure 2.
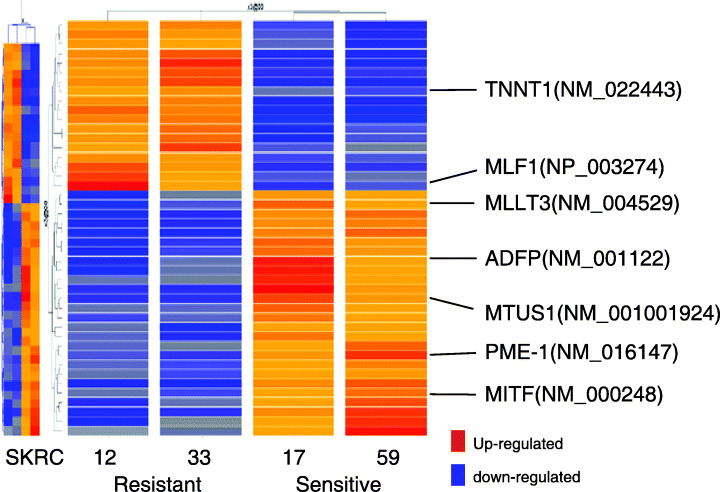
Supervised hierarchical clustering analysis according to interferon‐α (IFNα) response showed that a total of 40 genes were different in IFNα‐sensitive lines (SKRC‐17 and ‐59) and ‐resistant lines (SKRC‐12 and ‐33). Among these 40 genes, seven were selected as candidates for predictors of IFNα sensitivity because gene expressions, as assessed by microarray, in the dynamic phase after IFNα treatment were increased or at least preserved in IFNα‐sensitive and ‐resistant groups.
Figure 3.
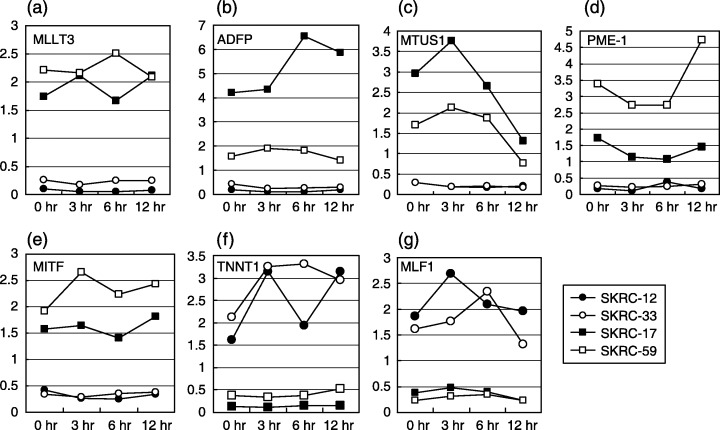
Expression of up‐regulated genes in interferon‐α (IFNα)‐sensitive lines was higher after IFNα treatment than before treatment. MLLT3 (a) was preserved after IFNα treatment, and ADFP (b), MTUS1 (c), and MITF (e) increased in the early stage after IFNα treatment while up‐regulation of PME‐1 (d) after IFNα treatment was observed in a relatively late phase. Y‐axis and X‐axis indicate relative gene expression level and time after IFNα treatment, respectively. On the other hand, TNNT1 (f) and MLF1 (g) were up‐regulated in IFNα‐resistant lines, and TNNT1 was elevated longer after IFNα treatment than MLF1. Y‐axis and X‐axis indicate relative gene expression level and time after IFNα treatment, respectively.
Real‐time quantitative PCR of candidate genes for predictors of IFNα response. Messenger RNA expressions of seven selected genes in eight SKRC cell lines, including IFNα‐sensitive and ‐resistant lines, are shown in Fig. 4. Quantitative PCR revealed that microarray‐based expression analysis was identical with the relative mRNA expression according to PCR. Expressions of adipose differentiation‐related protein (ADFP), microphthalmia‐associated transcription factor (MITF), mitochondrial tumor suppressor 1 (MTUS1), protein phosphatase methylesterase‐1 (PME‐1), myeloid/lymphoid or mixed‐lineage leukemia; translocated to 3 (MLLT3), myeloid leukemia factor 1 (MLF1), and troponin T1 (TNNT1) were well correlated with the relationship between IFNα‐sensitive and ‐resistant lines. The expression of MLF‐1 in SKRC‐33, which is an IFNα‐resistant line, was relatively weak compared to other SKRC cell lines.
Figure 4.
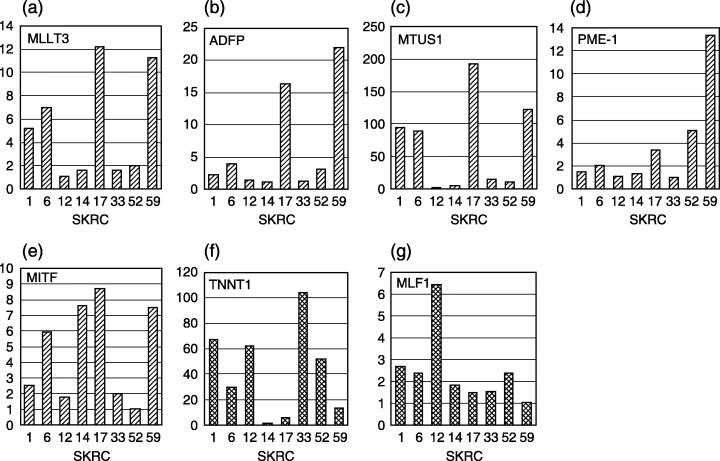
Quantitative real‐time polymerase chain reaction confirmed that mRNA expressions of five genes (a–e) in the interferon‐α (IFNα)‐sensitive line, which are up‐regulated in cDNA microarray analysis, were higher than those in IFNα‐resistant lines (MLLT3 (a), ADFP (b), MTUS1 (c), PME‐1 (d), and MITF (e). In the other cell lines, messenger RNAs (mRNAs) of these five genes are diversely expressed depending on the cell line. Messenger RNA expressions of TNNT1 (f) and MLF1 (g) are concordant with the expression signals detected by cDNA microarray. Correlation of expression of TNNT1 between the IFNα‐sensitive and ‐resistant groups is contrary to the association with ADFP, MTUS1, and MITF. Y‐axis indicates relative mRNA level.
Model for prediction of IFNα response in RCC cell lines. Multiple linear regression analysis revealed that the expressions of ADFP, MITF, MTUS1, and TNNT1 individually had a tendency to predict IFNα response individually, but the tendency was not statistically significant (P = 0.07, 0.056, 0.049, and 0.051, respectively). However, in combination, they predicted the IFNα inhibition rate at 1000 IU/mL in SKRC cell lines with the following formula using logarithmically transformed variables as indicated in Fig. 5:
Figure 5.
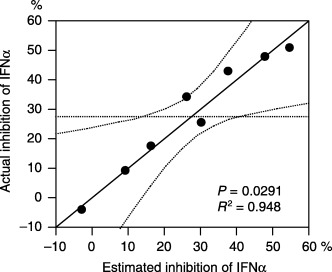
Multiple linear regression analysis revealed that a combination of logarithmically transformed expression levels of ADFP, MITF, MTUS1, and TNNT1 correlated well with the growth inhibition rate assessed by WST‐1 assay at 1000 IU/mL of interferon‐α (coefficient = 0.948, P = 0.0291).
Estimated response‐IFNα 1000 = 9.39 × log(ADFP) − 21.8 × log(MITF) + 8.04 × log(MTUS1) – 10.2 × log(TNNT1) + 49.8 (coefficient = 0.948, P = 0.0291).
Validation of the model using 12 RCC cells. In 12 RCC cells, inhibition rate to 1000 IU/mL of IFNα was observed in between −18.6% and 60.5%. RNA expression levels of ADFP, MITF, MTUS‐1 and TNNT1 in 12 RCC cells were shown in Fig. 6a. Although no apparent relationship was observed in RNA level of each gene with IFN response, estimated inhibition rates of IFNα, which were 3.01% to 89.2%, calculated by the above formula seems to correlate with the actual inhibition rate in these 12 RCC cells (r = 0.627) (Fig. 6b).
Figure 6.
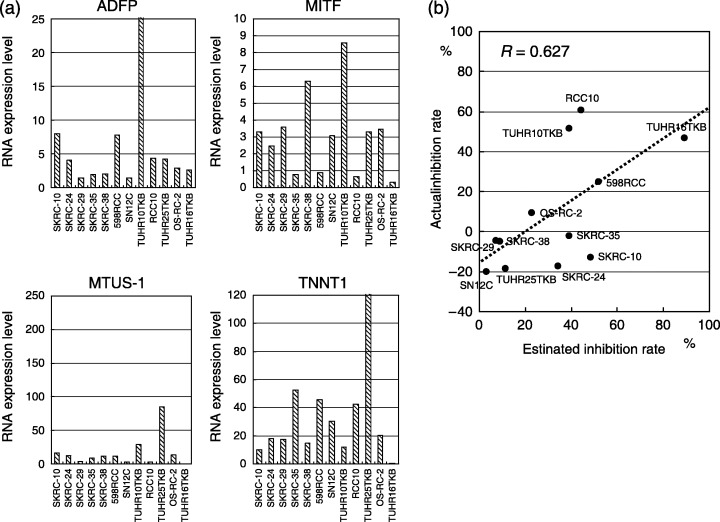
Messenger RNA (mRNA) expression of four genes, ADFP, MITF, MTUS1, and TNNT1, assessed by quantitative polymerase chain reaction in six SKRC cell lines and six primary cultures from renal cell carcinoma (RCC) specimens (a). For validation of the model for prediction of interferon‐α response, inhibition rate of 12 RCC cells was calculated using relative mRNA expression level (b). Correlation between actual and estimated inhibition rate is considered to be statistically significant (r = 0.627).
Discussion
Several cDNA microarray‐based studies concerning the tumor morphology, molecular classification, novel gene expression, and prognosis of RCC were recently reported.( 13 , 14 , 15 , 16 , 17 ) Takahashi et al.,( 13 ) and Kosari et al.,( 17 ) reported that a combination of gene expression profiles might be an indicator of tumor aggressiveness and patient prognosis. A striking study by Togashi et al.,( 16 ) has reported that a novel gene, hypoxia‐inducible protein 2 (HIG2), was identified using microarray analysis as a diagnostic marker of RCC and a potential target for molecular therapy in RCC. However, no microarray study has been published dealing with therapeutic modulations of IFNα in RCC. Here, we selected candidate genes for prediction of IFNα sensitivity using hierarchical clustering in RCC cell lines.
Elucidation of the molecular mechanisms may enable therapeutic regulation of INFα sensitivity in RCC. Although the lack of STAT1 associated with IFNα resistance has been reported in RCC,( 9 ) we first analyzed the protein expression of IFNα signaling molecules and observed no aberrant expression in the molecules in a series of RCC cell lines. Sequential Western blots also revealed that the induction of STAT1 was not defective. Therefore, we considered that the IFNα‐resistance of SKRC‐12 and ‐33 is elucidated by aberrant or defective activation of the transcription of IFN‐regulated genes.
Supervised hierarchical clustering analysis of IFNα sensitivity selected 40 genomic candidates to discriminate IFNα‐sensitive RCC from ‐resistant RCC. Analysis of gene alteration after IFNα treatment was useful to reduce the number of genes, and eventually seven genes were chosen as candidates for estimation of the IFNα response in RCC cell lines. As mentioned above, several cell‐cycle‐related genes and apoptosis‐related genes commonly elevated after IFNα treatment in the IFNα‐resistant group. Although these temporarily overexpressed genes should be important during IFNα response, it is unfortunate that the expression of these genes is not different between IFNα‐sensitive and ‐resistant cell lines before IFNα treatment. It might be reasoned that many signaling molecules are induced by IFNα independently of IFNα sensitivity. In addition, it might be practically difficult to examine the alteration of gene expression after IFNα treatment in a clinical RCC sample. Therefore, we focused the gene expression pattern of RCC cells in the static phase, that is the pretreatment state of IFNα. Using the prediction formula developed in this study, the growth inhibition rate in both established and primary cultured RCC cells by IFNα treatment has been estimated as well as other RCC cell lines. Although correlation between actual and estimated inhibition rate among these 12 cell lines is considered to be significant (r = 0.627), prediction of IFNα‐response status seems to be difficult in some cell lines with borderline IFNα sensitivity such as TUHR10TKB and SKRC‐10. Because it is apparent that IFNα sensitivity is not regulated by expression of a certain gene but by a network of several genes, the IFNα responder may be predicted before IFNα treatment by quantitative RNA expression of a fresh frozen RCC specimen. A prospective study needs to be performed in addition to retrospective clinico‐pathological analysis of the relationship between the clinical effect of IFNα and expression of the candidate molecules in this study.
The relationships between the seven genes selected by microarray analysis and RCC tumorigenesis, or even between the genes and the mechanism of IFNα response in other cancers, are not yet clear. ADFP is a lipid storage droplet‐associated protein, which is expressed at high levels in adipocytes and at various levels in many different cells,( 18 , 19 ) ADFP is involved in fatty acid uptake and formation or stabilization of lipid droplets in the cells, and serves as a shuttle of lipid substrates to the lipid droplets.( 20 , 21 ) ADFP has also been characterized as one of the hypoxia‐inducible genes, and its transcription activation is mediated by the hypoxia inducible factor (HIF)‐α/aryl hydrocarbon receptor nuclear translocator (ARNT) heterodimer.( 22 ) It is well known that clear cell RCC contains abundant lipids, and Yao et al.( 15 ) reported that patients with RCC overexpressing ADFP had a better prognosis. This might indicate that ADFP expression is associated with IFNα sensitivity in clear cell RCC.
We found that expression of MITF was associated with higher sensitivity to IFNα in RCC cell lines. MITF links differentiation with cell cycle arrest, that is cell cycle exit, in melanocytes by activating the cell cycle inhibitor INK4a,( 23 ) and also cooperates with retinoblastoma protein (RB) and activates expression of p21WAF1), the cyclin‐dependent kinase inhibitor gene, to regulate cell cycle progression. MITF binds the INK4a promoter, activates p16INK4a mRNA and protein expression, and induces RB hypophosphorylation, thereby triggering cell cycle arrest. MITF is also a transcriptional regulator as a good prognostic marker in melanoma, which is also IFNα‐sensitive cancer. It is reported that a subfamily of transcription factor MITF is involved in RCC development and plays a critical role in the regulation of aberrant renal cellular growth. Because p16INK4a has been observed in RCC,( 24 , 25 ) the MITF profile might indicate that IFNα activates p16INK4a‐mediated apoptosis in RCC. In addition, MITF expression is statistically correlated with ADFP expression in RCC cell lines. It is reported that MITF binds to the HIF1α promoter and strongly stimulates its transcriptional activity, resulting in up‐regulation of VEGF expression.( 26 ) Therefore, a close relationship between ADFP and MITF could indicate that ADFP is mediated by HIF‐induced transcriptional activity, as described above. Another interesting aspect is that ADFP and MITF, located at chromosome 9 (9p22.1) and 3 (3p14.2‐p14.1), are involved in frequently detected loci of RCC.( 24 , 27 ) Thus correlation between IFNα sensitivity and genetic status should be investigated in RCC at the next step.
In conclusion, we identified a gene cluster that may be associated with in vitro sensitivity to IFNα in RCC cell lines. By quantifying the mRNA of a limited number of candidate genes, IFNα sensitivity in clinical RCC could be estimated in frozen specimens of nephrectomized kidney. To validate the clinical relevance of determining IFNα sensitivity, it is necessary to analyze the correlation between the clinical response to IFNα and the expression profile of these genes in tumor specimens from patients with RCC. Furthermore, modulation or up‐regulation of these candidate genes, for example ADFP and MITF, may become a therapeutic target in patients with IFNα‐resistant RCC.
Acknowledgment
This study was supported in part by a Grant‐in‐Aid for Cancer Research from the Japan Society for the Promotion of Science (13671633 and 15591669).
References
- 1. Ratain MJ, Eisen T, Stadler WM et al. Phase II placebo‐controlled randomized discontinuation trial of sorafenib in patients with metastatic renal cell carcinoma. J Clin Oncol 2006; 24: 2505–12. [DOI] [PubMed] [Google Scholar]
- 2. Veronese ML, Mosenkis A, Flaherty KT et al. Mechanisms of hypertension associated with BAY 43–9006. J Clin Oncol 2006; 24: 1363–9. [DOI] [PubMed] [Google Scholar]
- 3. Wirth MP. Immunotherapy for metastatic renal cell carcinoma. J Urol 1993; 163: 408–17. [PubMed] [Google Scholar]
- 4. MRC. Inteferon‐alpha and survival in metastatic renal cell carcinoma: early results of a randomized controlled trial. Medical Research Council Renal Cancer Collaborators. Lancet 1999; 353: 14–7. [PubMed] [Google Scholar]
- 5. Sleijfer S, Bannink M, Van Gool AR, Kruit WH, Stoter G. Side Effects of Interferon‐alpha Therapy. Pharm World Sci 2005; 27: 423–31. [DOI] [PubMed] [Google Scholar]
- 6. Pansky A, Hildebrand P, Fasler‐Kan E et al. Defective Jak‐STAT signal transduction pathway in melanoma cells resistant to growth inhibition by interferon‐alpha. Int J Cancer 2000; 85: 720–5. [DOI] [PubMed] [Google Scholar]
- 7. Wong LH, Krauer KG, Hatzinisiriou I et al. Interferon‐resistant human melanoma cells are deficient in ISGF3 components, STAT1, STAT2, and p48‐ISGF3gamma. J Biol Chem 1997; 272: 28 779–85. [DOI] [PubMed] [Google Scholar]
- 8. Sun WH, Pabon C, Alsayed Y et al. Interferon‐alpha resistance in a cutaneous T‐cell lymphoma cell line is associated with lack of STAT1 expression. Blood 1998; 91: 570–6. [PubMed] [Google Scholar]
- 9. Brinckmann A, Axer S, Jakschies D et al. Interferon‐alpha resistance in renal carcinoma cells is associated with defective induction of signal transducer and activator of transcription 1 which can be restored by a supernatant of phorbol 12‐myristate 13‐acetate stimulated peripheral blood mononuclear cells. Br J Cancer 2002; 86: 449–55. [DOI] [PMC free article] [PubMed] [Google Scholar]
- 10. Yanai Y, Horie S, Yamamoto K et al. Characterization of the antitumor activities of IFN‐α8 on renal cell carcinoma cells in vitro. J Interferon Cytokine Res 2001; 21: 1129–36. [DOI] [PubMed] [Google Scholar]
- 11. Nakamura K, Yoshikawa K, Yamada Y et al. Differential profiling analysis of proteins involved in anti‐proliferative effect of interferon‐alpha on renal cell carcinoma cell lines by protein biochip technology. Int J Oncol 2006; 28: 965–70. [PubMed] [Google Scholar]
- 12. Tanaka T, Tamimoto K, Otani K et al. Concise prediction models of anticancer efficacy of 8 drugs using expression data from 12 selected genes. Int J Cancer 2004; 111: 617–26. [DOI] [PubMed] [Google Scholar]
- 13. Takahashi M, Sugimura J, Yang X et al. Gene expression profiling of renal cell carcinoma and its implications in diagnosis, prognosis, and therapeutics. Adv Cancer Res 2003; 89: 157–81. [DOI] [PubMed] [Google Scholar]
- 14. Ami Y, Shimazui T, Akaza H et al. Gene expression profiles correlate with the morphology and metastasis characteristics of renal cell carcinoma cells. Oncol Rep 2005; 13: 75–80. [PubMed] [Google Scholar]
- 15. Yao M, Tabuchi H, Nagashima Y et al. Gene expression analysis of renal carcinoma: adipose differentiation‐related protein as a potential diagnostic and prognostic biomarker for clear‐cell renal carcinoma. J Pathol 2005; 205: 377–87. [DOI] [PubMed] [Google Scholar]
- 16. Togashi A, Katagiri T, Ashida S et al. Hypoxia‐inducible protein 2 (HIG2), a novel diagnostic marker for renal cell carcinoma and potential target for molecular therapy. Cancer Res 2005; 65: 4817–26. [DOI] [PubMed] [Google Scholar]
- 17. Kosari F, Parker AS, Kube DM et al. Clear cell renal cell carcinoma: gene expression analyses identify a potential signature for tumor aggressiveness. Clin Cancer Res 2005; 11: 5128–39. [DOI] [PubMed] [Google Scholar]
- 18. Brasaemle DL, Barber T, Wolins NE et al. Adipose differentiation‐related protein is an ubiquitourly expressed lipid storage droplet‐associated protein. J Lipid Res 1997; 38: 2249–63. [PubMed] [Google Scholar]
- 19. Heid HW, Moll R, Schwetlick I, Rackwitz HR, Keenan TW. Adipophilin is a specific marker of lipid accumulation in diverse cell types and diseases. C ell Tissue Res 1998; 294: 309–21. [DOI] [PubMed] [Google Scholar]
- 20. Gao J, Serrero G. Adipose differentiation related protein (ADRP) expressed in transfected COS‐7 cells selectively stimulates long chain fatty acid uptake. J Biol Chem 1999; 274: 16 825–39. [DOI] [PubMed] [Google Scholar]
- 21. Frolov A, Petrescu A, Atshaves BP et al. High density lipoprotein‐mediated cholesterol uptake and targeting to lipid droplets in intact 1‐cell fibroblasts. A single‐ and multiphoton fluorescence approach. J Biol Chem 2000; 275: 12 769–80. [DOI] [PubMed] [Google Scholar]
- 22. Saarikoski ST, Rivera SP, Hankinsona O. Mitogen‐inducible gene 6 (MIG‐6), adipophilin and tuftelin are inducible by hypoxia. FEBS Lett 2002; 530: 186–90. [DOI] [PubMed] [Google Scholar]
- 23. Loercher AE, Tank EM, Delston RB, Harbour JW. MITF links differentiation with cell cycle arrest in melanocytes by transcriptional activation of INK4A. J Cell Biol 2005; 168: 35–40. [DOI] [PMC free article] [PubMed] [Google Scholar]
- 24. Grady B, Goharderakhshan R, Chang J et al. Frequently deleted loci on chromosome 9 may harbor several tumor suppressor genes in human renal cell carcinoma. J Urol 2001; 166: 1088–92. [PubMed] [Google Scholar]
- 25. Kawada Y, Nakamura M, Ishida E et al. Aberrations of the p14 (ARF) and p16 (INK4a) genes in renal cell carcinomas. Jpn J Cancer Res 2001; 92: 1293–9. [DOI] [PMC free article] [PubMed] [Google Scholar]
- 26. Busca R, Berra E, Gaggioli C et al. Hypoxia‐inducible factor 1{alpha} is a new target of microphthalmia‐associated transcription factor (MITF) in melanoma cells. J Cell Biol 2005; 170: 49–59. [DOI] [PMC free article] [PubMed] [Google Scholar]
- 27. Sukosd F, Kuroda N, Beothe T, Kaur AP, Kovacs G. Deletion of chromosome 3p14.2‐p25 involving the VHL and FHIT genes in conventional renal cell carcinoma. Cancer Res 2003; 63: 455–7. [PubMed] [Google Scholar]


