

Abstract
In previous studies, the gene expression profiles of two hamster pancreatic cancer cells with different potentials for invasion and metastasis were analyzed. In the present study, we identified that one of the genes expressed strongly in the highly metastatic cell line is hamster oxysterol binding protein‐related protein (ORP)‐5. The aim of the present study was to clarify the relationship between ORP5 and invasion and poor prognosis of human pancreatic cancer. Invasion assays were carried out in both hamster and human pancreatic cancer cells by suppressing the ORP5 gene with short interfering RNA or inducing its expression by introducing an expression vector. To evaluate the relationship between ORP5 and the characteristics of human pancreatic cancer, 56 pancreatic cancer tissue specimens were analyzed and the ORP5 expression in each pancreatic cancer tissue specimen was analyzed by immunohistochemistry. In both the hamster and human pancreatic cancer cells, suppression of ORP5 significantly reduced the invasion rate of the cells and induction of ORP5 significantly enhanced the invasion rate of the cells. In the clinical sample, the median survival times of the patients with ORP5‐positive (n = 33) and ORP5‐negative (n = 23) cancer were 8.3 and 17.2 months, respectively (P = 0.02). Also, the 1‐year survival rates of patients with ORP5‐positive and ORP5‐negative cancer were 36.4 and 73.9%, respectively (P = 0.005). The ORP5 expression level was related to both invasion and poor prognosis in human pancreatic cancer. These findings suggest that the expression of ORP5 may induce cancer cell invasion, resulting in the poor prognosis of pancreatic cancer. (Cancer Sci 2008; 99: 2387–2394)
Pancreatic cancer is one of the most malignant tumors. In most cases, patients are already at an advanced stage of the disease at the time of diagnosis. The main reason for the poor prognosis is not only that these cancers are difficult to detect by ultrasonography or computed tomography, but also that they exhibit great potential for invasion and metastasis. To establish an effective treatment strategy for pancreatic cancer, it is necessary to clarify the cellular and molecular mechanisms of invasion and metastasis in pancreatic cancer.
In our previous studies, we established two hamster pancreatic cancer cell lines with different potentials for invasion and metastasis: PC1, possessing a low potential for invasion and metastasis, and PC1.0, possessing a high potential for invasion and metastasis. These two cell lines were established from the same pancreatic ductal carcinoma induced by N‐nitrosobis (2‐oxopropyl) amine in a Syrian golden hamster.( 1 , 2 ) Moreover, PC1.0 cell lines were found to produce a soluble proteinaceous factor in the medium; this factor was found to induce cell dissociation and therefore we designated it the ‘dissociation factor’.( 3 , 4 , 5 ) We hypothesized that isolation of this factor might provide great insight into the molecular and cellular mechanisms of pancreatic cancer invasion and metastasis, and we therefore examined differences in the mRNA expression profiles of PC1 and PC1.0 using the representational difference analysis (RDA) method. We detected five gene fragments (clones) that were expressed at higher levels in the PC1.0 cells compared with the PC1 cells.( 6 ) We reported, in previous studies, the close association of cell dissociation with impairment of epidermal growth factor receptor signal transduction, which induces the MEK–ERK signaling pathway, resulting in disruption of the distribution of tight junctions.( 7 , 8 , 9 , 10 , 11 , 12 , 13 ) However, the abovementioned dissociation factor remains to be characterized.
In the present study, we isolated a new candidate gene associated with the potential for invasion of pancreatic cancer. One of the unknown gene fragments (clone 7) detected by RDA mentioned above was revealed to encode oxysterol binding protein‐related protein (ORP)‐5, which is a member of the ORP family.( 14 , 15 ) Oxysterol binding protein (OSBP) is a cytosolic mammalian protein that binds oxysterol ligand and interacts with Golgi membranes.( 16 , 17 , 18 , 19 , 20 ) It has been reported to be involved in vesicle transport, lipid metabolism, and signal transduction.( 21 , 22 , 23 , 24 , 25 , 26 , 27 , 28 ) However, the relationship between ORP5 and cancer has not been clarified.
The present study is the first to show that ORP5 is closely related to cancer invasion, and that high expression levels of ORP5 are associated with poor prognosis in human pancreatic cancer.
Materials and Methods
Cell lines and cell culture. The hamster pancreatic cancer cell lines PC1 and PC1.0, and human pancreatic cancer cell lines Capan1, Capan2, Hs700T, MiaPaCa2, and Panc1 (American Tissue Culture Collection, Rockville, MD, USA) were cultured in the recommended media supplemented with 10% fetal bovine serum (Gibco‐BRL, Grand Island, NY, USA), 100 U/mL penicillin G, and 100 µg/mL streptomycin at 37°C in a humidified atmosphere of 5% CO2 : 95% air.
cDNA library screening. Total RNA of PC1.0 was extracted using TRIzol (Invitrogen, Carlsbad, CA, USA) and treated with DNase to remove genomic DNA. Construction of the cDNA library was carried out according to the instruction manual of the ZAP‐cDNA Synthesis Kit (Stratagene, La Jolla, CA, USA). Five hundred thousand plaques were thus plated, and the labeled DNA fragments were screened and detected using ECL Direct Nucleic Acid Labelling and Detection System (GE Healthcare Buckinghamshire, UK). A single positive phage was plated on a LB medium‐kanamycin plate with an ExAssist helper phage and XLOLR cells (Stratagene). Plasmid DNA extraction was then carried out using a QIA filter Plasmid Maxi Kit (Qiagen, Valencia, CA, USA), and sequencing was carried out using the ABI 310 autosequencer (Applied Biosystems, Foster, CA, USA).
5′ Rapid amplification of cDNA ends. Amplification of the unknown 5′ end of the isolated novel gene was carried out according to the instruction manual of the 5′ Rapid Amplification of cDNA Ends (RACE) System (Invitrogen), and sequencing was carried out using the ABI 310 autosequencer.
Knockdown of hamster and human ORP5 using short interfering RNA. Complementary single‐stranded short interfering RNA (siRNA) molecules were annealed into duplexes at a final concentration of 20 µmol/L. Duplex siRNA was used against hamster ORP5 (CCG CUG AAU GGG UCU GCU UTT/AAG CAG ACC CAU UCA GCG GTT), hamster control (CCG AGU AGG UGU CGC UCU UTT/AAG AGC GAC ACC UAC UCG GTT), human ORP5 (UUC GUG AGG UAA GGA CCU GGU UCU G/CAG AAC CAG GUC CUU ACC UCA CGA A), and human control (UCU UGU UCU CCU CUG ACA CUG UCU C/GAG ACA GUG UCA GAG GAG AAC AAG A). RNA inhibition was carried out according to the standard protocol using Lipofectamine 2000 (Invitrogen). The cells transfected with hamster ORP5 siRNA were designated PC1.0‐ORP5, the cells transfected with hamster control siRNA were designated PC1.0‐control, the cells transfected with human ORP5 siRNA were designated Capan2‐ORP5, and the cells transfected with human control siRNA were designated Capan2‐control.
Construction of the hamster and human ORP5 expression vector, and stable transfection of ORP5. The primer sets for full‐length ORP5 amplification were as follows: hamster ORP5, 5′‐ATG AAG GAG GAG GCC TTT CT‐3′ (forward) and 5′‐TTT GAG GAT ATA GTT AAT GAA TAG‐3′ (reverse); and human ORP5, 5′‐ATG AAG GAG GAG GCC TTC CT‐3′ (forward) and 5′‐TTT GAG GAT GTG GTT AAT GAA CA‐3′ (reverse). The polymerase chain reaction products of hamster ORP5 and human ORP5 were cloned into the pcDNA3.1/V5‐His TOPO vector (Invitrogen). The expression vectors for hamster and human ORP5 were designated pcDNA/hamORP5 and pcDNA/huORP5, respectively. Also, the expression vector for LacZ, designated pcDNA/LacZ, was used as the control vector. For stable transfection, the cells were selected using 600 µg/mL G418 for 2 weeks and thereafter maintained in the presence of 300 µg/mL G418. PC1 transfected with pcDNA/hamORP5 was designated PC1 + ORP, and PC1 transfected with pcDNA/LacZ was designated PC1 + LacZ. Similarly, Hs700T transfected with pcDNA/huORP5 was designated Hs700T + ORP, and Hs700T transfected with pcDNA/LacZ was designated Hs700T + LacZ.
Detection of ORP5 expression by reverse transcription–polymerase chain reaction and western blotting. Total RNA extraction of siRNA‐ or expression vector‐transfected cells was carried out at 0, 24, 48, and 72 h after transfection using TRIzol along with DNase treatment. cDNA was synthesized using SuperScript III (Invitrogen), in accordance with the manufacturer's instructions. Reverse transcription–polymerase chain reaction (RT‐PCR) was carried out under the following conditions: initial denaturation at 94°C for 3 min, followed by 27 cycles of amplification (denaturation at 94°C for 30 s, annealing at 56°C for 30 s, and extension at 72°C for 30 s), and terminal extension at 72°C for 3 min. The primers used for the RT‐PCR amplification were as follows: hamster ORP5, 5′‐TGA AGC TTG TGC TAC GAT GG‐3′ (forward) and 5′‐TGT TCT TCT CGC ATG CGA TG‐3′ (reverse); human ORP5, 5′‐CTT CTA CAA GAA GCC CAA GG‐3′ (forward) and 5′‐GAG ATC TGG TTG ATG CTG GT‐3′ (reverse); and hamster and human glyceraldehyde‐3‐phosphate dehydrogenase (GAPDH), 5′‐TGA CCA CAG TCC ATG CCA TC‐3′ (forward) and 5′‐CCA CCC TGT TGC TGT AGC C‐3′ (reverse).
Protein extraction from the siRNA‐ or expression vector‐transfected cells was carried out at 0, 24, 48, and 72 h after the transfection using cell lysis buffer (25 mmol/L Tris, 100 mmol/L NaCl, 2 mmol/L ethlenediamine tetra‐acetic acid (EDTA), 1% Triton‐X) containing protease inhibitor and phosphatase inhibitor. A total of 30 µg protein was loaded on to a 10% sodium dodecylsulfate–polyacrylamide gel electrophoresis gel and then transferred to a polyvinylidene difluoride (PVDF) membrane. The membrane was blocked with 5% skim milk (BD, Franklin Lakes, NJ, USA) in Tris‐buffered saline (TBS)–Tween 20 (0.1%) at room temperature for 1 h and then incubated with polyclonal goat anti‐ORP5 antibody (Imgenex, San Diego, CA, USA), β‐actin antibody (Cell Signaling Technology, Beverly, MA, USA), or V5 antibody (Invitrogen) for 1 h at room temperature. The membrane was then rinsed twice for 10 min each with TBS–Tween 20 and incubated with antigoat secondary antibody (Santa Cruz Biotechnology, Santa Cruz, CA, USA) for 45 min at room temperature. The membrane was rinsed twice more for 10 min each with TBS–Tween 20 and once for 10 min with TBS, incubated with ECL‐Plus (GE Healthcare, Buckinghamshire, UK), and then exposed to X‐ray film and developed.
Invasion assay. To examine the invasiveness of the cell lines, we used a Matrigel invasion chamber (Becton Dickinson Labware, Bedford, MA, USA). The PC1.0‐ORP5, PC1.0‐control, Capan2‐ORP5, and Capan2‐control cells were plated 5 × 10⁴ cells/well in a 24‐well Matrigel invasion chamber in the presence of a chemoattractant. The cell counts of the invading cells were determined 22 h after seeding. Assays to determine the invasiveness of PC1 + ORP, PC1 + LacZ, Hs700T + ORP5, and Hs700T + LacZ cells were carried out in the same manner.
Human pancreatic cancer tissue samples. From 1982 to 2001, primary pancreatic cancer patients who underwent detailed pathological analyses and regular follow up at the Kumamoto University Hospital were recruited into this study. Patients who had metastasis at the time of the operation, did not have curative operation, or received preoperative treatment, such as chemotherapy or radiation therapy, were excluded from the study. Analysis for ORP5 expression by immunohistochemistry was carried out in a total of 56 specimens of pancreatic cancer. Based on the results of the pathological analyses, the cancers were classified according to the Japanese Classification System.( 29 ) All patients provided written informed consent prior to participation in the study after receiving a thorough explanation of the purpose and method of the study, which was approved by the Institutional Review Board of Kumamoto University, Japan.
Immunohistochemical staining for ORP5. Paraffin‐embedded tissue sections were deparaffinized in xylene, rehydrated in progressively decreasing concentrations of ethanol, and rinsed with ultrapure water. Antigen retrieval was carried out by boiling the tissue sections in 10 mmol/L sodium citrate buffer (pH = 6.0) at 121°C for 15 min in an autoclave. Thereafter, the slides were rinsed with ultrapure water and endogeneous peroxidase was blocked with a 3% hydrogen peroxide solution in 100% methanol for 30 min, followed by two rinses for 5 min each with phosphate‐buffered saline (PBS). Non‐specific protein binding was blocked with 5% skim milk in PBS for 30 min at room temperature. After draining off the skim milk solution, polyclonal goat anti‐ORP5 antibody was added at a dilution of 1 : 50, followed by incubation overnight at 4°C. Then, after two rinses for 5 min each with PBS, biotinylated antigoat IgG was added at a dilution of 1:50, followed by incubation for 30 min. The sections were rinsed twice with PBS, and Vectastain Elite ABC Reagent (Vector Laboratories, Burlingame, CA, USA) was added for 30 min. The sections were rinsed again twice with PBS and incubated with the 3,3′‐diaminobenzidine tetrahydrochloride (DAB+) Liquid System (Dako, Glostrup, Denmark) for 10 min. Finally, the sections were rinsed and counterstained with hematoxylin solution.
The ORP5 was weakly expressed in the acinar cells of the pancreas and the expression levels of ORP5 in the pancreatic cancer specimens were analyzed by comparison with those in the acinar cells. The expression status of ORP5 was specified as follows: (1) ORP5‐negative: the staining intensity in pancreatic cancer tissue was less than that in the acinar cells, and (2) ORP5‐positive: the staining intensity in pancreatic cancer tissue was greater than that in the acinar cells.
Statistical analysis. The data analyses were carried out using StatView Ver. 5 for Windows (Abacus Concepts, Inc., Berkeley, CA). The invasion assay was analyzed by two‐sided Student's t‐test. The statistical differences in the expression levels of ORP5 and the pathological characteristics were determined by the chi‐square test. Overall survival was calculated from the date of surgical operation to the date of death. Data were plotted to obtain Kaplan‐Meier curves, and the median survival time and one‐year survival rate were analyzed by the Breslow‐Gehan‐Wilcoxon test. Values of P < 0.05 were considered to be statistically significant.
Results
Isolation of the unknown gene. In our previous report, five clones were either specifically or highly expressed in the PC1.0 cells compared with the PC1 cells,( 6 ) and three of these clones showed no significant homology with known genes. By library screening and 5′ RACE, we successfully isolated one clone (clone 7) with an open reading frame of 2637 nucleotides and 878 amino acids. These sequence data have been submitted to the DNA Data Bank of Japan, European Molecular Biology Laboratory, and GenBank databases under accession number EU475903. According to the database, this gene was found to exhibit 93% homology at the nucleotide level and 95% homology at the amino acid level to mouse ORP5, and 86% homology at the nucleotide level and 85% homology at the amino acid level to human ORP5 (Fig. 1).
Figure 1.
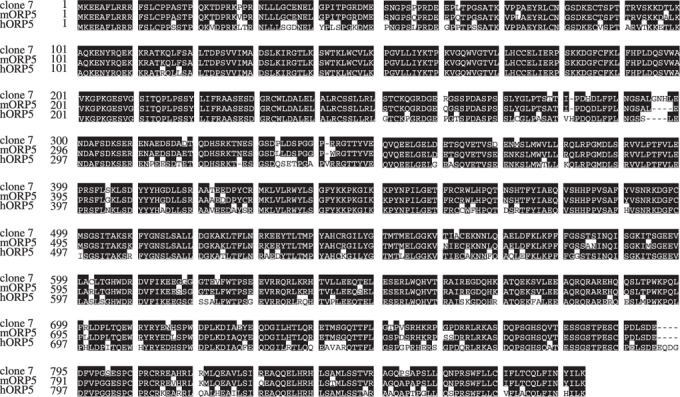
Homology of clone 7 and mouse human oxysterol binding protein‐related protein (ORP)‐5. Open reading frame of clone 7 consisting of 878 amino acids. Clone 7 was found to exhibit 95% homology at the amino acid level to mouse ORP5 (mORP5), and 85% homology at the amino acid level to human ORP5 (hORP5).
ORP5 suppression and induction. Strong expression of ORP5 mRNA was found in the PC1.0, Capan1, Capan2, and Panc1 cells, moderate expression was found in the MiaPaCa2 cells, and weak expression was found in the PC1 and Hs700T cells. A similar expression pattern was observed at the protein level (Fig. 2a,b). For the expression patterns of human ORP5, Capan2 and Hs700T cells were used as human pancreatic cancer cell lines showing high and low expression levels of ORP5, respectively. Transfection of ORP5 siRNA into PC1.0 and Capan2 cells resulted in a significant decrease in the expression level of ORP5 at 48–72 h after the transfection. However, there was no significant difference in the expression level of ORP5 between PC1.0 cells and PC1.0 cells transfected with control siRNA, or between Capan2 cells and Capan2 cells transfected with control siRNA (Fig. 2a,c). Transfection of pcDNA/hamORP5 into PC1 cells or of pcDNA/huORP5 into Hs700T cells resulted in a significant increase in the expression level of ORP5 at 24–72 h after the transfection. However, there was no difference in the ORP5 expression level between PC1 cells and PC1 cells transfected with pcDNA/LacZ, or between Hs700T cells and Hs700T cells transfected with pcDNA/LacZ (Fig. 2a,c). The ORP5 stable transfectant cells (PC1 + ORP5 or Hs700T + ORP5) showed high expression levels of ORP5, whereas the LacZ stable transfectant cells (PC1 + LacZ or Hs700T + LacZ) showed weak expression of ORP5 (Fig. 2d). Cell growth and morphology did not change after ORP5 suppression or induction (data not shown).
Figure 2.
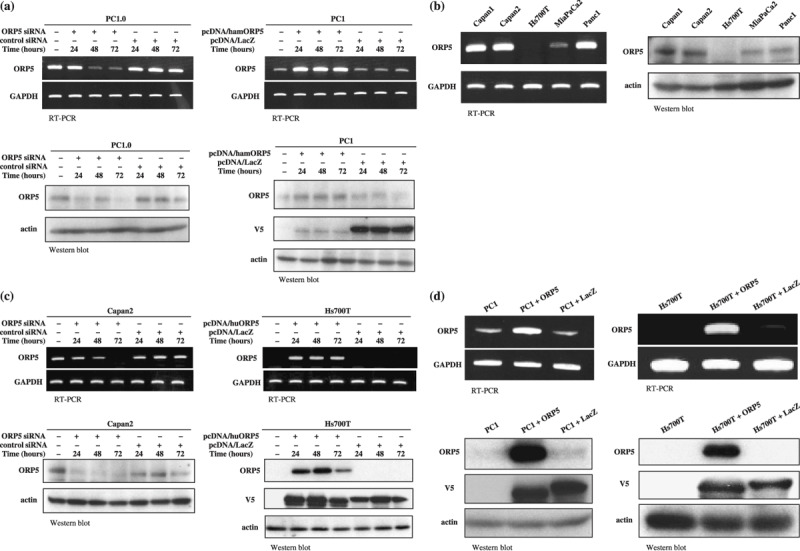
Expression levels of oxysterol binding protein‐related protein (ORP)‐5 in hamster and human pancreatic cancer cell lines. PC1 was hamster pancreatic cancer cell line with a low potential for invasion and metastasis, and PC1.0 was hamster pancreatic cancer cell line with a high potential for invasion and metastasis. (a) ORP5 expression in the hamster pancreatic cancer cell lines PC1.0 and PC1 after transfection of short interfering RNA (siRNA) or expression vector. ORP5 was expressed at a high level in the PC1.0 cells and at a low level in the PC1 cells, at both the mRNA and protein levels. Transfection of ORP5 siRNA into PC1.0 cells resulted in a significant decrease in the expression level of ORP5 at 48–72 h after transfection. Transfection of pcDNA/hamORP5 into PC1 cells resulted in a significant increase in the expression level of ORP5 at 24–72 h after transfection. (b) The expression levels of ORP5 in human pancreatic cancer cell lines. At both the mRNA and protein level, ORP5 was expressed at a high level in Capan1, Capan2, and Panc1 cells, at a moderate level in the MiaPaCa2 cells, and at a low level in the Hs700T cells. (c) ORP5 expression in the human pancreatic cancer cell lines Capan2 and Hs700T after transfection of siRNA or expression vector. ORP5 was expressed at a high level in the Capan2 cells, but at a low level in the Hs700T cells, at both the mRNA and protein levels. Transfection of ORP5 siRNA into Capan2 cells resulted in a significant decrease in the expression level of ORP5 at 48–72 h after transfection. Transfection of pcDNA/huORP5 into Hs700T cells resulted in a significant increase in the expression level of ORP5 at 24–72 h after transfection. (d) The ORP5 stable transfectant cells (PC1 + ORP5 or Hs700T + ORP5) showed high expression levels of ORP5, and the LacZ stable transfectant cells (PC1 + LacZ or Hs700T + LacZ) showed low expression levels of ORP5. GAPDH, glyceraldehyde 3‐phosphate dehydrogenase; RT‐PCR, reverse transcription–polymerase chain reaction.
Invasion assay of PC1.0, PC1, Capan2, and Hs700T cells after suppression or induction of ORP5. Cell dissociation and migration would be the initial step for invasion. Therefore, we investigated the invasiveness of the pancreatic cancer cells after suppression or induction of ORP5. The invasive cell count in each cell line was compared with that in untreated cells. The invasion cell rates in the untreated PC1.0, PC1.0‐ORP5, and PC1.0‐control cells were (mean ± SD) 100.0 ± 42.3, 27.1 ± 21.3, and 81.9 ± 25.9%, respectively. ORP‐5 suppression resulted in a significant decrease in cell invasion compared with untreated PC1.0 (P < 0.0001) and PC1.0‐control cells (P = 0.0005) (Fig. 3a). An invasion assay was also carried out for PC1, PC1 + ORP, and PC1 + LacZ. The cell invasion rates in the untreated PC1, PC1 + ORP, and PC1 + LacZ cells were (mean ± SD) 100.0 ± 20.5, 385.1 ± 35.2, and 104.3 ± 19.5%, respectively. ORP5 induction resulted in a significant increase in cell invasion compared with untreated PC1 (P < 0.0001) and PC1 + LacZ cells (P < 0.0001) (Fig. 3b).
Figure 3.
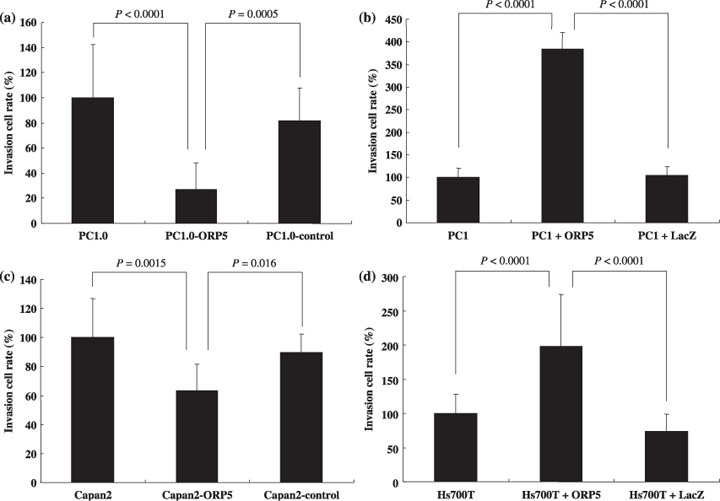
Invasion assays of hamster and human pancreatic cancer cell lines after suppression or induction of oxysterol binding protein‐related protein (ORP)‐5. (a) ORP‐5 suppression (PC1.0‐ORP5) significantly decreased the invasion cell rate compared with untreated PC1.0 (P < 0.0001) and PC1.0‐control cells (P = 0.0005). (b) ORP5 induction (PC1 + ORP5) significantly increased the invasion cell rate compared with untreated PC1 (P < 0.0001) and PC1 + LacZ cells (P < 0.0001). (c) ORP‐5 suppression (Capan2‐ORP5) significantly decreased the invasion cell rate compared with untreated Capan2 (P = 0.0015) and Capan2‐control cells (P = 0.016). (d) ORP5 induction (Hs700T + ORP5) significantly increased the invasion cell rate compared with untreated Hs700T (P < 0.0001) and Hs700T + LacZ cells (P < 0.0001). All results are expressed as invasion cell rate ± SD from three separate experiments.
The invasiveness of human pancreatic cancer cells was also analyzed. The invasion cell rates in untreated Capan2, Capan2‐ORP5, and Capan2‐control cells were (mean ± SD) 100.0 ± 26.9, 63.3 ± 18.2, and 89.5 ± 12.8%, respectively. ORP‐5 suppression resulted in a significant decrease in the invasion of cells compared with untreated Capan2 (P = 0.0015) and Capan2‐control cells (P = 0.016) (Fig. 3c). The invasion cell rates in the untreated Ha700T, Hs700T + ORP, and Hs700T + LacZ cells were (mean ± SD) 100.0 ± 28.3, 198.4 ± 75.4, and 74.0 ± 24.9%, respectively. ORP5 induction resulted in a significant increase in the invasion of cells compared with untreated Hs700T (P < 0.0001) and Hs700T + LacZ cells (P < 0.0001) (Fig. 3d).
Pathological analyses of ORP5 expression levels. Among the 56 pancreatic cancer specimens analyzed, 33 were judged to be ORP5 positive and 23 to be ORP5 negative (Fig. 4; Table 1). With regard to regional invasion, the differences between the ORP5‐positive cancers and ORP5‐negative cancers were not significant (Table 1). With regard to the surgical margin, 6 of the 32 ORP5‐positive pancreatic cancers (18.8%) showed a positive surgical margin whereas none of the 21 ORP5‐negative cancers showed a positive surgical margin. A significant difference was seen between the ORP5‐positive cancers and ORP5‐negative cancers in terms of the positivity of the surgical margin (P = 0.02). In the case of a positive surgical margin, the cancer was more invasive to veins (v+; 6/6), nerves (ne+; 6/6), and lymphoducts (ly; 5/6), and few invaded the main pancreas duct (mpd; 1/6).
Figure 4.
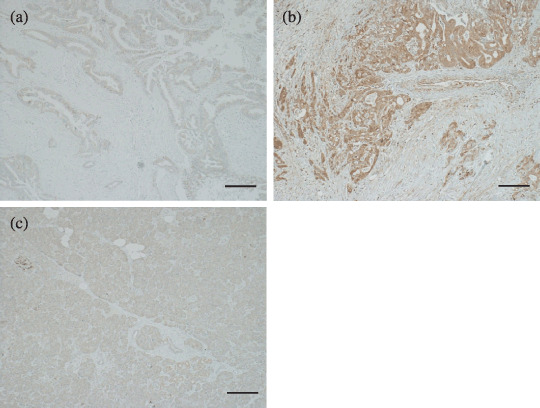
Immunohistochemical staining of oxysterol binding protein‐related protein (ORP)‐5. The expression level of ORP5 in pancreatic cancer specimens was analyzed in comparison with that in the acinar cells of the pancreas. (a) ORP5‐negative pancreatic cancer tissue. (b) ORP5‐positive pancreatic cancer tissue. ORP5 was highly expressed in the cytoplasm of cancer cells. (c) Weak expression of ORP5 in the acinar cells of the pancreas. Scale bar = 100 µm.
Table 1.
Pathological characteristics of patients
| Characteristics | ORP5 posotive(n = 33) | ORP5 negative(n = 23) | P‐value |
|---|---|---|---|
| Regional invasive factor | |||
| Invasion to the common bile duct in pancreas | 0.42 | ||
| – | 18 | 10 | |
| + | 15 | 13 | |
| Invasion to the duodenum | 0.76 | ||
| – | 18 | 12 | |
| + | 14 | 11 | |
| Invasion to the serosal surface of the pancreas | 0.16 | ||
| – | 11 | 12 | |
| + | 22 | 11 | |
| Invasion to the retroperitoneal surface of the pancreas | 0.18 | ||
| – | 9 | 3 | |
| + | 23 | 20 | |
| Invasion to the intrapancreatic portal vein | 0.64 | ||
| – | 18 | 14 | |
| + | 15 | 9 | |
| Invasion to the artery | 0.39 | ||
| – | 30 | 20 | |
| + | 2 | 3 | |
| Invasion to the main pancreatic duct | 0.10 | ||
| – | 20 | 16 | |
| + | 12 | 3 | |
| Lymphatic invasion | 0.37 | ||
| – | 5 | 6 | |
| + | 26 | 17 | |
| Venous invasion | 0.30 | ||
| – | 6 | 2 | |
| + | 26 | 21 | |
| Neural invasion in pancreas | 0.27 | ||
| – | 4 | 1 | |
| + | 26 | 22 | |
| Surgical margin factor | |||
| Surgical margin of pancreas | 0.02 | ||
| – | 21 | 21 | |
| + | 6 | 0 | |
| Surgical margin of bile duct | 0.19 | ||
| – | 25 | 14 | |
| + | 0 | 1 | |
| Surgical margin of detachment of pancreas | 0.59 | ||
| – | 18 | 15 | |
| + | 13 | 8 | |
| Lymph node metastasis | 0.14 | ||
| – | 8 | 2 | |
| + | 25 | 21 | |
Pathological analyses were classified according to the Japanese Classification System. The statistical differences between the expression level of oxysterol binding protein‐related protein (ORP)‐5 and the pathological characteristics were determined by χ2‐test. Values of P < 0.05 were considered statistically significant.
One‐year survival rate and overall survival of the patients with ORP5‐positive and ORP5‐negative cancer. Overall survival was calculated from the date of surgical operation to the date of death and data were plotted to obtain Kaplan–Meier curves. The median survival times of all of the patients with ORP5‐positive and ORP5‐negative cancers were 8.3 and 17.2 months, respectively (Fig. 5a), the difference being significant (P = 0.02). The 1‐year survival rates of patients with ORP5‐positive and ORP5‐negative cancers were 36.4 and 73.9%, respectively, the difference again being significant (P = 0.005). Meanwhile, the 3‐year survival rate of the patients with ORP5‐positive cancer and ORP5‐negative cancer were 6.1 and 8.7%, respectively, the difference not being significant. Overall survival was analyzed in the case of stage I, II, and III pancreatic cancer (Fig. 5b). The median survival times of the patients with stage I, II, and III pancreatic cancer grouped by ORP5‐positive and ORP5‐negative were 6.7 and 22.4 months, respectively, the difference being significant (P = 0.018). Overall survival was also analyzed in the case of stage IVa and IVb pancreatic cancer (Fig. 5c). The median survival times of the patients with stage IVa and IVb pancreatic cancer grouped as ORP5‐positive and ORP5‐negative were 9.6 and 14.8 months, respectively, the difference not being significant (P = 0.27).
Figure 5.
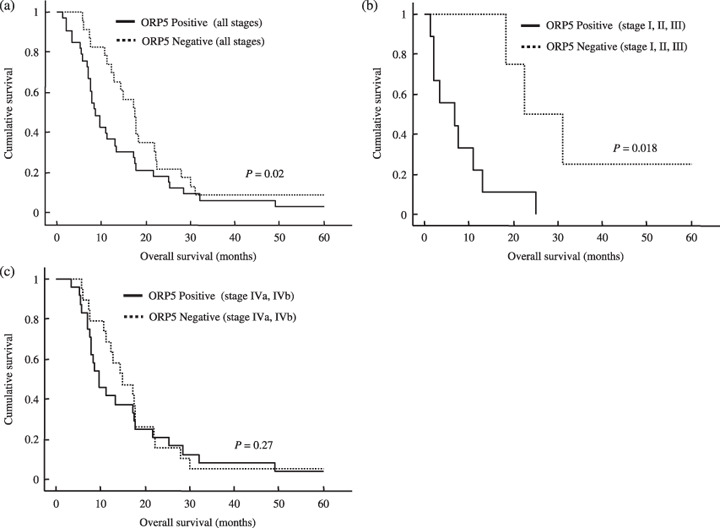
Overall survival stratified by oxysterol binding protein‐related protein (ORP)‐5 expression status. (a) Kaplan–Meier plot of overall survival of all patients with pancreatic cancer grouped by ORP5 expression status (ORP5‐positive and ORP5‐negative). The median survival times of the patients with ORP5‐positive cancer (n = 33) and ORP5‐negative cancer (n = 23) were 8.3 and 17.2 months, respectively, and the 1‐year survival rates were 36.4 and 73.9%, respectively. (b) Kaplan–Meier plot of overall survival of patients with stage I, II, and III of pancreatic cancer grouped by ORP5 expression status. The median survival times of the patients with ORP5‐positive cancer (n = 9) and ORP5‐negative cancer (n = 4) were 6.7 and 22.4 months, respectively. (c) Kaplan–Meier plot of overall survival of patients with stage IVa and IVb pancreatic cancer grouped by ORP5 expression status. The median survival times of patients with ORP5‐positive cancer (n = 24) and ORP5‐negative cancer (n = 19) were 9.6 and 14.8 months, respectively.
Discussion
Recently, many reports have been published concerning the mechanisms of actions of OSBP and the ORP family. ORP5 is a member of the ORP family, which has been reported to be encoded by 12 genes in humans.( 14 , 15 ) OSBP is the first protein identified as a receptor for the endogenous oxysterols,( 16 , 17 ) and it has been cloned and reported to be conserved from Saccharomyces cerevisiae to Homo sapiens.( 30 , 31 , 32 ) OSBP is a mammalian cytosolic protein that binds to 25‐hydroxycholesterol and translocates to the membranes of the Golgi apparatus.( 18 , 19 , 20 ) This membrane interaction is mediated by the pleckstrin homology (PH) domain located in the N‐terminal region of the protein.( 33 , 34 , 35 , 36 ) OSBP has been reported to be involved in vesicle transport, lipid metabolism, and signal transduction.( 21 , 22 , 23 , 24 , 25 , 26 , 27 , 28 )
Although these molecules are now one of the main subjects of study in the field of lipid metabolism, we detected one of these genes (ORP5) in a very different context. In a recent study, we compared two hamster pancreatic cancer cell lines with different potentials for invasion and metastasis, detected five mRNA fragments expressed differentially in these cells by RDA,( 6 ) and identified one of these genes as ORP5. There are several reports concerning the relationship of ORP with malignancy, including chronic myeloid leukemia,( 37 ) B‐cell lymphoma,( 38 , 39 , 40 , 41 ) testicular cancer,( 42 , 43 , 44 ) and cholangiocarcinoma.( 45 ) It has been demonstrated that ORP8 is expressed at a higher level in hamster cholangiocarcinoma compared with normal liver.( 45 ) It is worthy of note that ORP5 and ORP8 belong to the same subfamily that carries a putative transmembrane domain sequence at the C‐terminal end;( 14 , 15 ) however, the relationship between ORP8 and cancer progression or cancer invasion has not yet been assessed. To the best of our knowledge, this is the first report to demonstrate a clear relationship between one of the ORP family genes and cancer invasion, and also that the expression of this molecule is related to survival in cancer patients.
We demonstrated a clear relationship between ORP5 expression and cancer invasion in vitro (Fig. 3). Unexpectedly, however, there was no significant difference between ORP5‐positive cancer and ORP5‐negative cancer among human pancreatic cancer tissue specimens in terms of the regional invasive factor (Table 1). One of the reasons for this could be that almost all of the pancreatic cancer tissue specimens in the present study were positive for regional invasive factor. In cases with a positive surgical margin, all of the patients were ORP5‐positive and the cancer tissue specimens tended to be positive for regional invasive factor, except the main pancreas duct (mpd+; 1/6). This result lends support to the idea that ORP5 is related to invasion in human pancreatic cancer.
With regard to survival, the 2‐year, 3‐year, and 5‐year survival rates were 15.2, 6.1, and 3.0% in ORP5‐positive cancer, and 21.7, 8.7, and 8.7% in ORP5‐negative cancer (Fig. 5a). Although the long‐term survival rate tended to be better in the ORP5‐negative group, the difference was not significant. However, the 1‐year survival rate and median survival time were 73.9% and 17.2 months, respectively, in the ORP5‐positive group, and 36.4% and 8.3 months, respectively, in the ORP5‐negative group. Significant differences were observed in the 1‐year survival rate (P = 0.005) and median survival time (P = 0.02) between the two groups. In particular, as pancreatic cancer is a type of cancer with poor prognosis compared to other cancers, it is noteworthy that the median survival time of the ORP5‐negative group was longer than that of the ORP5‐positive group by 8.9 months. Furthermore, in the case of stage I, II, and III pancreatic cancer, the ORP5‐negative group had a better prognosis than the ORP5‐positive group (Fig. 5b). From these results, although the mechanisms of ORP5 expression in cancer invasion are still not very clear, we concluded that this molecule is related to cancer invasion, and is associated with a high invasion rate to the main pancreas duct, which eventually leads to early relapse and short survival.
In the present study, it was of interest that ORP5, which was isolated from a hamster pancreatic cancer cell line with a high potential for invasion and metastasis, is related to the invasion and poor prognosis of human pancreatic cancer. Before evaluating pancreatic cancer samples, we assessed normal human samples by immunohistochemistry. The expression patterns of ORP5 were as follows: (1) no expression in heart and muscle; (2) slight expression in purkinje cells of the brain, parts of the spleen and kidney, acinar cells of the pancreas, and epithelial cells of the lung; and (3) strong expression in the liver (data not shown). Unfortunately, we assume that targeting this molecule directly for cancer therapy is not possible.
Further investigations are necessary to elucidate the mechanism regulating pancreatic cancer invasion and metastasis. Isolation of the other two unknown genes may provide valuable insight into the signal transduction processes involved in invasion and metastasis. Furthermore, these results could pave the way for the development of new therapeutic methods based on inhibition of target genes related to tumor cell invasion and metastasis.
Acknowledgments
The present study was supported by a Grant‐in‐Aid from the Ministry of Education, Culture, and Science of Japan.
References
- 1. Pour PM, Egami H, Takiyama Y. Patterns of growth and metastases of induced pancreatic cancer in relation to the prognosis and its clinical implications. Gastroenterology 1991; 100: 529–36. [DOI] [PubMed] [Google Scholar]
- 2. Egami H, Takiyama Y, Cano M, Houser WH, Pour PM. Establishment of hamster pancreatic ductal carcinoma cell line (PC‐1) producing blood group‐related antigens. Carcinogenesis 1989; 10: 861–9. [DOI] [PubMed] [Google Scholar]
- 3. Egami H, Tomioka T, Tempero M, Kay D, Pour PM. Development of intrapancreatic transplantable model of pancreatic duct adenocarcinoma in Syrian golden hamsters. Am J Pathol 1991; 138: 557–61. [PMC free article] [PubMed] [Google Scholar]
- 4. Hirota M, Egami H, Corra S et al . Production of scatter factor‐like activity by a nitrosamine‐induced pancreatic cancer cell line. Carcinogenesis 1993; 14: 259–64. [DOI] [PubMed] [Google Scholar]
- 5. Kurizaki T, Egami H, Hirota M et al . Characterization of cancer cell dissociation factor in a highly invasive pancreatic cancer cell line. Cancer 1995; 75: 1554–61. [DOI] [PubMed] [Google Scholar]
- 6. Ishikawa S, Egami H, Kurizaki T et al . Identification of genes related to invasion and metastasis in pancreatic cancer by cDNA representational difference analysis. J Exp Clin Cancer Res 2003; 22: 299–306. [PubMed] [Google Scholar]
- 7. Tan X, Egami H, Kamohara H et al . Involvement of the mitogen‐activated protein kinase kinase 2 in the induction of cell dissociation in pancreatic cancer. Int J Oncol 2004; 24: 65–73. [PubMed] [Google Scholar]
- 8. Tan X, Egami H, Ishikawa S et al . Relationship between the expression of extracellular signal‐regulated kinase 1/2 and the dissociation of pancreatic cancer cells: involvement of ERK1/2 in the dissociation status of cancer cells. Int J Oncol 2004; 24: 815–20. [PubMed] [Google Scholar]
- 9. Tan X, Tamori Y, Egami H et al . Analysis of the invasion–metastasis mechanism in pancreatic cancer: involvement of tight junction transmembrane protein occludin and MEK/ERK signal transduction pathway in cancer cell dissociation. Oncol Rep 2004; 11: 993–8. [PubMed] [Google Scholar]
- 10. Tan X, Egami H, Ishikawa S et al . Relationship between activation of epidermal growth factor receptor and cell dissociation in pancreatic cancer. Int J Oncol 2004; 25: 1303–9. [PubMed] [Google Scholar]
- 11. Tan X, Egami H, Ishikawa S et al . Arrangement of expression and distribution of tight junction protein claudin‐1 in cell dissociation of pancreatic cancer cells. Int J Oncol 2004; 25: 1567–74. [PubMed] [Google Scholar]
- 12. Tan X, Egami H, Ishikawa S et al . Involvement of matrix metalloproteinase‐7 in invasion–metastasis through induction of cell dissociation in pancreatic cancer. Int J Oncol 2005; 26: 1283–9. [PubMed] [Google Scholar]
- 13. Tan X, Egami H, Ishikawa S, Kurizaki T, Hirota M, Ogawa M. Zonula occludens‐1 (ZO‐1) redistribution is involved in the regulation of cell dissociation in pancreatic cancer cells. Dig Dis Sci 2005; 50: 1402–9. [DOI] [PubMed] [Google Scholar]
- 14. Lehto M, Laitinen S, Chinetti G et al . The OSBP‐related protein family in humans. J Lipid Res 2001; 42: 1203–13. [PubMed] [Google Scholar]
- 15. Jaworski CJ, Moreira E, Li A, Lee R, Rodriguez IR. A family of 12 human genes containing oxysterol‐binding domains. Genomics 2001; 78: 185–96. [DOI] [PubMed] [Google Scholar]
- 16. Taylor FR, Saucier SE, Shown EP, Parish EJ, Kandutsch AA. Correlation between oxysterol binding to a cytosolic binding protein and potency in the repression of hydroxymethylglutaryl coenzyme A reductase. J Biol Chem 1984; 259: 12 382–7. [PubMed] [Google Scholar]
- 17. Taylor FR, Kandutsch AA. Oxysterol binding protein. Chem Phys Lipids 1985; 38: 187–94. [DOI] [PubMed] [Google Scholar]
- 18. Ridgway ND, Dawson PA, Ho YK, Brown MS, Goldstein JL. Translocation of oxysterol binding protein to Golgi apparatus triggered by ligand binding. J Cell Biol 1992; 116: 307–19. [DOI] [PMC free article] [PubMed] [Google Scholar]
- 19. Perry RJ, Ridgway ND. Oxysterol‐binding protein and vesicle‐associated membrane protein‐associated protein are required for sterol‐dependent activation of the ceramide transport protein. Mol Biol Cell 2006; 17: 2604–16. [DOI] [PMC free article] [PubMed] [Google Scholar]
- 20. Suchanek M, Hynynen R, Wohlfahrt G et al . The mammalian oxysterol‐binding protein‐related proteins (ORPs) bind 25‐hydroxycholesterol in an evolutionarily conserved pocket. Biochem J 2007; 405: 473–80. [DOI] [PMC free article] [PubMed] [Google Scholar]
- 21. Hynynen R, Laitinen S, Kakela R et al . Overexpression of OSBP‐related protein 2 (ORP2) induces changes in cellular cholesterol metabolism and enhances endocytosis. Biochem J 2005; 390: 273–83. [DOI] [PMC free article] [PubMed] [Google Scholar]
- 22. Lehto M, Olkkonen VM. The OSBP‐related proteins: a novel protein family involved in vesicle transport, cellular lipid metabolism, and cell signalling. Biochim Biophys Acta 2003; 1631: 1–11. [DOI] [PubMed] [Google Scholar]
- 23. Wang PY, Weng J, Anderson RG. OSBP is a cholesterol‐regulated scaffolding protein in control of ERK 1/2 activation. Science 2005; 307: 1472–6. [DOI] [PubMed] [Google Scholar]
- 24. Im YJ, Raychaudhuri S, Prinz WA, Hurley JH. Structural mechanism for sterol sensing and transport by OSBP‐related proteins. Nature 2005; 437: 154–8. [DOI] [PMC free article] [PubMed] [Google Scholar]
- 25. Massey JB. Membrane and protein interactions of oxysterols. Curr Opin Lipidol 2006; 17: 296–301. [DOI] [PubMed] [Google Scholar]
- 26. Fairn GD, Curwin AJ, Stefan CJ, McMaster CR. The oxysterol binding protein Kes1p regulates Golgi apparatus phosphatidylinositol‐4‐phosphate function. Proc Natl Acad Sci USA 2007; 104: 15 352–7. [DOI] [PMC free article] [PubMed] [Google Scholar]
- 27. Lessmann E, Ngo M, Leitges M, Minguet S, Ridgway ND, Huber M. Oxysterol‐binding protein‐related protein (ORP) 9 is a PDK‐2 substrate and regulates Akt phosphorylation. Cell Signal 2007; 19: 384–92. [DOI] [PubMed] [Google Scholar]
- 28. Yan D, Lehto M, Rasilainen L et al . Oxysterol binding protein induces upregulation of SREBP‐1c and enhances hepatic lipogenesis. Arterioscler Thromb Vasc Biol 2007; 27: 1108–14. [DOI] [PubMed] [Google Scholar]
- 29. Japan Pancreas Society . Classification of Pancreatic Carcinoma, 2nd English edn. Tokyo: Kanehara & Co., 2003. [Google Scholar]
- 30. Dawson PA, Ridgway ND, Slaughter CA, Brown MS, Goldstein JL. cDNA cloning and expression of oxysterol‐binding protein, an oligomer with a potential leucine zipper. J Biol Chem 1989; 264: 16 798–803. [PubMed] [Google Scholar]
- 31. Levanon D, Hsieh CL, Francke U et al . cDNA cloning of human oxysterol‐binding protein and localization of the gene to human chromosome 11 and mouse chromosome 19. Genomics 1990; 7: 65–74. [DOI] [PubMed] [Google Scholar]
- 32. Olkkonen VM, Levine TP. Oxysterol binding proteins: in more than one place at one time? Biochem Cell Biol 2004; 82: 87–98. [DOI] [PubMed] [Google Scholar]
- 33. Lagace TA, Byers DM, Cook HW, Ridgway ND. Altered regulation of cholesterol and cholesteryl ester synthesis in Chinese hamster ovary cells overexpressing the oxysterol‐binding protein is dependent on the pleckstrin homology domain. Biochem J 1997; 326: 205–13. [DOI] [PMC free article] [PubMed] [Google Scholar]
- 34. Levine TP, Munro S. The pleckstrin homology domain of oxysterol‐binding protein recognises a determinant specific to Golgi membranes. Curr Biol 1998; 8: 729–39. [DOI] [PubMed] [Google Scholar]
- 35. Balla A, Tuymetova G, Tsiomenko A, Varnai P, Balla T. A plasma membrane pool of phosphatidylinositol 4‐phosphate is generated by phosphatidylinositol 4‐kinase type‐III alpha: studies with the PH domains of the oxysterol binding protein and FAPP1. Mol Biol Cell 2005; 16: 1282–95. [DOI] [PMC free article] [PubMed] [Google Scholar]
- 36. Wang PY, Weng J, Lee S, Anderson RG. The N terminus controls sterol binding while the C terminus regulates the scaffolding function of OSBP. J Biol Chem 2008; 283: 8034–45. [DOI] [PubMed] [Google Scholar]
- 37. Pizzatti L, Sa LA, De Souza JM, Bisch PM, Abdelhay E. Altered protein profile in chronic myeloid leukemia chronic phase identified by a comparative proteomic study. Biochim Biophys Acta 2006; 1764: 929–42. [DOI] [PubMed] [Google Scholar]
- 38. Ando T, Suguro M, Kobayashi T, Seto M, Honda H. Multiple fuzzy neural network system for outcome prediction and classification of 220 lymphoma patients on the basis of molecular profiling. Cancer Sci 2003; 94: 906–13. [DOI] [PMC free article] [PubMed] [Google Scholar]
- 39. Sander B, Flygare J, Porwit‐Macdonald A et al . Mantle cell lymphomas with low levels of cyclin D1 long mRNA transcripts are highly proliferative and can be discriminated by elevated cyclin A2 and cyclin B1. Int J Cancer 2005; 117: 418–30. [DOI] [PubMed] [Google Scholar]
- 40. Chng WJ, Schop RF, Price‐Troska T et al . Gene‐expression profiling of Waldenstrom macroglobulinemia reveals a phenotype more similar to chronic lymphocytic leukemia than multiple myeloma. Blood 2006; 108: 2755–63. [DOI] [PMC free article] [PubMed] [Google Scholar]
- 41. Ek S, Andreasson U, Hober S et al . From gene expression analysis to tissue microarrays: a rational approach to identify therapeutic and diagnostic targets in lymphoid malignancies. Mol Cell Proteomics 2006; 5: 1072–81. [DOI] [PubMed] [Google Scholar]
- 42. Sperger JM, Chen X, Draper JS et al . Gene expression patterns in human embryonic stem cells and human pluripotent germ cell tumors. Proc Natl Acad Sci USA 2003; 100: 13 350–5. [DOI] [PMC free article] [PubMed] [Google Scholar]
- 43. Gashaw I, Grummer R, Klein‐Hitpass L et al . Gene signatures of testicular seminoma with emphasis on expression of ets variant gene 4. Cell Mol Life Sci 2005; 62: 2359–68. [DOI] [PMC free article] [PubMed] [Google Scholar]
- 44. Juric D, Sale S, Hromas RA et al . Gene expression profiling differentiates germ cell tumors from other cancers and defines subtype‐specific signatures. Proc Natl Acad Sci USA 2005; 102: 17 763–8. [DOI] [PMC free article] [PubMed] [Google Scholar]
- 45. Loilome W, Yongvanit P, Wongkham C et al . Altered gene expression in Opisthorchis viverrini‐associated cholangiocarcinoma in hamster model. Mol Carcinog 2006; 45: 279–87. [DOI] [PubMed] [Google Scholar]