

Abstract
Smad4, the common partner Smad, is a key molecule in transforming growth factor‐β (TGF‐β) family signaling. Loss of Smad4 expression is found in several types of cancer, including pancreatic cancer and colon cancer, and is related to carcinogenesis. Here we identified Smad4 binding sites in the promoter regions of over 25 500 known genes by chromatin immunoprecipitation on a microarray (ChIP‐chip) in HaCaT human keratinocytes. We identified 925 significant Smad4 binding sites. Approximately half of the identified sites overlapped the binding regions of Smad2 and Smad3 (Smad2/3, receptor‐regulated Smads in TGF‐β signaling), while the rest of the regions appeared dominantly occupied by Smad4 even when a different identification threshold for Smad2/3 binding regions was used. Distribution analysis showed that Smad4 was found in the regions relatively distant from the transcription start sites, while Smad2/3 binding regions were more often present near the transcription start sites. Motif analysis also revealed that activator protein 1 (AP‐1) sites were especially enriched in the sites common to Smad2/3 and Smad4 binding regions. In contrast, GC‐rich motifs were enriched in Smad4‐dominant binding regions. We further determined putative target genes of Smad4 whose expression was regulated by TGF‐β. Our findings revealed some general characteristics of Smad4 binding regions, and provide resources for examining the role of Smad4 in epithelial cells and cancer pathogenesis. (Cancer Sci 2009)
Members of the transforming growth factor‐β (TGF‐β) family are multifunctional proteins that regulate various biological processes. They play critical roles in cell growth, differentiation, apoptosis, motility, epithelial‐to‐mesenchymal transition (EMT), and extracellular matrix production. TGF‐β family ligands transduce signals through heteromeric complexes of type I and type II serine/threonine kinase receptors and intracellular Smad proteins.( 1 , 2 ) After ligand binding, type II receptors phosphorylate type I receptors, which then phosphorylate receptor‐regulated Smads (R‐Smads) at the C‐terminal SSXS motif. Smad2 and Smad3 (Smad2/3) are TGF‐β/activin/nodal‐specific R‐Smads, whereas Smad1, Smad5, and Smad8 (Smad1/5/8) are bone morphogenetic protein (BMP)‐specific R‐Smads. Phosphorylated R‐Smads then form oligomers with a common partner Smad (Co‐Smad), Smad4, and translocate to the nucleus where they regulate transcription of target genes. Previous reports have revealed an indispensable role of Smad4 in TGF‐β‐induced expression of a subset of target genes.( 3 ) Thus, Smad4 is necessary for some TGF‐β‐induced biological responses, e.g. EMT. Impaired regulation of the TGF‐β signaling pathway is important in the pathogenesis of cancer.( 4 ) The SMAD4 locus is often deleted or mutated in pancreatic cancer and non‐microsatellite instability colon cancer.( 5 ) Mouse models also demonstrated tumorigenicity by Smad4 deletion in several organs including skin tissues.( 6 , 7 , 8 ) However, silencing of SMAD4 gene expression suggested that some TGF‐β target genes are induced even in the absence of Smad4.( 3 , 9 ) Therefore, elucidation of the precise mechanism of Smad4‐dependent regulation of gene expression in the signaling pathway is important to help clarify the pathophysiology of cancer.
The use of chromatin immunoprecipitation (ChIP) on an oligonucleotide tiling microarray (ChIP‐chip) is an emerging method to identify transcription factor binding sites. We have performed ChIP‐chip analysis of Smad2/3 binding sites of promoter regions of known human genes.( 10 ) We have determined target genes of Smad2/3 and found transcriptional regulation of them by transcription factors E26 transformation‐specific 1 (ETS1) and transcription factor activating enhancer binding protein α (TFAP2A) (also known as AP‐2). In the present study, we identified Smad4 binding regions at the promoter‐wide level using HaCaT, a normal, TGF‐β‐responsive keratinocyte cell line.( 11 , 12 ) Some of the identified Smad4 binding regions were common to Smad2/3 binding regions that we previously reported, and others showed distinctive characteristics in sequences and their distributions. We also identified candidate target genes of Smad4. These results provide important data for analysis of Smad4 function that will enhance our understanding of the mechanism of signal impairment in carcinogenesis.
Materials and Methods
Cell culture. HaCaT cells were maintained in Dulbecco’s modified Eagle’s medium (DMEM #11965; Life Technologies, Carlsbad, CA, USA) supplemented with 10% fetal bovine serum, 100 U/mL of penicillin G, and 100 μg/mL of streptomycin. Cells were grown in a humidified atmosphere with 5% CO2 at 37°C.
Chemicals. TGF‐β3 was from Novartis (Basel, Switzerland). BMP‐2 was from Asteras Pharma (Tokyo, Japan). TGF‐β type I receptor kinase inhibitor A‐44‐03 was as described previously.( 13 , 14 )
Antibodies. We used commercially available antibodies as follows: mouse anti‐Smad4 (ab3219, for ChIP; Abcam, Cambridge, UK), anti‐Smad4 (for immunoblotting; BD, Franklin Lakes, NJ, USA), anti‐Smad2/3 (BD), anti‐Smad1 (Santa Cruz Biotechnology, Santa Cruz, CA, USA), anti‐α‐tubulin (DM1A; Sigma‐Aldrich, St. Louis, MO, USA), rabbit anti‐phospho‐Smad2 (Cell Signaling Technology, Danvers, MA, USA), and anti‐phospho‐Smad1/5/8 (Cell Signaling). Mouse IgG1 (MB002; R&D Systems, Minneapolis, MN, USA) was used as a control.
ChIP. ChIP was performed as previously described.( 10 ) Cells were cultured in 15‐cm plates to approximately 80% confluence, and one plate was used for each immunoprecipitation. Cells were fixed with 1% formaldehyde for 10 min at room temperature with swirling. Glycine was added to a final concentration of 0.125 m, and the incubation was continued for an additional 5 min. Cells were washed twice with ice‐cold PBS, harvested by scraping, pelleted, and resuspended in 1 mL of SDS lysis buffer (50 mm Tris‐HCl [pH 8.1], 1% SDS, 10 mm EDTA, and protease inhibitors [P8340; Sigma‐Aldrich]). Samples were sonicated four times for 15 s each with an interval of 30 s with a UH‐50 sonicator (SMT, Tokyo, Japan). Samples were centrifuged at 17 800 × g at 8°C for 10 min. After removal of a control aliquot (whole‐cell extract), supernatants were diluted 10‐fold in ChIP dilution buffer (20 mm Tris‐HCl [pH 8.0], 150 mm NaCl, 2 mm EDTA, 1% TritonX‐100, and Complete EDTA‐free protease inhibitors [Roche Diagnostics, Basel, Switzerland]). Samples were incubated at 4°C overnight in 2‐methacryloyloxyethyl phosphorylcholine polymer‐treated 15‐mL polypropylene tubes (Assist, Tokyo, Japan) with antimouse IgG‐Dynabeads that had been pre‐incubated with 10 μg of antibodies in PBS containing 0.5% bovine serum albumin. Beads were then moved to 1.7‐mL siliconized tubes (#3207; Corning, Big Flats, NY, USA), and washed five times with ChIP wash buffer (50 mm HEPES‐KOH [pH 7.0], 0.5 m LiCl, 1 mm EDTA, 0.7% deoxycholate, 1% Igepal CA630) and once with TE buffer (pH 8.0). Immunoprecipitated samples were eluted and reverse‐crosslinked by incubation overnight at 65°C in elution buffer (50 mm Tris‐HCl [pH 8.0], 10 mm EDTA, 1% SDS). Genomic DNA was then extracted with a PCR purification kit (Qiagen, Dusseldorf, Germany).
Sample preparation for tiling array. ChIP and control input DNA samples were amplified by two cycles of in vitro transcription, and were hybridized on separate Affymetrix human promoter 1.0 oligonucleotide tiling arrays as described.( 15 , 16 ) Ten Smad4 ChIP samples from 10 15‐cm dishes were collected and used for amplification. Two biologically independent ChIP and control samples were amplified and hybridized individually.
Analysis of tiling array data. Enrichment values (ChIP/control input DNA) were calculated using the MAT algorithm as described.( 16 , 17 )
Sequence analysis. Data on enriched binding motifs were obtained from the CEAS (cis‐regulatory element annotation system) web site, where the position‐weighted matrix method was used for identification.( 18 ) For analysis by CEAS, Smad4 binding positions were lifted to NCBI36 coordinates using the ‘lift genome annotations’ tool at http://genome.ucsc.edu. Representative matrix data for each enriched transcription factor binding site are shown using Weblogo.( 19 ) We also used a pattern‐based approach to determine the frequency of each motif in Smad4 binding regions, where the following motifs were used for identification: AP‐1, TGASTCA; AP‐2, GCCNNNRGS; and ETS, SMGGAWR. Each motif pattern was selected based on the matrix data that were significantly enriched in Smad4 binding regions. Boxplots were drawn by use of the R software (http://www.r‐project.org/).
RNA interference and oligonucleotides. Stealth small interfering RNAs (siRNAs) were purchased from Life Technologies as follows: human Smad4 oligos‐1 and ‐2 (sense 5′‐UAUCCAUCAACAGUAACAAUAGGGC‐3′ and 5′‐UAAGGCACCUGACCCAAACAUCACC‐3′), and control oligos‐1 and ‐2 (12935‐200 and 12935‐112, sequences not available). siRNAs were introduced into HaCaT cells using the Lipofectamine RNAiMAX reagent (Life Technologies) according to the manufacturer’s instructions.
Immunoblotting. After centrifugation, protein concentrations of cell lysates were quantified with a DC protein assay kit (Bio‐Rad, Hercules, CA, USA). SDS‐gel electrophoresis and immunoblotting were performed as described,( 14 ) using an LAS‐3000 mini lumino‐image analyzer (Fujifilm, Tokyo, Japan).
RT‐PCR. Total RNAs were extracted using Trizol (Life Technologies). First‐strand cDNAs were synthesized using the PrimeScript reverse transcriptase (Takara Bio, Shiga, Japan) and oligo(dT)13‐18 primers (Life Technologies).
Quantitative real‐time PCR analysis. Quantitative real‐time PCR analysis was performed using Platinum SYBR Green qPCR SuperMix‐UDG with ROX (Life Technologies) and the ABI Prism 7000 Sequence Detection System (Life Technologies).( 20 ) Amplification data was quantified using the standard curve method. Detected signals were confirmed to be specific by a dissociation protocol. All the samples were run in duplicate or triplicate and the results were averaged.
Microarray expression analysis. We used published expression microarray data to analyze TGF‐β‐induced gene expression change.( 10 )
Information on primer sequences is available in the Supporting Materials and Methods.
Results
Identification of Smad4 binding sites in HaCaT cells. We screened several commercially available antibodies and identified Smad4‐specific, ChIP‐capable antibodies (data not shown). HaCaT cells were stimulated with 120 pm of TGF‐β for 1.5 h, and obtained Smad4 ChIP samples were amplified and hybridized to the tiling arrays. ChIP‐chip signals and input signals were transformed to MAT scores.( 17 ) We identified 925 significant Smad4 binding regions at a cut‐off threshold of P < 10−4 (Table S1). As an example, Figure 1(a) shows promoter regions of prostaglandin E synthase (PTGES) and the dihydrofolate reductase/mutS homolog 3 (DHFR/MSH3) locus with significant Smad4 binding signals. Smad4 binding region at the PTGES promoter overlapped the Smad2/3 binding region. In contrast, Smad2/3 binding was not observed at the Smad4 binding region in the DHFR/MSH3 promoters. We did not find binding signals at a negative control region, hypoxanthine phosphoribosyltransferase 1 (HPRT1) promoter.
Figure 1.
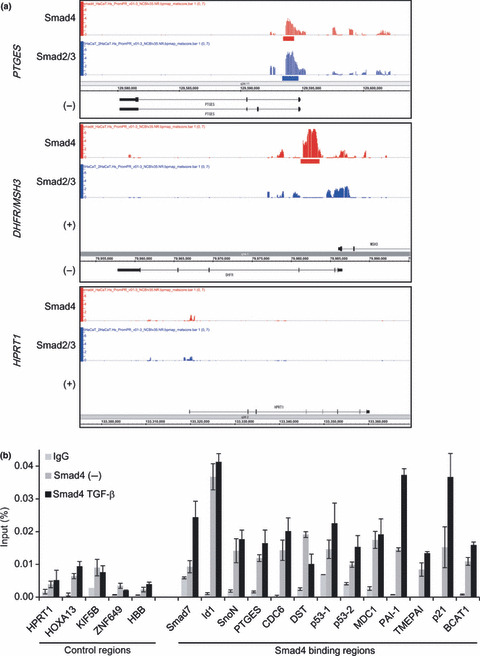
Validation of identified Smad4 binding regions. (a) Examples of the obtained chromatin immunoprecipitation on a microarray (ChIP‐chip) signals. Probe signals were transformed to MAT scores for each position, and significant Smad4 binding regions were determined and are shown in red bars. For comparison, Smad2/3 binding signals and significant binding regions( 10 ) are shown in blue. –, RefSeq genes located on the minus strand; +, RefSeq genes located on the plus strand. (b) HaCaT cells were treated with 120 pm of transforming growth factor (TGF)‐β for 1.5 h, fixed, and harvested. Smad4‐bound DNA was quantified by real‐time PCR. Values are presented as percentages of Smad4 ChIPs compared to input genome. Control regions were the regions where no significant Smad4 ChIP‐signals were observed. IgG, control IgG; –, without TGF‐β treatment. p53‐1 and p53‐2 represent two identified Smad4 binding regions near the p53 genes. Error bars represent standard errors (SE).
We then confirmed Smad4 binding to the identified binding regions by quantitative ChIP‐PCR (Fig. 1b). Enrichment of Smad4 was observed for all of the Smad4 binding regions, compared to the control regions. We also found that Smad4 binding to some regions was induced upon TGF‐β treatment, while that to others was unchanged. It might in part reflect the steady‐state activation of endogenous TGF‐β family signaling (see Fig. 2c).
Figure 2.
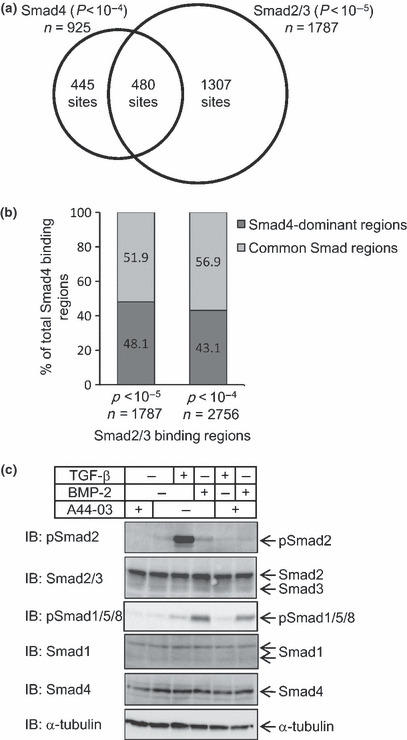
Smad4 binding regions are partially common to Smad2/3 binding regions. (a) Venn diagrams of Smad4 and Smad2/3 binding regions. A total of 925 Smad4 binding regions were determined by the cut‐off threshold of P < 10−4. Smad4 binding regions common to Smad2/3 binding regions (cut‐off threshold of P < 10−5) by at least one base pair were determined. (b) Overlapping regions were mostly unchanged by alteration of the cut‐off threshold of Smad2/3 binding regions. Smad2/3 binding regions are determined by the cut‐off threshold of either P < 10−4 or P < 10−5, and overlaps with Smad4 binding regions were determined as in (a). Data are represented as percentages of the total Smad4 binding regions. (c) Steady‐state phosphorylation of Smad1/5/8 was weakly up‐regulated by transforming growth factor (TGF)‐β under chromatin immunoprecipitation on a microarray (ChIP‐chip) conditions. HaCaT cells were stimulated with 120 pm TGF‐β or 200 ng/mL bone morphogenetic protein (BMP)‐2 for 1.5 h, or with 3 μm of a kinase inhibitor of TGF‐β type I receptor A44‐03 for 3 h. Cell lysates were quantified for protein concentration, and samples with 70‐μg protein were applied in each lane. pSmad2, phosphorylated Smad2; pSmad1/5/8, phosphorylated Smad1/5/8.
Smad4 binding regions partially overlapped Smad2/3 binding regions. Next we determined the relationship between Smad4 and Smad2/3 binding regions. We have identified Smad2/3 binding regions by the same culture and TGF‐β stimulation conditions as the present study.( 10 ) Of 925 regions, 480 Smad4 binding regions (51.9%) were shared with Smad2/3 binding regions (Fig. 2a). To confirm that their overlap did not vary with the identification threshold of binding regions, we changed the threshold of Smad2/3 binding signals from P < 10−5 to P < 10−4, but the percentage of Smad4 binding regions that overlapped Smad2/3 binding regions was not dramatically increased (Fig. 2b). In contrast, as many as 1307 out of 1787 Smad2/3 binding regions were not shared with significant Smad4 binding regions, and the number was greatly increased by changing the identification threshold. However, it appeared to be due to the relatively low Smad4 ChIP‐chip signals caused by the lower ChIP efficiency of the anti‐Smad4 antibody (data not shown). Therefore, we focused our analysis on Smad4‐binding regions, and inspected each Smad4‐specific binding region in detail. There were weak Smad2/3 binding signals for most of these regions (data not shown). Thus, half of the Smad4 binding regions overlapped significant Smad2/3 binding regions, and the rest appeared to be ‘Smad4‐dominant’ binding regions with weak Smad2/3 binding.
Smad4 is the common downstream signaling molecule for both TGF‐β and BMP family ligands.( 21 ) Recently, several reports also revealed phosphorylation of Smad1/5 by TGF‐β stimulation in certain types of cells.( 22 , 23 , 24 ) We therefore determined the activation of Smad1/5/8 in the present culture conditions. We found weak but detectable Smad1/5/8 phosphorylation without stimulation, which was slightly enhanced by TGF‐β (Fig. 2c, lanes 2 and 3). However, the phosphorylation of Smad1/5/8 by TGF‐β was much weaker than that induced by BMP‐2 (lane 4), although it was partially inhibited by TGF‐β‐specific kinase inhibitor A44‐03 (lane 5). Therefore, some of the identified Smad4 binding regions might reflect the signals from the TGF‐β‐Smad1/5/8‐Smad4 axis.
Distribution of Smad4 binding regions. We next determined the distribution of the Smad4 binding regions in the promoters and compared it to that of the Smad2/3 binding regions. Sixteen percent of the Smad4 binding regions fell between ‐1 kb and the transcription start site (TSS), which was smaller than the corresponding number for Smad2/3 (26%, Fig. 3a). There was no remarkable difference in distribution between the Smad2/3‐overlapped regions and the Smad4‐dominant regions (Fig. 3b). On the other hand, the percentage of Smad2/3 binding regions common to Smad4 binding regions between ‐1 kb and TSS (11.6%) was smaller than that of total Smad2/3 binding regions (25.9%, Fig. 3c). These results suggested that Smad4 binding regions are located at relatively distant regions from the TSS, while Smad2/3 binding regions tend to occur in the regions near the TSS.
Figure 3.
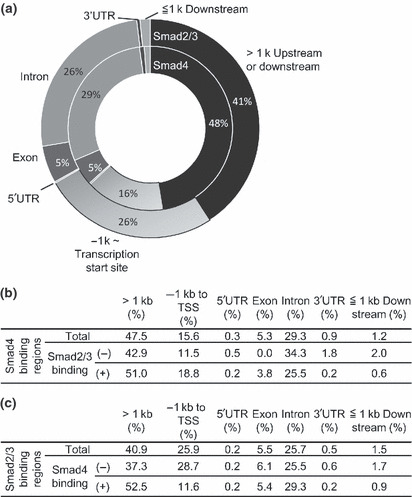
Distribution of Smad4 binding regions. (a) Smad4 binding regions are located in regions distant from the transcription start sites of known genes. Distribution of the Smad4 and Smad2/3 binding regions was determined by CEAS (cis‐regulatory element annotation system). (b) Differences in distribution of the Smad4 binding regions between the common regions and Smad4‐dominant regions. Distribution of the regions was determined as in (a). (c) Differences in distribution of the Smad2/3 binding regions between the common regions and Smad2/3‐only regions.
Analysis of Smad4 binding promoter sequences. We have identified ETS and AP‐2 sites as motifs enriched in the Smad2/3 binding regions.( 10 ) Motif analysis of the Smad4 binding regions was then performed using the same analysis tool.( 18 ) Analysis for total Smad4 binding regions revealed that AP‐1 sites( 25 ) were the most significantly enriched motif. Many GC‐rich motifs, e.g. ZF5, E2F, and SP1 sites were also significantly enriched in those regions (Fig. 4a,c). Essentially the same result was obtained by analysis of the common Smad4 binding regions (Fig. 4b, left), except for the enrichment of the ‘Smad binding element’ in these regions. In contrast, there was no enrichment of any AP‐1 sites in the Smad4‐dominant binding regions (Fig. 4b, right). GC‐rich motifs were significantly enriched in every type of Smad4 binding region. We also observed enrichment of AP‐2 and ETS family motifs in the Smad4 binding regions (Fig. 4a,d). We determined the frequency of each motif, and confirmed that the frequency of AP‐1 motif in Smad4‐dominant binding regions was not higher than that in control sequences (Fig. 4d).
Figure 4.
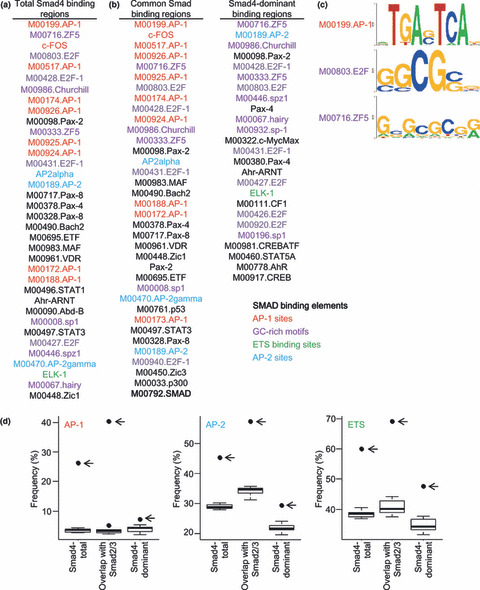
Identification of activator protein 1 (AP‐1) and GC‐rich sites as Smad4 binding regions. The DNA sequence within 250 bp from the peak position of each Smad4 binding region was analyzed by CEAS (cis‐regulatory element annotation system). Up to 36 enriched motifs are shown in the order of their significance. There were many matrices defined for the same transcription factors, and AP‐1, E26 transformation‐specific (ETS), AP‐2, and GC‐rich motifs are categorized and colored in red, green, blue, and purple, respectively. The Smad binding element (M00792.SMAD) is shown in bold characters. (a) Both AP‐1 and GC‐rich sites were enriched in the total Smad4 binding regions. (b, left) AP‐1 and GC‐rich sites were significantly enriched in the common Smad binding regions. (b, right) GC‐rich sites were enriched in Smad4‐dominant sites. (c) Schematic representation of the significantly enriched motifs in Smad4 binding regions. (d) Boxplot presentations of the frequencies of AP‐1, AP‐2, and ETS motifs in Smad4 binding regions and their control sequences. Frequencies of AP‐1, AP‐2, and ETS sites within 250 bp of the peak position of Smad4 binding regions and their shuffled sequences were determined using a pattern‐based identification approach. Outliers are plotted as filled circles. The outliers indicated by arrows show frequencies of the motifs in Smad4 binding regions.
Identification of candidate target genes of Smad4 regulated by TGF‐β. Finally we determined possible target genes which have Smad4 binding regions between 5 kb upstream from the TSS and the first intron (Table S2). We then analyzed their TGF‐β‐induced expression change using microarray data,( 10 ) and listed the genes that were up‐ or down‐regulated by two‐fold or more. We identified putative target genes of Smad4 which were either up‐ or down‐regulated early after TGF‐β stimulation (Table 1), or late after stimulation (2, 3). We also analyzed whether the position of Smad4 binding regions relative to the TSS affects gene expression change, but there was no significant difference (data not shown).
Table 1.
Genes near the Smad4 binding sites regulated by TGF‐β at 1.5 h
| Gene symbol | Gene name | Expression change (fold) | Published Smad4 dependency |
|---|---|---|---|
| SERPINE1 | Plasminogen activator inhibitor type 1 (PAI‐1) | 28.1 | + |
| SKIL | SKI‐like oncogene (SnoN) | 6.2 | − |
| EDN1 | Endothelin 1 | 5.8 | − |
| SMAD7 | SMAD, mothers against DPP homolog 7 (Drosophila) | 5.7 | − |
| ETS2 | v‐ets erythroblastosis virus E26 oncogene homolog 2 (avian) | 4.6 | + |
| CDKN1A | Cyclin‐dependent kinase inhibitor 1A (p21, Cip1) | 3.4 | − |
| TGIF | TGF‐β‐induced factor (TALE family homeobox) | 3.2 | ND |
| LAMC2 | Laminin, gamma 2 | 3.0 | + |
| EFNA1 | Ephrin‐A1 | 2.8 | ND |
| SMOX | Spermine oxidase | 2.5 | ND |
| C20orf42 | Chromosome 20 open reading frame 42 | 2.5 | ND |
| TMEPAI | Transmembrane, prostate androgen induced RNA | 2.4 | – |
| GNG12 | Guanine nucleotide binding protein (G protein), gamma 12 | 2.3 | ND |
| BNC1 | Basonuclin 1 | 2.2 | ND |
| RYBP | RING1 and YY1 binding protein | 2.2 | ND |
| ARID3B | AT rich interactive domain 3B (BRIGHT‐like) | 2.1 | ND |
| DKFZP686P18101 | Similar to bA110H4.2 (similar to membrane protein) | 0.46 | ND |
+, Smad4‐dependent; −, Smad4‐independent; ND, not determined; TGF‐β, transforming growth factor‐β.
Table 2.
Genes near the Smad4 binding sites up‐regulated by TGF‐β at 24 h
| Gene symbol | Gene name | Expression change (fold) |
|---|---|---|
| SERPINE1 | Plasminogen activator inhibitor type 1 (PAI‐1) | 56.1 |
| TGM2 | Transglutaminase 2 | 43.1 |
| LTBP2 | Latent transforming growth factor beta binding protein 2 | 8.3 |
| IVL | Involucrin | 7.0 |
| ITGA2 | Integrin, alpha 2 (CD49B, alpha 2 subunit of VLA‐2 receptor) | 5.8 |
| BTG2 | BTG family, member 2 | 5.6 |
| SKIL | SKI‐like (SnoN) | 5.6 |
| CDKN1A | Cyclin‐dependent kinase inhibitor 1A (p21, Cip1) | 5.4 |
| LAMC2 | Laminin, gamma 2 | 5.2 |
| TMEPAI | Transmembrane, prostate androgen induced RNA | 4.5 |
| PICALM | Phosphatidylinositol binding clathrin assembly protein | 4.3 |
| DSC2 | Desmocollin 2 | 4.3 |
| ARID3B | AT rich interactive domain 3B (BRIGHT‐like) | 3.7 |
| ATXN1 | Ataxin 1 | 3.6 |
| IVNS1ABP | Influenza virus NS1A binding protein | 3.3 |
| ITGA4 | Integrin, alpha 4 (antigen CD49D, alpha 4 subunit of VLA‐4 receptor) | 3.3 |
| NDRG1 | N‐myc downstream regulated gene 1 | 3.2 |
| FANK1 | Fibronectin type 3 and ankyrin repeat domains 1 | 3.2 |
| MMP10 | Matrix metalloproteinase 10 (stromelysin 2) | 3.1 |
| C20orf42 | Chromosome 20 open reading frame 42, fermitin family homolog 1 | 3.0 |
| PTPRK | Protein tyrosine phosphatase, receptor type, K | 2.9 |
| GNG12 | Guanine nucleotide binding protein (G protein), gamma 12 | 2.9 |
| MTMR11 | Cisplatin resistance associated | 2.9 |
| AFF4 | ALL1 fused gene from 5q31 | 2.9 |
| BAIAP2L1 | Insulin receptor tyrosine kinase substrate | 2.8 |
| RAB6A | RAB6A, member RAS oncogene family | 2.8 |
| PLCXD2 | Clone IMAGE:113431 mRNA sequence | 2.8 |
| SAMD9 | Sterile alpha motif domain containing 9 | 2.7 |
| STON2 | Stonin 2 | 2.6 |
| HIST2H2BE | Histone 2, H2be | 2.6 |
| NIACR2 | Niacin receptor 2 | 2.6 |
| EFNA1 | Ephrin‐A1 | 2.6 |
| ENC1 | Ectodermal‐neural cortex (with BTB‐like domain) | 2.5 |
| SSBP3 | Single stranded DNA binding protein 3 | 2.5 |
| TSPAN4 | CD151 antigen | 2.4 |
| SPRR1B | Small proline‐rich protein 1B (cornifin) | 2.4 |
| KRT17 | Keratin 17 | 2.4 |
| TGIF | TGF‐β‐induced factor (TALE family homeobox) | 2.4 |
| KLF6 | Kruppel‐like factor 6 | 2.3 |
| FLJ41603 | FLJ41603 protein | 2.3 |
| GGPS1 | Geranylgeranyl diphosphate synthase 1 | 2.3 |
| ETS2 | v‐ets erythroblastosis virus E26 oncogene homolog 2 (avian) | 2.3 |
| PTPN21 | Protein tyrosine phosphatase, non‐receptor type 21 | 2.3 |
| EDIL3 | EGF‐like repeats and discoidin I‐like domains 3 | 2.3 |
| SMAD7 | SMAD, mothers against DPP homolog 7 (Drosophila) | 2.3 |
| SUSD1 | Sushi domain containing 1 | 2.3 |
| TFDP2 | Transcription factor Dp‐2 (E2F dimerization partner 2) | 2.3 |
| LAMB3 | Laminin, beta 3 | 2.2 |
| IRF2BP2 | Interferon regulatory factor 2 binding protein 2 | 2.2 |
| F11R | F11 receptor | 2.2 |
| HIST1H2BD | Histone 1, H2bd | 2.2 |
| EHBP1 | EH domain binding protein 1 | 2.2 |
| SREBF1 | Sterol regulatory element binding transcription factor 1 | 2.2 |
| DNAJB2 | DnaJ (Hsp40) homolog, subfamily B, member 2 | 2.2 |
| GPR87 | G protein‐coupled receptor 87 | 2.2 |
| SLC7A1 | Solute carrier family 7 (cationic amino acid transporter, y+ system), member 1 | 2.1 |
| TNC | Tenascin C (hexabrachion) | 2.1 |
| ALCAM | Activated leukocyte cell adhesion molecule | 2.1 |
| PTHB1 | Parathyroid hormone‐responsive B1 gene | 2.1 |
| WDFY3 | WD repeat and FYVE domain containing 3 | 2.1 |
| CHD2 | Chromodomain helicase DNA binding protein 2 | 2.1 |
| PPP1R13L | RelA‐associated inhibitor | 2.1 |
| KIAA1609 | KIAA1609 protein | 2.0 |
| MOBKL2B | MOB1, Mps One Binder kinase activator‐like 2B (yeast) | 2.0 |
| FURIN | Furin (paired basic amino acid cleaving enzyme) | 2.0 |
TGF‐β, transforming growth factor‐β.
Table 3.
Genes near the Smad4 binding sites down‐regulated by TGF‐β at 24 h
| Gene symbol | Gene name | Expression change (fold) |
|---|---|---|
| EXO1 | Exonuclease 1 | 0.11 |
| ATAD2 | ATPase family, AAA domain containing 2 | 0.14 |
| CDC6 | CDC6 cell division cycle 6 homolog (S. cerevisiae) | 0.15 |
| PTGES | Prostaglandin E synthase | 0.17 |
| MNS1 | Meiosis‐specific nuclear structural protein 1 | 0.18 |
| MDC1 | Mediator of DNA damage checkpoint 1 | 0.23 |
| GMNN | Geminin, DNA replication inhibitor | 0.24 |
| ID1 | Inhibitor of DNA binding 1, dominant negative helix‐loop‐helix protein | 0.26 |
| ARL14 | ADP‐ribosylation factor‐like 14 | 0.27 |
| CD55 | Decay accelerating factor for complement (CD55, Cromer blood group system) | 0.31 |
| KIAA0133 | URB2 ribosome biogenesis 2 homolog | 0.33 |
| DIS3L | DIS3 mitotic control homolog (S. cerevisiae)‐like | 0.34 |
| SFRS2IP | Splicing factor, arginine/serine‐rich 2, interacting protein | 0.37 |
| C14orf130 | Chromosome 14 open reading frame 130 | 0.37 |
| ARL4A | ADP‐ribosylation factor‐like 4A | 0.39 |
| RPL22L1 | Similar to ribosomal protein L22 | 0.39 |
| PCSK5 | Proprotein convertase subtilisin/kexin type 5 | 0.40 |
| C10orf78 | Chromosome 10 open reading frame 78 | 0.41 |
| AKR1C2 | Aldo‐keto reductase family 1, member C2 | 0.42 |
| C20orf199 | Chromosome 20 open reading frame 199 | 0.44 |
| AFG3L1 | AFG3 ATPase family gene 3‐like 1 (yeast) | 0.45 |
| ECT2 | Epithelial cell transforming sequence 2 oncogene | 0.45 |
| TOMM40 | Translocase of outer mitochondrial membrane 40 homolog (yeast) | 0.49 |
| LSM5 | LSM5 homolog, U6 small nuclear RNA associated (S. cerevisiae) | 0.49 |
| PHLDA1 | Pleckstrin homology‐like domain, family A, member 1 | 0.49 |
| THOC6 | THO complex 6 homolog (Drosophila) | 0.50 |
| RIOK1 | RIO kinase 1 (yeast) | 0.50 |
TGF‐β, transforming growth factor‐β.
We then inspected whether these putative target genes are Smad4‐dependent for TGF‐β‐induced expression change in HaCaT cells. Levy and Hill. ( 3 ) have shown that some genes, e.g. plasminogen activator inhibitor type 1 (PAI‐1) and v‐ets erythroblastosis virus E26 oncogene homolog 2 (avian) (ETS2), were Smad4‐dependent, while others including p21 were Smad4‐independent. We then knocked‐down Smad4 (Fig. 5a), and examined its effect on the expression of PAI‐1 and p21, both of which have Smad4 binding regions in their promoters. It should be noted that Smad4 siRNAs did not affect expression levels of Smad2 or Smad3 (Fig. 5a and data not shown). We found that PAI‐1 expression as well as p21 expression was inhibited by Smad4 siRNAs (Fig. 5b). We have not determined here whether expression of all the possible Smad4 target genes is dependent on Smad4, but the ChIP‐chip‐based target gene identification approach provided promising data for future analysis of Smad4 functions.
Figure 5.
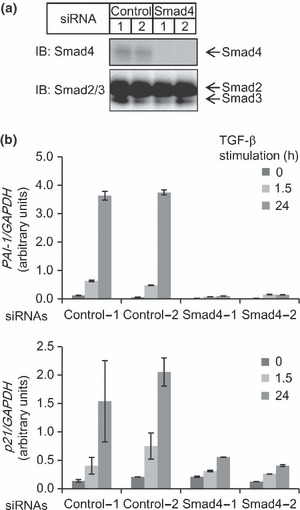
Effect of Smad4 siRNAs on expression of target genes. (a) Knock‐down of Smad4 by siRNAs. HaCaT cells were transfected with Smad4 or control siRNAs. Cells were then stimulated with 120‐pm transforming growth factor (TGF)‐β for 3 h, and harvested. Expression levels of endogenous Smad4 and Smad2/3 proteins were determined by immunoblotting. (b) HaCaT cells were transfected with siRNAs as indicated, and 48 h later stimulated with TGF‐β for the indicated times. Expression levels of plasminogen activator inhibitor type 1 (PAI‐1) and p21 mRNAs were determined by RT‐qPCR and normalized by the expression of GAPDH. Error bars indicate SD.
Discussion
Smad4 has an alias of Deleted in pancreatic carcinoma 4 (DPC4),( 26 ) and its role as a tumor suppressor has been extensively analyzed. Smad4 is regarded as one of the most important molecules in the TGF‐β signaling pathway. Identification of the target genes of Smad4 has been reported in both normal epithelial and cancer cells. As a result, both the expression and function of Smad4‐dependent genes are now known. However, it has not been defined how Smad4 dependency is determined or to what extent Smad4 cooperates with other Smads on the promoters. Our promoter‐wide identification of Smad4 binding sites using a normal epithelial cell line thus provides the initial resources to analyze these matters.
ChIP‐based analysis is clearly dependent on the specificity and efficiency of the antibodies used. We thus made a substantial effort to identify such antibodies to compare the ChIP‐chip data from different molecules. Although Smad4 antibodies appeared less susceptible than Smad2/3 antibodies to ChIP analysis, we obtained information as to which Smad4 binding regions are common to Smad2/3 regions. Interestingly, we determined Smad4‐dominant binding regions. These regions may have a distinct mode of binding of Smad complexes to DNA, or have distinct binding partners that mask specific Smad2/3 epitopes recognized by the antibodies. We also identified a few Smad4‐dominant regions that did not have any Smad2/3 ChIP‐chip signals (see Fig. 1a). Based on recent findings reporting the TGF‐β‐induced Smad1/5 activation pathway,( 22 , 23 ) these regions may represent such Smad1/5‐Smad4 complex‐bound sites, although we could only detect very weak phosphorylation of Smad1/5/8 by TGF‐β in HaCaT cells (Fig. 2c). It has also been reported that BMP‐9 and BMP‐10 are present in serum at concentrations sufficient to exhibit their biological functions.( 27 ) Therefore, phosphorylation of Smad1/5/8 also potentially reflects the steady‐state activation of the BMP signaling pathway in our culture conditions. Of note, GC‐rich motifs enriched in Smad4‐dominant regions are known to be TGF‐β‐Smad‐ as well as BMP‐Smad‐binding motifs. It is thus possible that BMP‐specific inhibitors may be useful to distinguish these possibilities.( 28 )
As is the case with other ChIP‐chip‐based analyses, we could not avoid possible non‐specific immunoprecipitation of some other transcription factors. This might result in the ChIP‐qPCR signals in negative control regions (Fig. 1b). However, based on the following observations, most of the Smad4‐dominant binding regions were less likely to be non‐specific: (1) many Smad4‐dominant regions have overlapping weak Smad2/3 binding; (2) GC‐rich motifs are known as Smad binding motifs as discussed above and were frequently observed in the Smad4‐dominant regions in the present study; and (3) by using another Smad4 antibody we detected Smad4 binding at the Smad4‐dominant DHFR promoter (data not shown).
Moreover, the Smad4 antibodies used in the present study bound less efficiently in ChIP analyses than the Smad2/3 antibodies used in our previous study.( 10 ) Therefore, we could not determine whether the Smad2/3‐only sites are truly the Smad4‐free binding sites. However, several reports revealed Smad4‐independent Smad2 or Smad3 binding to the promoters in keratinocytes. Descargues et al. demonstrated that Smad2 and Smad3 regulate expression of Mad family genes together with IκB kinase‐α (IKKα) during keratinocyte differentiation.( 29 ) In addition, using keratinocyte‐specific Smad2−/− and Smad4−/− mice, Hoot et al. reported that Smad2 interferes with Smad4 binding to the Snail promoter, which prevents EMT in skin carcinogenesis.( 30 ) We did not detect significant Smad2/3 or Smad4 binding signals on the Snail promoter. However, such competition within the Smad family would possibly be an alternative explanation for the presence of Smad2/3 or Smad4‐dominant binding regions.
Distribution analysis also identified differences between the Smad4 and Smad2/3 binding regions. The Smad4 binding regions were located on relatively distant sites compared to the Smad2/3 binding regions. Together with the differences in the enriched motifs, distribution analysis at a genome‐wide level would reveal the differences more clearly in the future. The characteristics of these regions and their functional significance remain to be discussed, but these approaches would shed light on the mechanism of transcriptional regulation by Smad complexes on the promoters.
ChIP‐chip analysis has the advantage of finding the direct target genes of certain transcription factors. We used a normal keratinocyte cell line as a standard epithelial cell line that responds well to TGF‐β signaling. However, it has been demonstrated that epidermal‐specific conditional Smad4 knockout mice develop squamous cell carcinoma.( 6 , 8 ) Therefore, our present study is also useful for the analysis of the epidermal‐specific regulation of gene expression by TGF‐β. We have provided lists of possible target genes of Smad4 that were regulated by TGF‐β and might act as oncogenes or tumor suppressors. Cell division cycle 6 homolog (CDC6) is one such target gene that is essential for anchorage‐independent cell proliferation.( 31 ) Epithelial cell transforming sequence 2 oncogene (ECT2) is also a candidate target of Smad4 that has transforming properties.( 32 ) Analysis of the regulation of these genes might reveal as‐yet undefined roles of TGF‐β, and impairment of the regulation of these genes might be responsible for skin carcinogenesis.
In summary, our present study provided a landscape of Smad4 binding sites and their general characteristics. Further research should aim to elucidate the effects of Smad4 on promoters in cancer cells stimulated with either TGF‐β or BMP.
Supporting information
Supporting Materials and Methods. Sequences of the primers used for ChIP‐quantitative PCR and RT‐PCR.
Table S1. Complete list of Smad4 binding regions.
Table S2. Complete list of potential target genes of Smad4.
Please note: Wiley‐Blackwell are not responsible for the content or functionality of any supporting materials supplied by the authors. Any queries (other than missing material) should be directed to the corresponding author for the article.
Supporting info item
Acknowledgments
This work was supported by KAKENHI (Grant‐in‐Aid for Scientific Research) and a grant of the Genome Network Project from the Ministry of Education, Culture, Sports, Science and Technology of Japan. The authors declare no conflict of interest.
References
- 1. Heldin CH, Miyazono K, Ten Dijke P. TGF‐β signalling from cell membrane to nucleus through SMAD proteins. Nature 1997; 390: 465–71. [DOI] [PubMed] [Google Scholar]
- 2. Shi Y, Massague J. Mechanisms of TGF‐β signaling from cell membrane to the nucleus. Cell 2003; 113: 685–700. [DOI] [PubMed] [Google Scholar]
- 3. Levy L, Hill CS. Smad4 dependency defines two classes of transforming growth factor β (TGF‐β) target genes and distinguishes TGF‐β‐induced epithelial‐mesenchymal transition from its antiproliferative and migratory responses. Mol Cell Biol 2005; 25: 8108–25. [DOI] [PMC free article] [PubMed] [Google Scholar]
- 4. Derynck R, Akhurst RJ, Balmain A. TGF‐β signaling in tumor suppression and cancer progression. Nat Genet 2001; 29: 117–29. [DOI] [PubMed] [Google Scholar]
- 5. Levy L, Hill CS. Alterations in components of the TGF‐β superfamily signaling pathways in human cancer. Cytokine Growth Factor Rev 2006; 17: 41–58. [DOI] [PubMed] [Google Scholar]
- 6. Qiao W, Li AG, Owens P, Xu X, Wang XJ, Deng CX. Hair follicle defects and squamous cell carcinoma formation in Smad4 conditional knockout mouse skin. Oncogene 2006; 25: 207–17. [DOI] [PubMed] [Google Scholar]
- 7. Bardeesy N, Cheng KH, Berger JH et al. Smad4 is dispensable for normal pancreas development yet critical in progression and tumor biology of pancreas cancer. Genes Dev 2006; 20: 3130–46. [DOI] [PMC free article] [PubMed] [Google Scholar]
- 8. Yang L, Mao C, Teng Y et al. Targeted disruption of Smad4 in mouse epidermis results in failure of hair follicle cycling and formation of skin tumors. Cancer Res 2005; 65: 8671–8. [DOI] [PubMed] [Google Scholar]
- 9. Jazag A, Ijichi H, Kanai F et al. Smad4 silencing in pancreatic cancer cell lines using stable RNA interference and gene expression profiles induced by transforming growth factor‐β. Oncogene 2005; 24: 662–71. [DOI] [PubMed] [Google Scholar]
- 10. Koinuma D, Tsutsumi S, Kamimura N et al. Chromatin immunoprecipitation on microarray analysis of Smad2/3 binding sites reveals roles of ETS1 and TFAP2A in transforming growth factor β signaling. Mol Cell Biol 2009; 29: 172–86. [DOI] [PMC free article] [PubMed] [Google Scholar]
- 11. Boukamp P, Petrussevska RT, Breitkreutz D, Hornung J, Markham A, Fusenig NE. Normal keratinization in a spontaneously immortalized aneuploid human keratinocyte cell line. J Cell Biol 1988; 106: 761–71. [DOI] [PMC free article] [PubMed] [Google Scholar]
- 12. Geng Y, Weinberg RA. Transforming growth factor β effects on expression of G1 cyclins and cyclin‐dependent protein kinases. Proc Natl Acad Sci U S A 1993; 90: 10315–9. [DOI] [PMC free article] [PubMed] [Google Scholar]
- 13. Tojo M, Hamashima Y, Hanyu A et al. The ALK‐5 inhibitor A‐83‐01 inhibits Smad signaling and epithelial‐to‐mesenchymal transition by transforming growth factor‐β. Cancer Sci 2005; 96: 791–800. [DOI] [PMC free article] [PubMed] [Google Scholar]
- 14. Ehata S, Hanyu A, Hayashi M et al. Transforming growth factor‐β promotes survival of mammary carcinoma cells through induction of antiapoptotic transcription factor DEC1. Cancer Res 2007; 67: 9694–703. [DOI] [PubMed] [Google Scholar]
- 15. Kaneshiro K, Tsutsumi S, Tsuji S, Shirahige K, Aburatani H. An integrated map of p53‐binding sites and histone modification in the human ENCODE regions. Genomics 2007; 89: 178–88. [DOI] [PubMed] [Google Scholar]
- 16. Wendt KS, Yoshida K, Itoh T et al. Cohesin mediates transcriptional insulation by CCCTC‐binding factor. Nature 2008; 451: 796–801. [DOI] [PubMed] [Google Scholar]
- 17. Johnson WE, Li W, Meyer CA et al. Model‐based analysis of tiling‐arrays for ChIP‐chip. Proc Natl Acad Sci U S A 2006; 103: 12457–62. [DOI] [PMC free article] [PubMed] [Google Scholar]
- 18. Ji X, Li W, Song J, Wei L, Liu XS. CEAS: cis‐regulatory element annotation system. Nucleic Acids Res 2006; 34: W551–4. [DOI] [PMC free article] [PubMed] [Google Scholar]
- 19. Crooks GE, Hon G, Chandonia JM, Brenner SE. WebLogo: a sequence logo generator. Genome Res 2004; 14: 1188–90. [DOI] [PMC free article] [PubMed] [Google Scholar]
- 20. Koinuma D, Shinozaki M, Komuro A et al. Arkadia amplifies TGF‐β superfamily signalling through degradation of Smad7. EMBO J 2003; 22: 6458–70. [DOI] [PMC free article] [PubMed] [Google Scholar]
- 21. Miyazawa K, Shinozaki M, Hara T, Furuya T, Miyazono K. Two major Smad pathways in TGF‐β superfamily signalling. Genes Cells 2002; 7: 1191–204. [DOI] [PubMed] [Google Scholar]
- 22. Liu IM, Schilling SH, Knouse KA, Choy L, Derynck R, Wang XF. TGFβ‐stimulated Smad1/5 phosphorylation requires the ALK5 L45 loop and mediates the pro‐migratory TGFβ switch. EMBO J 2009; 28: 88–98. [DOI] [PMC free article] [PubMed] [Google Scholar]
- 23. Daly AC, Randall RA, Hill CS. Transforming growth factor β‐induced Smad1/5 phosphorylation in epithelial cells is mediated by novel receptor complexes and is essential for anchorage‐independent growth. Mol Cell Biol 2008; 28: 6889–902. [DOI] [PMC free article] [PubMed] [Google Scholar]
- 24. Goumans MJ, Valdimarsdottir G, Itoh S, Rosendahl A, Sideras P, Ten Dijke P. Balancing the activation state of the endothelium via two distinct TGF‐β type I receptors. EMBO J 2002; 21: 1743–53. [DOI] [PMC free article] [PubMed] [Google Scholar]
- 25. Zhang Y, Feng XH, Derynck R. Smad3 and Smad4 cooperate with c‐Jun/c‐Fos to mediate TGF‐β‐induced transcription. Nature 1998; 394: 909–13. [DOI] [PubMed] [Google Scholar]
- 26. Hahn SA, Schutte M, Hoque AT et al. DPC4, a candidate tumor suppressor gene at human chromosome 18q21.1. Science 1996; 271: 350–3. [DOI] [PubMed] [Google Scholar]
- 27. David L, Mallet C, Mazerbourg S, Feige JJ, Bailly S. Identification of BMP9 and BMP10 as functional activators of the orphan activin receptor‐like kinase 1 (ALK1) in endothelial cells. Blood 2007; 109: 1953–61. [DOI] [PubMed] [Google Scholar]
- 28. Yu PB, Hong CC, Sachidanandan C et al. Dorsomorphin inhibits BMP signals required for embryogenesis and iron metabolism. Nat Chem Biol 2008; 4: 33–41. [DOI] [PMC free article] [PubMed] [Google Scholar]
- 29. Descargues P, Sil AK, Sano Y et al. IKKα is a critical coregulator of a Smad4‐independent TGFβ‐Smad2/3 signaling pathway that controls keratinocyte differentiation. Proc Natl Acad Sci U S A 2008; 105: 2487–92. [DOI] [PMC free article] [PubMed] [Google Scholar]
- 30. Hoot KE, Lighthall J, Han G et al. Keratinocyte‐specific Smad2 ablation results in increased epithelial‐mesenchymal transition during skin cancer formation and progression. J Clin Invest 2008; 118: 2722–32. [DOI] [PMC free article] [PubMed] [Google Scholar]
- 31. Jinno S, Yageta M, Nagata A, Okayama H. Cdc6 requires anchorage for its expression. Oncogene 2002; 21: 1777–84. [DOI] [PubMed] [Google Scholar]
- 32. Miki T, Smith CL, Long JE, Eva A, Fleming TP. Oncogene ect2 is related to regulators of small GTP‐binding proteins. Nature 1993; 362: 462–5. [DOI] [PubMed] [Google Scholar]
Associated Data
This section collects any data citations, data availability statements, or supplementary materials included in this article.
Supplementary Materials
Supporting Materials and Methods. Sequences of the primers used for ChIP‐quantitative PCR and RT‐PCR.
Table S1. Complete list of Smad4 binding regions.
Table S2. Complete list of potential target genes of Smad4.
Please note: Wiley‐Blackwell are not responsible for the content or functionality of any supporting materials supplied by the authors. Any queries (other than missing material) should be directed to the corresponding author for the article.
Supporting info item