

Abstract
Metformin is a biguanide derivative that is widely used in the treatment of diabetes mellitus. One of the pharmacological targets of metformin is adenosine monophosphate‐activated protein kinase (AMPK). We investigated the effect of metformin on the suppression of intestinal polyp formation in Apc Min/+ mice. Administration of metformin (250 mg/kg) did not reduce the total number of intestinal polyp formations, but significantly reduced the number of intestinal polyp formations larger than 2 mm in diameter in Apc Min/+ mice. To examine the indirect effect of metformin, the index of insulin resistance and serum lipid levels in Apc Min/+ mice were assessed. These factors were not significantly attenuated by the treatment with metformin, indicating that the suppression of polyp growth is not due to the indirect drug action. The levels of tumor cell proliferation as determined by 5‐bromodeoxyuridine and proliferating cell nuclear antigen immunohistochemical staining, and apoptosis, via transferase deoxytidyl uridine end labeling staining, in the polyps of metformin‐treated mice were not significantly different in comparison to those of control mice. Gene expression of cyclin D1 and c‐myc in intestinal polyps were also not significantly different between those two groups. In contrast, metformin activated AMPK in the intestinal polyps, resulting in the inhibition of the activation of mammalian target of rapamycin, which play important roles in the protein synthesis machinery. Metformin suppressed the polyp growth in Apc Min/+ mice, suggesting that it may be a novel candidate as a chemopreventive agent for colorectal cancer. (Cancer Sci 2008; 99: 2136–2141)
Colorectal cancer is one of the major causes of mortality.( 1 ) Several mechanisms are reported to be involved in the formation of polyps. Apc Min/+ mice, which have a germ‐line mutation in the Apc tumor suppressor gene( 2 ) and have been used extensively for various chemoprevention studies( 3 ) are predisposed to the development of multiple adenomas in the small intestine and, to a much lesser extent, in the colon.( 4 ) The formation of these polyps is initiated by loss of heterozygosity at the Apc locus, which leads to stabilization of the transcription factor β‐catenin and constitutive activation of the Wnt signaling pathway, resulting in the expression of target genes, such as cyclin D1, c‐myc and others.( 5 )
Cyclooxygenase‐2 (COX‐2) is recognized as a potential human colorectal cancer (CRC) chemopreventive target.( 6 ) However, recent clinical observations have cast doubt on the vascular safety profile of long‐term systemic administration of selective COX‐2 inhibitors in humans.( 7 ) Therefore, alternative CRC chemoprevention strategies are needed, one of which is to investigate novel therapeutic targets for CRC chemoprevention and another is to minimize the systemic toxicity of COX‐2 inhibitors and non‐steroidal anti‐inflammatory drugs such as aspirin.
Metformin (1, 1‐dimethylbiguanide hydrochloride) is one of the biguanide derivatives that has been widely used for a long time in the treatment of diabetes mellitus.( 8 ) The pharmacological action of metformin is reported to be improvement of the insulin resistance in the liver via the activation of adenosine monophosphate‐activated protein kinase (AMPK).( 9 , 10 ) Thus, most of the molecular mechanisms involved in metformin action have been studied in liver and adipose tissue in relation to glucose homeostasis and insulin action. However, little is known about the effect of metformin‐mediated activation of AMPK in intestinal epithelial cells.
Recently, involvement of the AMPK/mammalian target of rapamycin (mTOR) pathway in the development of various cancers has been reported.( 11 , 12 ) The targets for mTOR signaling are proteins involved in controlling the translational machinery, including the ribosomal protein S6 kinases (S6K) that regulate the initiation and elongation phases of translation.( 13 ) With regard to upstream control, mTOR is regulated by signaling pathways linked to several oncoproteins or tumor suppressors, including phosphatidyl inositol 3‐kinase (PI3K), lipid phosphatase PTEN and AMPK.( 14 ) In particular, AMPK activation has been reported to directly inhibit mTOR, resulting in suppression of cell proliferation.( 15 ) In addition, it has been demonstrated that growth inhibition of breast cancer cells treated with metformin is associated with the decrease in mTOR and S6 kinase activation in vitro. ( 16 ) The results of the in vitro study led us to raise the question whether metformin could act as an anticancer agent for normal and/or transformed intestinal epithelial cells in vivo. In this study, we therefore investigated the effect of metformin on the suppression of intestinal polyp growth in Apc Min/+ mice.
Materials and Methods
Animals and reagents. The mice were treated humanely according to the National Institutes of Health and AERI‐BBRI Animal Care and Use Committee guidelines. All animal experiments were approved by the institutional Animal Care and Use Committee of Yokohama City University School of Medicine. C57BL/6‐ApcMin/+ mice (Apc Min/+ mice) were purchased from Jackson Laboratory (Bar Harbor, ME, USA). Four to five mice were housed per metallic cage, with sterilized softwood chips as bedding, in a barrier‐sustained animal room air‐conditioned at 24 ± 2°C and 55% humidity, under a 12‐h light : dark cycle.
Experimental design. Metformin, which was kindly provided by Dainippon Sumitomo Pharmaceutical (Osaka, Japan), was mixed with a powdered basal diet (Oriental MF, Tokyo, Japan). Nine‐week‐old Apc Min/+ mice (n = 32; 20 for histological analysis, 12 for protein analysis) were divided into two groups: with or without metformin (250 mg/kg per day in the diet) treatment for 10 weeks (Fig. 1). Although the amount of metformin we used in this study is higher than that used in diabetes patients (30–50 mg/kg), previous reports investigating the antidiabetic and antitumor effects of metformin in the mouse model used a higher amount of metformin (250–350 mg/kg) due to the difference of drug sensitivity between rodent and human.( 17 , 18 , 19 ) Therefore, we used metformin at the dose of 250 mg/kg in this study.
Figure 1.
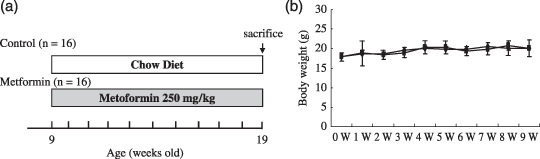
(a) Experimental design for this study. Nine‐week‐old Apc Min/+ mice (n = 32; 20 for histological analysis, 12 for protein or RNA expression analysis) were divided into two groups: with or without metformin (250 mg/kg) treatment for 10 weeks. (b) Mean weights of Apc Min/+ mice in the control and metformin‐treated groups. Bodyweight was measured once a week for 10 weeks. No statistically significant differences in bodyweight between metformin‐treated and control groups were observed.
Bodyweight was measured once a week for 10 weeks. The intestines were collected and filled with 10% neutral‐buffered formalin. Number and size of the polyps, as well as their distribution in the intestine, were determined by examination under a stereoscopic microscope.
Western blot analysis. The intestinal polyps (>2.5 mm in diameter) were isolated mechanically and the tumor protein was extracted using the T‐PER tissue protein extraction reagent (Pierce, Rockford, IL, USA) with 1 mM Na3VO4, 25 mM NaF and one tablet of proteinase inhibitor cocktail (Complete Mini; Roche, Basel, Switzerland). Protein concentrations were determined using the Bio‐Rad Protein Assay Reagent (Bio‐Rad, Richmond, CA, USA). The extracted protein was separated by sodium dodecylsulfate polyacrylamide gel electrophoresis and the separated proteins were transferred onto a PVDF membrane (Amersham, London, UK). The membranes were blocked with 5% bovine serum albumin in Tris‐buffered saline and probed with primary antibodies specific for phospho‐AMPKα, AMPKα, phospho‐mTOR, mTOR, phospho‐S6K, S6K (all from Cell Signaling Technology, Danvers, MA, USA) and GAPDH (Trevigen, Gaithersburg, MD, USA). Horseradish peroxidase‐conjugated secondary antibodies and the ECL detection kit (Amersham) were used for the detection of specific proteins. The results were normalized to the signal generated from GAPDH.
Five polyps per mouse were analyzed by western blotting (a total of 30 polyps from each group) and representative images are demonstrated.
Gene expression analysis. Total RNA was extracted from the polyps using the RNeasy Mini Kit (Qiagen, Hilden, Germany). For real‐time reverse transcription polymerase chain reaction, total RNA was reverse‐transcribed into cDNA and amplified by real‐time quantitative polymerase chain reaction using the ABI PRISM 7700 System (Applied Biosystems, Foster City CA, USA). Probes and primer pairs specific for cyclin D1, c‐myc and β‐actin were purchased from Applied Biosystems. The concentrations of the target genes were determined using the competitive computed tomography method and values were normalized to the internal control. Ten polyps (>2.0 mm in diameter) from each group were analyzed.
Histological analyses. Paraffin‐embedded sections were deparaffinized and subjected to hematoxylin–eosin staining and immunohistochemistry for β‐catenin using Histofine simple stain mouse max PO kit (Nichirei Laboratories, Tokyo, Japan) in accordance with the manufacturer's instructions. The primary β‐catenin antibody (BD Transduction Laboratories, San Diego, CA, USA) was diluted 1:2000 and nuclear counterstaining was performed with hematoxylin. Isotype‐matched immunoglobulin was used as a control to determine the non‐specific staining. Three polyps from each mice were randomly selected and stained with β‐catenin (a total of 60 polyps were analyzed). The expression of β‐catenin detected via immunohistochemistry was quantitated by the scoring index according to Jawhari et al. and Oka et al. ( 20 , 21 ) All the histological findings were judged blind by two independent pathologists (N. N. and Y. N.).
Cell proliferation assay. We evaluated the 5‐bromodeoxyuridine (BrdU) labeling index to determine the proliferative activity of the tumor cells. BrdU (BD Biosciences, Franklin Lakes, NJ, USA) was used to label the tumor cells undergoing DNA replication. It was diluted in phosphate‐buffered saline at 1 mg/mL and 1 mg of BrdU solution was injected i.p. into mice 1 h prior to the killing of the mice. Immunohistochemical detection of BrdU was performed using a commercial kit (BD Biosciences). The BrdU labeling index was expressed as the percentage of cells showing positive staining for BrdU relative to the total number of cells. At least three to five representative areas in a section were selected by light‐microscopic examination at 400‐fold magnification and 1000–2000 tumor cells were counted as described previously.( 22 ) Three polyps (>2.0 mm in diameter) from each mouse were randomly selected and counted (a total of 60 polyps were analyzed). The counting of BrdU‐positive tumor cells in the polyp sections was repeated in triplicate and assessed blindly to reduce the bias in the results. Proliferation cell nuclear antigen (PCNA) was also used to label tumor cells undergoing DNA replication and the immunohistochemical detection of PCNA was performed using a commercial kit (Zymed Laboratories, South San Francisco CA, USA). The PCNA labeling index was determined identically as the BrdU index. The apoptotic tumor cells were stained using a transferase deoxytidyl uridine end labeling (TUNEL) staining kit according to the manufacturer's instruction (Wako Pure Chemical, Tokyo). The apoptotic index, which was expressed as the percentage of cells showing positive TUNEL staining relative to the total number of cells, was determined identically as the BrdU index.
Plasma lipid levels and insulin resistance. The levels of plasma triglycerides, cholesterol, insulin and glucose were measured using a WAKO enzyme‐linked immunosorbent assay (ELISA) kit (n = 10 from each group). Metformin is widely used as an antidiabetic drug to improve insulin resistance. Therefore, the status of insulin resistance as represented by homeostasis model assessment of insulin resistance (HOMA‐IR) was investigated. HOMA‐IR is calculated using the following formula: HOMA‐IR = fasting plasma immunoreactive insulin (IRI; µU/mL) × fasting plasma glucose (FBG; mg/dL)/405. We also measured the plasma concentration of triglycerides and cholesterol according to the manufacturer's instructions.
Statistical analyses. Statistical analysis for the blood tests was conducted using the Mann–Whitney U‐test. Other statistical analyses were performed using the Student's t‐test. Differences were considered significant at P < 0.05.
Results
Suppression of intestinal polyp growth by metformin in Apc Min/+ mice. It has been reported that the majority of polyps are located in the small intestine in ApcMin/+ mice.( 23 ) The total number of polyps in the small intestine was not significantly different between the control and metformin‐treated groups (Table 1). Therefore, the size distribution of intestinal polyps was investigated (Fig. 2a). Interestingly, the number of polyps ranging 1.0–1.5 mm in diameter was significantly increased and the number of polyps ranging 2.0–2.5 mm in diameter was significantly decreased with metformin treatment compared with the control (Fig. 2a). Therefore, we found that treatment with metformin significantly reduced the number of polyps larger than 2.0 mm in diameter (Fig. 2b). These results indicate that metformin reduced the size, but did not decrease the total number of intestinal polyps, suggesting that metformin may inhibit the growth of polyps.
Table 1.
Effect of metformin on the formation of polyps in Apc Min/+ mice
| Diet | No. of mice | No. of polyp/mouse | Average size of polyps (mm) | No. of polyps >2 mm |
|---|---|---|---|---|
| Control | 10 | 42.11 ± 4.76 | 1.935 ± 0.028 | 19.44 ± 3.87 |
| Metformin | 10 | 38.22 ± 4.53 | 1.648 ± 0.026* | 8.44 ± 2.38** |
Mean ± standard error significantly different from the basal diet group at *P = 0.039; **P = 0.019.
Figure 2.
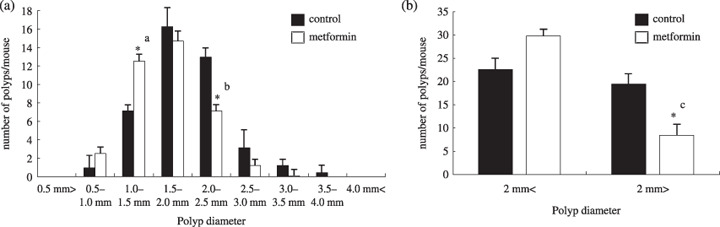
Effect of metformin on the number and the size distribution of intestinal polyps in Apc Min/+ mice. Apc Min/+ mice were fed either a basal diet or a diet containing metformin (250 mg/kg) for 10 weeks. (a) The number of polyps per mouse in each size class is given as a mean value. (b) Comparison of polyp size below 2 mm and over 2 mm in diameter. Bars represent standard error. *a P = 0.034; *b P = 0.032; *c P = 0.019.
Effect of metformin on proliferation of intestinal tumor cells. There was no histological difference observed in hematoxylin–eosin stained polyps between control and metformin‐treated Apc Min/+mice. In addition, no difference in the immunohistochemical staining pattern of β‐catenin in tumor tissues was observed between the control and metformin‐treated groups (Fig. 3a). There were also no significant differences in the pathological scoring indices of β‐catenin immunohistochemical staining in tumor cells between control and metformin‐treated groups (data not shown). The BrdU index of the intestinal polyps (>2 mm in diameter) in the metformin‐treated group was slightly decreased compared with the control group, but was not significantly different (n = 60, Fig. 3b). The same result was obtained by investigating the PCNA index (n = 52, Fig. 3c). The percentage of apoptotic cells in tumor tissues, investigated by TUNEL staining, was not significantly altered in the metformin‐treated group as compared to the control group (n = 48, Fig. 3d). These results suggest that metformin suppresses the intestinal polyp growth in Apc Min/+ mice neither through the significant inhibition of tumor cell proliferation nor through upregulation of apoptosis in tumor cells. To confirm these results, the gene expression analyses of cyclin D1 and c‐myc were performed, and no difference in the gene expression was detected in polyps of control and metformin‐treated groups (n = 20, Fig. 3e).
Figure 3.
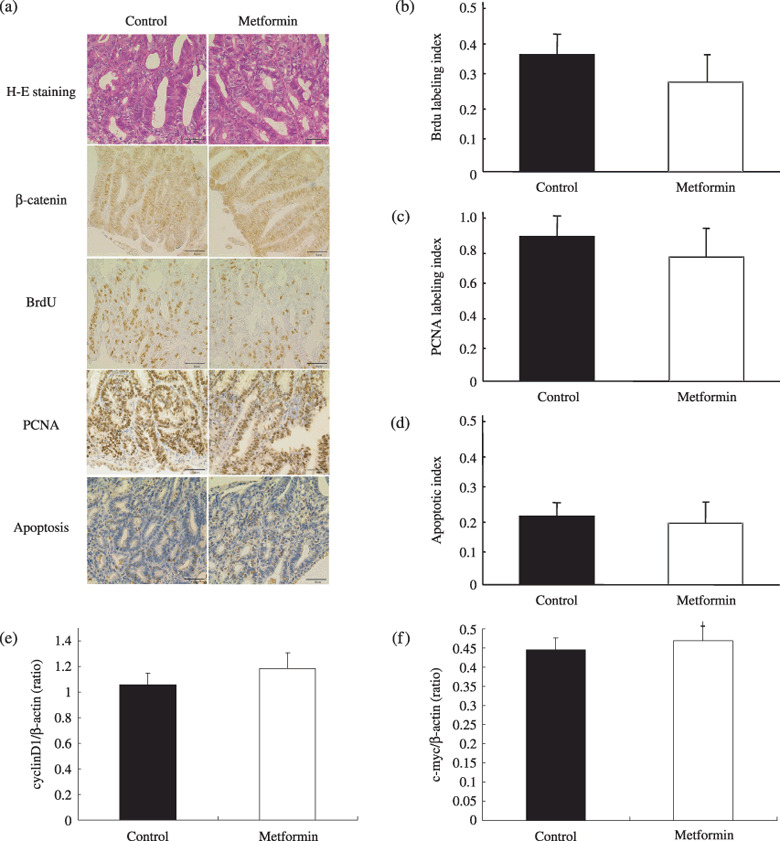
Immunohistochemistry for β‐catenin, cell proliferation assay using 5‐bromodeoxyuridine (BrdU) and proliferating cell nuclear antigen (PCNA), apoptosis assay, and gene expression analyses of cyclin D1 and c‐myc in the tumor cells. (a) HE staining and immunohistochemical staining for β‐catenin, BrdU and PCNA in intestinal tumors from Apc Min/+ mice fed a basal diet or treated with metformin. Transferase deoxytidyl uridine end labeling staining in tumors are also demonstrated. (b,c,d) Calculations for the BrdU, PCNA and apoptotic indices are detailed in Materials and Methods section. No significant difference was observed in each index category between metformin‐treated and control groups. Gene expression of (e) cyclin D1 and (f) c‐myc in intestinal polyps using real time reverse transcription polymerase chain reaction analysis are also shown. β‐Actin was used as the internal control. No significant difference was observed in these gene expression levels between metformin‐treated and control groups. Bars represent standard error.
Effect of metformin on plasma lipid levels and insulin resistance. Metformin is widely used as an antidiabetic drug that improves insulin resistance for patients with diabetes mellitus. Therefore, we investigated the effect of metformin on plasma lipid levels and insulin resistance. There was no significant difference in plasma triglyceride and cholesterol levels between the control and metformin‐treated groups at our experimental dosages (Fig. 4). In addition, blood glucose levels and insulin resistance, represented by HOMA‐IR, between the control and metformin‐treated groups were similar (Figs 4c.d). Furthermore, bodyweights between the two groups were similar (Fig. 1b). Because ApcMin/+ mice are not a diabetic model, it is reasonable that marked alterations were not observed in our experimental condition.
Figure 4.
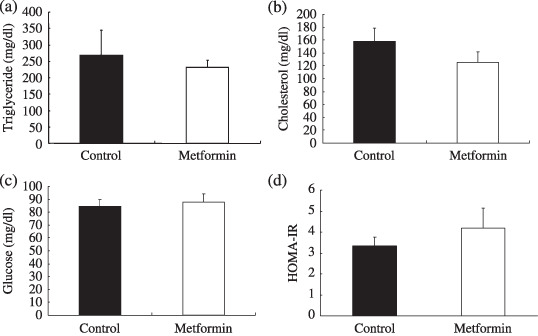
Plasma levels of insulin, triglyceride, cholesterol and glucose. Apc Min/+ mice were fed a basal diet (control) or a diet containing metformin (250 mg/kg). Plasma and blood were obtained after 12 h fasting. (a) Cholesterol, (b) triglyceride, (c) insulin, (d) blood glucose and (e) homeostasis model assessment of insulin resistance (HOMA‐IR) levels are shown. HOMA‐IR was used to calculate insulin resistance using the following formula: HOMA‐IR = fasting plasma immunoreactive insulin (IRI; µU/mL) × fasting plasma glucose (FBG; mg/dL)/405. No statistical significance was observed in the plasma levels of cholesterol, triglyceride and HOMA‐IR between metformin‐treated and control groups. Bars represent standard error.
Metformin‐mediated activation of AMPK inhibits the mTOR/S6K pathway in intestinal polyps. Western blotting showed abundant expression of AMPK in the intestine and colon as compared to the liver (Fig. 5e). It is speculated that one of the pharmacological targets of metformin is AMPK,( 10 ) which has been reported to inhibit the mTOR/S6K signaling pathway.( 15 ) Therefore, we hypothesized that metformin could inhibit the mTOR/S6K signaling pathway through activation of AMPK, resulting in downregulation of the protein synthesis machinery in the intestinal polyps. Western blot analysis revealed that the treatment with metformin stimulated AMPK phosphorylation in the intestinal polyps (Fig. 5a). Further, phosphorylation of mTOR and S6K proteins was significantly inhibited by the treatment with metformin (Fig. 5b–d). These results indicate that the treatment with metformin inhibits the mTOR/S6K/S6 signaling pathway, which may lead to the suppression of protein synthesis machinery in carcinogenesis.
Figure 5.
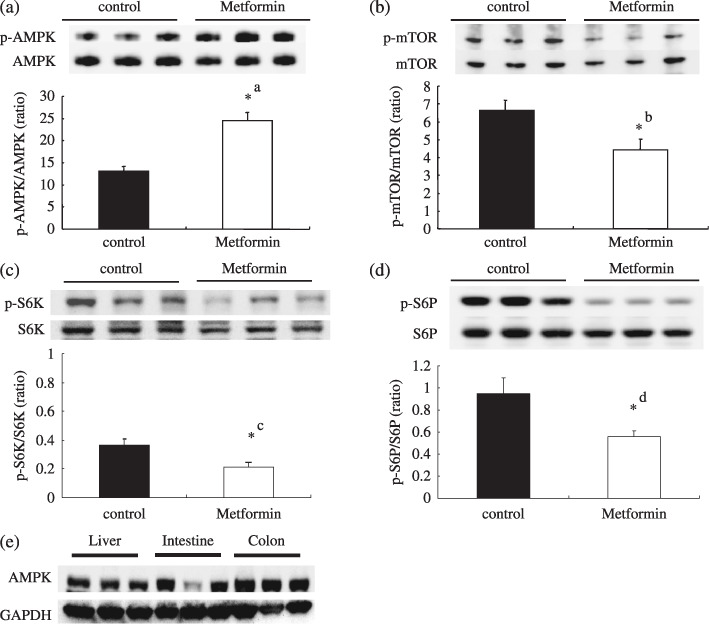
Treatment with metformin activates adenosine monophosphate‐activated protein kinase (AMPK) and downregulates the mammalian target of rapamycin (mTOR)/S6K pathway. Apc Min/+ mice were treated with a basal diet (control, n = 6) and a diet containing metformin (250 mg/kg, n = 6) for 10 weeks. Western blotting was performed using intestinal tumors (>2 mm in diameter) from both groups; five polyps from each mice were analyzed (a total of 60 polyps were assessed). Representative western blotting images are demonstrated. (a) Immunoblotting using antibodies against phosphorylated AMPK and total AMPK. The relative activity of phosphorylated AMPK against total AMPK is demonstrated. (b) Phospho‐mTOR, mTOR and relative activity of mTOR. (c) Phopho‐S6K/S6. (d) Phospho‐p70 protein S6 (S6)/total S6. (e) Western blotting analysis of the expression of AMPK in small intestine, colon and liver from Apc Min/+ mice. glyceraldehyde 3‐phosphate dehydrogenase (GAPDH) is shown as a loading control. Bars represent standard error. *a P = 0.0016; *b P = 0.0009; *c P = 0.0103; *d P = 0.0054.
Discussion
In the present study, we clearly showed that metformin suppressed intestinal polyp growth in Apc Min/+ mice, the first report regarding the inhibition of in vivo polyp growth by metformin.
Metformin is widely used as an antidiabetic drug that improves insulin resistance. Therefore, we investigated the effect of metformin on serum lipid levels and insulin resistance in order to determine the indirect effects of this drug. Our results demonstrated that metformin did not attenuate the blood glucose, HOMA‐IR and plasma lipid levels in Apc Min/+ mice, indicating that the suppression of polyp growth was due to some direct effects other than attenuation of insulin resistance or hyperlipidemia. In fact, Apc Min/+ mice are not a diabetic model, so it is understandable that metformin did not decrease the blood glucose level. Furthermore, according to the published work, no hypoglycemic side‐effects have been reported to date for metformin, whereas side‐effects are known for other antidiabetic drugs, such as sulfonyl‐urea, and no reports show that metformin has any therapeutic effect on hyperlipidemia.( 24 ) Therefore, our results are compatible with these previous clinical studies in that metformin did not attenuate the blood glucose, HOMA‐IR and plasma lipid levels in Apc Min/+ mice.
To examine the direct effect of metformin with regard to the growth inhibition of intestinal polyps, we analyzed the tumor cell proliferation by BrdU and PCNA immunostainings. Both BrdU and PCNA indices were decreased slightly, but not significantly by the metformin treatment. In addition to these results, the apoptotic cell index was also not altered by the treatment with metformin. Nuclear translocated β‐catenin plays an important role as a major transcription factor in regulation of tumor cell proliferation. In this study, we examined the immunohistochemical staining of β‐catenin in tumor tissues and found no difference in staining pattern between metformin‐treated and control polyps. These results were confirmed by the findings showing no difference in expression levels of cyclin D1 and c‐myc, which are the downstream genes of β‐catenin.
On the contrary, one of the known pharmacological actions of metformin is activation of AMPK.( 10 ) In addition, activation of AMPK has been reported to inhibit the mTOR signaling pathway.( 15 ) Therefore, we investigated whether metformin‐mediated activation of AMPK could be involved in the suppression of polyp growth in vivo. Our data suggested that metformin‐activated AMPK, resulting in the inhibition of mTOR and S6K protein activation. Because the mTOR signaling pathway is known to play important roles in the protein synthesis machinery, inhibition of the mTOR pathway by metformin‐mediated activation of AMPK may be one of the direct mechanisms to suppress polyp growth in vivo. There is abundant intestinal expression of AMPK, therefore the activation of AMPK by drugs, such as metformin, may be a novel therapeutic strategy in the chemoprevention of colorectal cancer. We present here only a proposed mechanism, further study will be necessary to elucidate the precise mechanisms underlying the suppressive effects of tumor growth mediated by such drugs.
In conclusion, metformin suppressed intestinal polyp growth in Apc Min/+ mice, potentially through the activation of AMPK, resulting in the inhibition of the mTOR/S6K signaling pathway and subsequent inhibition of the protein synthesis machinery. Further studies are needed to elucidate the precise mechanisms underlying inhibition of polyp growth by metformin. Metformin is a novel candidate for colon cancer chemoprevention.
Acknowledgments
We thank Machiko Hiraga for her technical assistance. This work was supported in part by a Grant‐in‐Aid for research on the Third Term Comprehensive Control Research for Cancer from the Ministry of Health, Labor and Welfare, Japan, to A. N., a grant from the National Institute of Biomedical Innovation (NBIO) to A. N., a grant from the Ministry of Education, Culture, Sports, Science and Technology, Japan (KIBAN‐B), to A. N, and a research grant of the Princess Takamatsu Cancer Research Fund to A. N.
References
- 1. Jemal A, Tiwari RC, Murray T et al . American Cancer Society. Cancer statistics, 2004. CA Cancer J Clin 2004; 54: 8–29. [DOI] [PubMed] [Google Scholar]
- 2. Moser AR, Pitot HC, Dove WF. A dominant mutation that predisposes to multiple intestinal neoclassic in the mouse. Science 1990; 247: 322–4. [DOI] [PubMed] [Google Scholar]
- 3. Corpet DE, Pierre F. Point: from animal models to prevention of colon cancer. Systematic review of chemoprevention in min mice and choice of the model system. Cancer Epidemiol Biomarkers Prev 2003; 12: 391–400. [PMC free article] [PubMed] [Google Scholar]
- 4. Su LK, Kinzler KW, Vogelstein B et al . Multiple intestinal neoplasia caused by a mutation in the murine homolog of the APC gene. Science 1992; 256: 668–70. [DOI] [PubMed] [Google Scholar]
- 5. He TC, Sparks AB, Rago C et al . Identification of c‐MYC as a target of the APC pathway. Science 1998; 281: 1509–12. [DOI] [PubMed] [Google Scholar]
- 6. Gupta RA, Dubois RN. Colorectal cancer prevention and treatment by inhibition of cyclooxygenase‐2. Nat Rev Cancer 2001; 1: 11–21. [DOI] [PubMed] [Google Scholar]
- 7. Psaty BM, Furberg CD. COX‐2 inhibitors – lessons in drug safety. N Engl J Med 2005; 352: 1133–5. [DOI] [PubMed] [Google Scholar]
- 8. Witters LA. The blooming of the French lilac. J Clin Invest 2001; 108: 1105–7. [DOI] [PMC free article] [PubMed] [Google Scholar]
- 9. Shaw RJ, Lamia KA, Vasquez D et al . The kinase LKB1 mediates glucose homeostasis in liver and therapeutic effects of metformin. Science 2005; 310: 1642–6. [DOI] [PMC free article] [PubMed] [Google Scholar]
- 10. Zhou G, Myers R, Li Y et al . Role of AMP‐activated protein kinase in mechanism of metformin action. J Clin Invest 2001; 108: 1167–74. [DOI] [PMC free article] [PubMed] [Google Scholar]
- 11. Carretero J, Medina PP, Blanco R et al . Dysfunctional AMPK activity, signaling through mTOR and survival in response to energetic stress in LKB1‐deficient lung cancer. Oncogene 2007; 26: 1616–25. [DOI] [PubMed] [Google Scholar]
- 12. Motoshima H, Goldstein BJ, Igata M, Araki E. AMPK and cell proliferation – AMPK as a therapeutic target for atherosclerosis and cancer. J Physiol 2006; 574: 63–71. [DOI] [PMC free article] [PubMed] [Google Scholar]
- 13. Mamane Y, Petroulakis E, LeBacquer O, Sonenberg N. mTOR, translation initiation and cancer. Oncogene 2006; 25: 6416–22. [DOI] [PubMed] [Google Scholar]
- 14. Hay N. The Akt‐mTOR tango and its relevance to cancer. Cancer Cell 2005; 8: 179–83. [DOI] [PubMed] [Google Scholar]
- 15. Martin DE, Hall MN. The expanding TOR signaling network. Curr Opin Cell Biol 2005; 17: 158–66. [DOI] [PubMed] [Google Scholar]
- 16. Zakikhani M, Dowling R, Fantus IG, Sonenberg N, Pollak M. Metformin is an AMP kinase‐dependent growth inhibitor for breast cancer cells. Cancer Res 2006; 66: 10269–73. [DOI] [PubMed] [Google Scholar]
- 17. Bergheim I, Guo L, Davis MA et al . Metformin prevents alcohol‐induced liver injury in the mouse: critical role of plasminogen activator inhibitor‐1. Gastroenterology 2006; 130: 2099–112. [DOI] [PMC free article] [PubMed] [Google Scholar]
- 18. Buzzai M, Jones RG, Amaravadi RK et al . Systemic treatment with the antidiabetic drug metformin selectively impairs p53‐deficient tumor cell growth. Cancer Res 2007; 67: 6745–52. [DOI] [PubMed] [Google Scholar]
- 19. Zou MH, Kirkpatrick SS, Davis BJ et al . Activation of the AMP‐activated protein kinase by the anti‐diabetic drug metformin in vivo. J Biol Chem 2004; 279: 43940–51. [DOI] [PubMed] [Google Scholar]
- 20. Jawhari A, Jordan S, Poole S, Browne P, Pignatelli M, Farthing MJ. Abnormal immunoreactivity of the E‐cadherin‐catenin complex in gastric carcinoma: relationship with patient survival. Gastroenterology 1997; 112: 46–54. [DOI] [PubMed] [Google Scholar]
- 21. Oka H, Shiozaki H, Kobayashi K et al . Expression of E‐cadherin cell adhesion molecules in human breast cancer tissues and its relationship to metastasis. Cancer Res 1993; 53: 1696–701. [PubMed] [Google Scholar]
- 22. William HG, Dan HM, Britt‐Marie L. The prognostic value of proliferation indices: a study with in vivo bromodeoxyuridine and Ki‐67. Breast Cancer Res Treatment 2000; 59: 113–23. [DOI] [PubMed] [Google Scholar]
- 23. Yamada Y, Hata K, Hirose Y et al . Microadenomatous lesions involving loss of Apc heterozygosity in the colon of adult Apc (Min/+) mice. Cancer Res 2002; 62: 6367–70. [PubMed] [Google Scholar]
- 24. Stumvoll M, Nurjhan N, Perriello G, Dailey G, Gerich JE. Metabolic effects of metformin in non‐insulin‐dependent diabetes mellitus. N Engl J Med 1995; 333: 550–4. [DOI] [PubMed] [Google Scholar]