

Abstract
Bortezomib, a selective 26S proteasome inhibitor, has shown clinical benefits against refractory multiple myeloma. The indirect anti‐angiogenic activity of bortezomib has been widely recognized; however, the growth‐inhibitory mechanism of bortezomib on vascular endothelial cells remains unclear, especially on the cell cycle. Here, we showed that bortezomib (2 nM of the IC50 value) potently inhibited the cellular growth of human umbilical vascular endothelial cells (HUVECs) via a vascular endothelial growth factor receptor (VEGFR)‐independent mechanism resulting in the induction of apoptosis. Bortezomib significantly increased the vascular permeability of HUVECs, whereas a VEGFR‐2 tyrosine kinase inhibitor decreased it. Interestingly, a cell cycle analysis using flow cytometry, the immunostaining of phospho‐histone H3, and Giemsa staining revealed that bortezomib suppressed the G2/M transition of HUVECs, whereas the mitotic inhibitor paclitaxel induced M‐phase accumulation. A further analysis of cell cycle‐related proteins revealed that bortezomib increased the expression levels of cyclin B1, the cdc2/cyclin B complex, and the phosphorylation of all T14, Y15, and T161 residues on cdc2. Bortezomib also increased the ubiquitination of cyclin B1 and wee1, but inhibited the kinase activity of the cdc2/cyclin B complex. These protein modifications support the concept that bortezomib suppresses the G2/M transition, rather than causing M‐phase arrest. In conclusion, we demonstrated that bortezomib potently inhibits cell growth by suppressing the G2/M transition, modifying G2/M‐phase‐related cycle regulators, and increasing the vascular permeability of vascular endothelial cells. Our findings reveal a cell cycle‐related mode of action and strongly suggest that bortezomib exerts an additional unique vascular disrupting effect as a vascular targeting drug. (Cancer Sci 2010)
The proteasome is an essential enzyme complex for nonlysosomal and ATP‐dependent proteolytic pathways. The ubiquitin–proteasome pathway plays an important role in the intracellular degradation of damaged, oxidized, or misfolded proteins( 1 , 2 , 3 , 4 ) as well as in the cell cycle progression. Such damaged, oxidized, or misfolded proteins have been identified as substrates for the ubiquitin/proteasome system.( 1 , 5 , 6 , 7 ) In addition, this system has been implicated in the regulation of cell proliferation, differentiation, survival, apoptosis, and angiogenesis.( 8 , 9 ) Because of these unique effects of the proteasome/ubiquitin system on cellular regulation, the proteasome is a novel and promising target for cancer therapy.( 10 , 11 , 12 )
Bortezomib (Velcade, PS‐341), a selective 26S proteasome inhibitor, demonstrates potent antitumor activity against several human cancers and has been clinically used mainly in patients with refractory multiple myeloma.( 13 , 14 , 15 ) The main mechanism of action of this drug was initially thought to be the inhibition of nuclear factor‐κB (NF‐κB), which acts as a transcription factor for anti‐apoptotic proteins, such as Bcl‐2, c‐IAP2, and survivin. Accumulating data indicates that bortezomib disrupts the cell cycle by modifying cyclins and inhibits the up‐regulation of interleukin‐6 (IL‐6), which plays an important role in the proliferation of myeloma cells, by inhibiting NF‐κB and stabilizing p53, p21, and p27, resulting in its anticancer activity.( 1 , 16 , 17 , 18 )
Bortezomib exerts an anti‐angiogenic effect by decreasing the secretion of vascular endothelial growth factor (VEGF) from myeloma cells.( 19 , 20 ) This anti‐angiogenic effect of bortezomib is considered an indirect effect on vascular endothelial cells resulting from ligand depletion. Meanwhile, direct negative proliferative effects of bortezomib on vascular endothelial cells have emerged which play an important role in its anti‐angiogenic activity. Roccaro et al. ( 9 ) reported that bortezomib induces inhibition of angiogenesis in functional assays of angiogenesis, including chemotaxis, adhesion to fibronectin, capillary formation on Matrigel, and chick embryo chorioallantoic membrane assay using multiple myeloma patient‐derived endothelial cells and human umbilical vein endothelial cells (HUVECs). Podar et al. ( 21 ) reported that Caveolin‐1 is a molecular target of bortezomib in multiple myeloma cells and HUVECs and this is required for VEGF‐triggered multiple myeloma. However the underlying mechanism responsible for the direct negative proliferative effect of bortezomib on vascular endothelial cells remains unclear, especially with regard to its effect on the cell cycle.
To gain insight into the direct anti‐angiogenic effects of bortezomib on HUVECs, we examined cellular proliferation, tube formation, VEGF receptor‐2 (VEGFR‐2) signaling, the apoptotic pathway, vascular permeability, cell cycle analysis, and effects of drugs on cell cycle‐related proteins.
Materials and Methods
Anticancer agents. Bortezomib was provided by Millennium Pharmaceuticals (Cambridge, MA, USA). The VEGFR‐2 tyrosine kinase inhibitor (VEGFR‐2‐TKI) Ki8751 (IC50 value for VEGFR‐2 kinase inhibition = 0.90 nM) was purchased from Sigma (St. Louis, MO, USA). Paclitaxel was purchased from Wako Pure Chemical Industries (Osaka, Japan). Each chemical agent was dissolved in dimethylsulfoxide for use in the in vitro experiments.
Cell cultures. HUVECs were maintained in Humedia‐EG2 (Kurabo, Tokyo, Japan) with 2% fetal bovine serum and 0.1% gentamicin‐amphotericinB with the addition of 10 ng/mL of epidermal growth factor, 5 ng/mL of fibroblast growth factor, and 2 ng/mL of VEGF (R&D Systems, Minneapolis, MN, USA). All the cell lines were incubated at 37°C with humidified 5% CO2.
In vitro growth inhibition assay. Growth inhibition was evaluated using the MTT assay, as described previously.( 22 ) The experiment was performed in triplicate.
Western blotting. The antibodies used for western blotting were anti‐phospho‐VEGFR‐2 (Tyr1175), anti‐VEGFR‐2, anti‐MAPK, anti‐phospho‐MAPK, anti‐β‐actin, anti‐cleaved or non‐cleaved‐caspase3, anti‐cleaved or non‐cleaved‐poly ADP‐ribose polymerase (PARP), anti‐cyclin B1, anti‐phospho‐cdc2, anti‐cdc2, anti‐phospho‐wee1, anti‐wee1, anti‐phospho‐cdc25C, anti‐cdc25C, anti‐phospho‐chk1 and ‐2, and anti‐chk1 and ‐2 (Cell Signaling, Beverly, MA, USA). HUVECs were cultured overnight in serum‐starved medium and then exposed to the indicated concentrations of bortezomib or Ki8751 for 3 h before the addition of 10 ng/mL of VEGF for 5 min. The western blot analysis was performed as described previously.( 23 ) The experiment was performed in duplicate.
Immunoprecipitation. Total cell lysates were immunoprecipitated with anti‐wee1, cdc2 antibodies (Cell Signaling), or anti‐cyclin B1 antibody (Santa Cruz Biotechnology, Santa Cruz, CA, USA) overnight at 4°C. The protein complex was incubated with protein G‐agarose (Invitrogen, San Diego, CA, USA) for 1 h at 4°C and washed three times with lysis buffer. After sequential centrifugation and washing, the pellets were resuspended in 1.5 × sample loading buffer and subjected to immunoblot analyses.
Cell cycle analysis. Cells were treated with the indicated concentrations of bortezomib for 24 h. The cells were then harvested, washed with PBS, fixed with 70% ethanol at −20°C overnight, washed again with PBS, and then stained with 5 μg/mL of propidium iodide containing 0.1% Triton X‐100, 0.1 mM EDTA, and RNase I (BD Bioscience, San Jose, CA, USA). The stained cells were then analyzed for DNA content using a FACS Calibur flow cytometer (BD Biosciences) and the cell cycle distributions were calculated using ModFit LT software. The experiment was performed in triplicate.
Giemsa staining. Morphological changes in mitotic cells were evaluated using Giemsa staining. HUVECs treated with bortezomib (1 μM) or paclitaxel (1 μM) for 24 h were fixed with 10% neutral‐buffered formaldehyde before staining and were stained for 30 min, then washed with tap water for 5 min. The morphological changes were evaluated using a light microscope (×40).
Immunofluorescence staining of phospho‐histone H3. HUVECs were treated with 1 μM of bortezomib or paclitaxel for 24 h and were then fixed and permeabilized with 4% formaldehyde/PBS for 15 min. The cells were blocked with 5% normal goat serum in PBS for 60 min. After washing, anti‐phospho‐histone H3 antibody (Cell Signaling) was diluted 1:200 in PBS/Triton and incubated for 1 h at room temperature, followed by detection using Alexa Fluor 594 goat antirabbit IgG antibody (Invitrogen) for 1 h. After washing, the cells were counterstained with 1 μg/mL of 4′,6‐diamidino‐2‐phenylindole (DAPI) in PBS for 5 min. Images were obtained using fluorescence microscopy (IX71; Olympus, Tokyo, Japan). The mitotic index was calculated by dividing the number of p‐Histone H3‐positive cells by the total number of treated cells (DAPI‐positive cells). At least 100 cells were scored per low‐power field, and the cells were counted over three fields. The experiment was performed in triplicate.
cdc2/cyclinB1 kinase assay. The cdc2/cyclinB1 kinase activity in the cells was quantified using a Cyclex Cdc2‐CylinB Kinase Assay Kit (Cyclex, Nagano, Japan) according to the manufacturer’s instructions. The experiment was performed in triplicate.
In vitro permeability assay. Transwell permeability assays were performed using monolayers of HUVECs and an in vitro vascular permeability assay kit (Chemicon, Temecula, CA, USA). Briefly, HUVECs seeded onto collagen‐coated inserts were pretreated with or without bortezomib (1, 0.1 μM) or VEGFR‐2‐TKI (1 μM) for 6 h, and VEGF (20 ng/mL) was added, except in the control sample, 4 h thereafter. Two hours after the addition of VEGF, fluorescein isothiocyanate dextran (FITC dextran) was added on the top of the cells and the extent of FITC dextran permeation was determined by measuring the fluorescence of the plate well solution, according to the supplier’s instructions. The experiment was performed in triplicate.
Results
Bortezomib potentially inhibited the cellular growth of HUVECs independent of VEGF signaling. To evaluate the growth inhibitory activity of bortezomib in vitro, we performed MTT assays on HUVECs under the 20 ng/mL of VEGF or without it. Bortezomib exhibited a potent growth inhibitory activity on HUVECs with an IC50 of 2 nM; however, VEGF stimulation did not influence the growth inhibitory activity of bortezomib (Fig. 1a).
Figure 1.
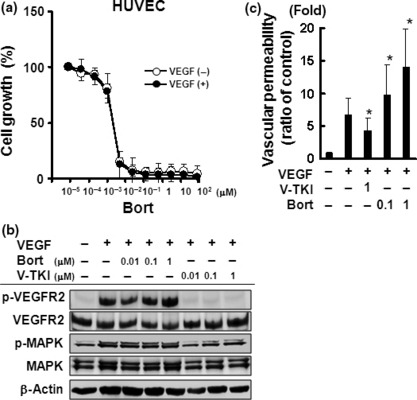
Bortezomib potently inhibited the cellular growth and increased the vascular permeability of HUVECs. (a) In vitro growth‐inhibitory effect of bortezomib on HUVECs using an MTT assay with 10 ng/mL vascular endothelial growth factor (VEGF) or without it. The data shown represents the average ± SD of three independent experiments. (b) Effects of bortezomib on VEGF signaling in HUVECs. Western blot analysis was performed for the expression and phosphorylation levels of VEGF receptor‐2 (VEGFR‐2) and MAPK. HUVECs were cultured under serum‐starved conditions and exposed to bortezomib or Ki8751 at the indicated concentrations for 3 h. After 10 ng/mL VEGF stimulation for 5 min, the cells were analyzed. (c) Effect of bortezomib on vascular permeability in vitro. HUVECs were seeded onto collagen‐coated inserts and were pretreated with or without bortezomib (0.1 and 1 μM) or VEGFR‐2 tyrosine kinase inhibitor (VEGFR‐2‐TKI) (1 μM) for 6 h. After 20 ng/mL of VEGF stimulation for 2 h, fluorescein isothiocyanate dextran (FITC dextran) was added on the top of the inserts and the extent of FITC dextran permeation was determined by measuring the fluorescence of the plate well solution. The relative vascular permeability was calculated using the ratio to the permeability in the control cells (untreated). The data shown represents the average ± SD of three independent experiments. *P < 0.05. Bort, bortezomib; V‐TKI, VEGFR‐2‐TKI.
To address the question whether the growth inhibitory activity of bortezomib involves VEGFR‐2 signaling, we compared the inhibitory effects of bortezomib with that of a VEGFR‐2‐TKI, Ki8751, on the phosphorylation levels of VEGFR and MAPK. Bortezomib did not inhibit the phosphorylation level of VEGFR‐2, whereas Ki8751 (0.01–1 μM) completely inhibited VEGFR‐2 phosphorylation (Fig. 1b). Similar results were observed for MAPK phosphorylation. These results indicate that the growth inhibitory activity of bortezomib is induced via a VEGFR‐2 signaling‐independent mechanism.
Bortezomib increases vascular permeability in vitro. Generally, the characteristics of vascular disrupting agents include a potent anti‐proliferative effect. Microtubule‐binding drugs (MBD) are widely used in cancer chemotherapy and also have clinically relevant vascular‐disrupting properties. The disruption of adherens junctions contributes to the rounding of endothelial cells, leading to a direct increase in vasculature permeability.( 24 ) Therefore, we examined the effect of bortezomib on vasculature permeability to gain an insight into its vascular‐disrupting properties. As expected, Ki8751 significantly decreased vasculature permeability during VEGF stimulation, in contrast to the situation in untreated controls. On the other hand, bortezomib significantly increased the vasculature permeability of vasculature endothelial cells in a dose‐dependent manner (Fig. 1c). This result supports the hypothesis that bortezomib has vascular‐disrupting properties in HUVECs in addition to its potent growth inhibitory effect.
Bortezomib induces apoptosis of HUVECs. We speculated that the potent growth inhibitory activity of bortezomib was based on the induction of apoptosis; thus, we evaluated the expression levels of cleaved caspase 3, cleaved PARP, and ubiquitinated protein from whole cell lysates. The expression levels of cleaved caspase 3 and PARP showed that bortezomib induced the activation of caspase 3 at a dose of 0.1 μM and subsequent PARP cleavage in HUVECs in a dose‐ and time‐dependent manner (Fig. 2). The accumulation of ubiquitinated proteins, which represents a direct effect of bortezomib, was observed at 0.01 μM in a time‐dependent manner. These findings indicate that bortezomib is capable of inducing the apoptosis of HUVECs at a relatively low concentration.
Figure 2.
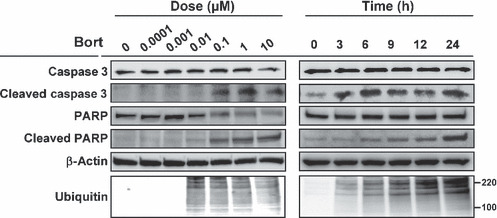
Bortezomib induces apoptosis of HUVECs. Western blot analysis was performed for the cleaved form and the expression levels of caspase 3, poly ADP‐ribose polymerase (PARP), and whole ubiquitinated‐protein. HUVECs were treated with bortezomib at the indicated concentrations for 24 h and analyzed (left panel), or they were treated with bortezomib at 0.1 μM for the indicated hours (right panel). Protein size markers are shown at 100 and 220 kDa.
Bortezomib inhibits G2/M transition. An analysis of the cell cycle distribution of HUVECs revealed that bortezomib significantly increased the population of cells in the G2/M phase (Fig. 3a). This effect was observed when the cells were exposed to 0.01 μM of bortezomib. Generally, morphological changes, including the disappearance of the nuclear membrane, chromosomal condensation, and cytoplasmic round formation, are observed in mitotic cells. Therefore, we evaluated whether bortezomib induced morphological changes in HUVECs specific to mitotic cells. Paclitaxel, a well‐known tubulin binder and mitotic inhibitor, was used as a control. Paclitaxel clearly induced these morphological changes specific to mitotic cells; however, bortezomib did not induce these changes with Giemsa staining (Fig. 3b). Further analysis using phospho‐histone H3 immunostaining, an M‐phase‐specific marker, demonstrated that bortezomib significantly decreased the number of mitotic cells while paclitaxel markedly increased it (Fig. 3c,d). Together, these results indicated that both bortezomib and paclitaxel induced cell cycle arrest at the G2/M phase; however, bortezomib did not increase the number of mitotic cells unlike paclitaxel. These results suggest that bortezomib inhibits the G2/M transition in HUVECs.
Figure 3.
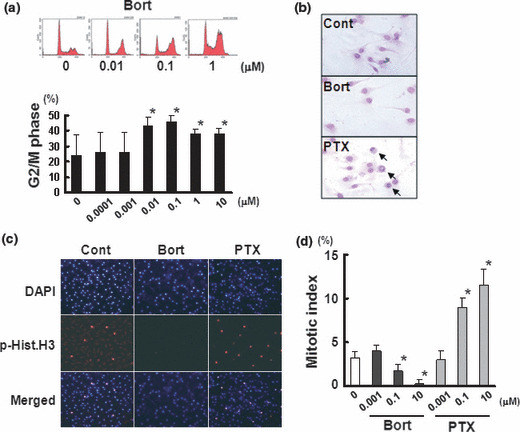
Bortezomib suppress the G2/M transition. (a) DNA histogram of HUVECs treated with bortezomib. HUVECs were treated with bortezomib at the indicated concentrations. The upper panel represents the result of a flow cytometry analysis, and the lower panel shows the population at the G2/M phase. *P < 0.05. (b) Giemsa staining of HUVECs treated with bortezomib or paclitaxel at 1 μM. The arrows indicate cells with mitotic changes (disappearance of the nuclear membrane, chromosomal condensation, and cytoplasmic round formation). (c) Immunostaining for phospho‐histone H3 (p‐Hist.H3) and 4′,6‐diamidino‐2‐phenylindole (DAPI) observed with fluorescence microscopy. p‐Hist.H3 was used as an M‐phase‐specific molecular marker. Note that both bortezomib and paclitaxel induced cell cycle arrest at the G2/M phase, but unlike paclitaxel, bortezomib did not increase the number of cells in the M phase. (d) Mitotic index after treatment with bortezomib or paclitaxel at the indicated concentrations in HUVECs. The mitotic index was calculated using the number of p.Hist.H3‐positive cells per the total number of cells (DAPI‐positive cells). The columns indicate the average ± SD of three independent experiments. *P < 0.05. Bort, bortezomib; Cont, untreated control; PTX, paclitaxel.
Bortezomib decreases cdc2/cyclinB kinase activity. Cell cycle progression at the G2/M transition is regulated by cdc2/cyclin B complex activity, and the activation of this complex is controlled as a consecutive process as follows: (i) the levels of cyclin B protein are increased during late S and G2 phases; (ii) cyclin B binds to unphosphorylated cdc2 and forms an inactive cdc2/cyclinB complex; (iii) cdc2 is phosphorylated at its T14, Y15, and T161 residues during the G2 phase; and (iv) the dephosphorylation of T14 and Y15 on cdc2 by phosphatase cdc25 activates the cdc2/cyclin B complex and introduces the cells to mitosis.
Bortezomib increased the expression of cyclin B1 in a dose‐ and time‐dependent manner, and an immunoprecipitation analysis showed that bortezomib also increased the production of cdc2/cyclin B complexes (Fig. 4a). Bortezomib markedly increased the phosphorylation status of the T14, Y15, and T161 residues on cdc2 in a dose‐ and time‐dependent manner, suggesting that bortezomib promoted the presence of the inactive form of the cdc2/cyclin B complex (Fig. 4b). These results showed that bortezomib inhibits the G2/M transition. In addition, we examined the effects on a competing kinase, wee1, and the phosphatase cdc25C. Increased expression and phosphorylation levels of wee1 were observed after bortezomib treatment, whereas no remarkable changes in cdc25C expression or phosphorylation were observed (Fig. 4b). Regarding the effects of bortezomib on the proteasome–ubiquitin pathway, we found that the ubiquitination of wee1 and cyclin B protein was increased by bortezomib in a dose‐dependent manner, suggesting that the increase in the ubiquitination of wee1 and cyclin B may be at least partially involved in the suppression of the G2/M transition and the mode of action of this drug (Fig. 5a). Finally, a kinase assay of the cdc2/cyclin B complex showed that bortezomib (0.01 μM) significantly inhibited the kinase activity of the complex, indicating that the inhibition of kinase activity might suppress the G2/M transition (Fig. 5b).
Figure 4.
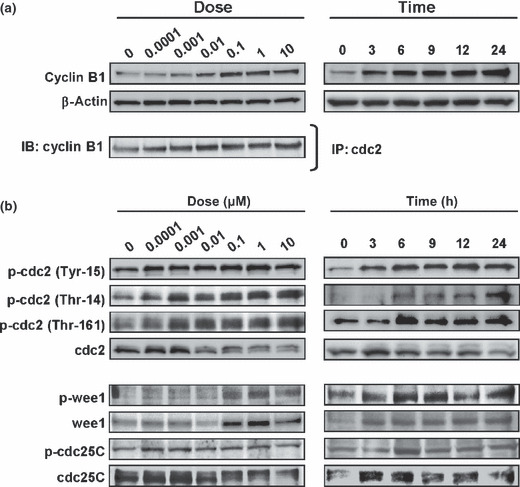
Bortezomib increases the expression levels of cyclin B1, the production of the cdc2/cyclin B complex, and the phosphorylation of the T14, Y15, and T161 residues on cdc2 in HUVECs. (a) Western blots of the cyclin B1 expression levels in whole protein (upper panel) and samples immunoprecipitated with a cdc2 antibody (lower panel). (b) Western blots for G2/M‐phase‐related cell cycle regulators. HUVECs were treated with bortezomib at the indicated concentrations for 24 h and for the indicated hours at 0.1 μM. IB, immunoblots; IP, immunoprecipitation.
Figure 5.
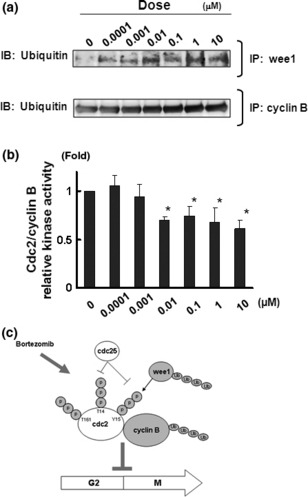
Bortezomib increases the ubiquitination of cyclin B1 and wee1 and inhibits the kinase activity of cdc2/cyclin B. (a) Western blots for the ubiquitination levels in the samples immunoprecipitated with wee1 antibody (lower panel) or cyclin B1 antibody (lower panel). (b) Kinase activity of cdc2/cyclin B in HUVECs treated with bortezomib at the indicated concentrations. Whole cell lysates were used for the analysis. The relative kinase activity was calculated using the ratio to the activity level in the control (untreated). The data shown represents the average ± SD of three independent experiments. *P < 0.05. (c) Schematic diagram of the effects of bortezomib on G2/M‐phase cell cycle progression in vascular endothelial cells. Bortezomib increases the expression levels of cyclin B1, the production of the cdc2/cyclin B complex, and the phosphorylation of the T14, Y15, and T161 residues on cdc2. Bortezomib also increases the ubiquitination of cyclin B1 and wee1. Changes in the expression or phosphorylation levels of cdc2 were not detected. These modifications of G2/M‐phase‐related cell cycle regulators suggest that bortezomib suppresses the G2/M transition.
Together, these results revealed that bortezomib increases the expression levels of cyclin B1, the formation of the cdc2/cyclin B complex, the phosphorylation of T14, Y15 and T161 residues on cdc2, and the ubiquitination of cyclin B1 and wee1. Bortezomib also significantly inhibited the kinase activity of cdc2/cyclin B. These modifications of G2/M‐phase‐related cell cycle regulators suggest that bortezomib suppresses the G2/M transition (Fig. 5c). We concluded that bortezomib potently inhibits cell growth of vascular endothelial cells by suppressing the G2/M transition through modifying G2/M‐phase‐related cycle regulators.
Discussion
Inhibition of the 26S proteasome results in the accumulation of cyclins A, B, D, E, p21, and p27, thereby disrupting the cell cycle and promoting cell death via multiple pathways.( 25 ) In cancer cells, bortezomib leads to an increase in the accumulation and activation of G2/M‐phase‐related cycle regulators cyclin A and cyclin B1, and also leads to cell cycle blockade at the G2/M phase.( 1 ) However, whether bortezomib inhibits G2/M transition or induces M‐phase arrest has been uncertain. In addition, no data on the effects of bortezomib on the cell cycle arrest at the G2 phase in vascular endothelial cells has been available. Our data showed that bortezomib caused cell cycle arrest at the G2 phase, not at the M phase, using Giemsa staining and immunofluorescence staining of the phospho‐histone H3 in HUVECs (Fig. 3). Because bortezomib inhibits the G2/M transition, we focused on changes in G2/M‐phase‐related cell cycle regulators, such as cyclin B and cdc2. We found that bortezomib increased the expression levels of cyclin B, ubiquitinated cyclin B, and the cyclin B/cdc2 complex in dose‐and time‐dependent manners (4, 5). Further analysis revealed that the phosphorylation statuses of the T14, Y15, and T161 residues on cdc2 were markedly increased, indicating the presence of the inactive form of cdc2 that occurs during G2 arrest; the kinase activity of the cyclin B/cdc2 complex was also inhibited by this treatment (4, 5). These data indicate that bortezomib inhibits the G2/M transition, rather than causing M‐phase arrest. Since few anticancer drugs are known to suppress the G2/M transition, our results provide an insight to the unique mode of action of bortezomib. The expression, ubiquitination, and phosphorylation of wee1 were markedly increased after bortezomib treatment. Wee1 degrades via the proteasome–ubiquitin pathway, similar to cyclin B, and activated wee1 inhibits cdc2 kinase activity. Therefore, these results raise the possibility that wee1 is involved in the mode of action of bortezomib.
Vascular targeting agents (VTAs) including VEGFR‐TKIs target the development of new vessels and have a preventative action, require chronic administration, and are likely to be of particular benefit in early stage or asymptomatic metastatic disease. Meanwhile, vascular disrupting agents (VDAs) target established tumor blood vessels,( 26 ) causing a rapid collapse in tumor blood flow leading to a prolonged period of vascular shutdown and culminating in the extensive necrosis of tumor cells.( 27 ) VDAs are therefore given acutely, show immediate effects, and may have particular efficacy against advanced disease. Thus, VDAs are considered to be different from VTAs in some key aspects including the type or extent of disease which has sensitivity to the agents and the treatment scheduling.( 26 )
Generally, the characteristics of VDAs include a potent anti‐proliferative effect, the induction of G2/M‐phase arrest, and an increase in vascular permeability.( 28 ) Our results indicate that bortezomib exerts similar effects on vascular endothelial cells. Thus, we speculate that bortezomib could be categorized as a VDA and that the vascular disrupting effect of bortezomib might be at least partly responsible for its antitumor activity.
In conclusion, we demonstrated that bortezomib potently inhibits cellular growth by suppressing the G2/M transition in vascular endothelial cells. Our findings strongly suggest that bortezomib has a unique additional vascular disrupting effect.
Acknowledgments
We thank Mr Shinji Kurashimo, Mr Yoshihiro Mine, and Ms Tomoko Kitayama for their technical assistance. This work was supported in part by the Third‐Term Comprehensive 10‐Year Strategy for Cancer Control, the Program for the Promotion of Fundamental Studies in Health Sciences of the National Institute of Biomedical Innovation (NiBio), funds for Health and Labor Scientific Research Grants, and a Grant‐in‐Aid for Scientific Research (A).
References
- 1. Ling YH, Liebes L, Jiang JD et al. Mechanisms of proteasome inhibitor PS‐341‐induced G(2)‐M‐phase arrest and apoptosis in human non‐small cell lung cancer cell lines. Clin Cancer Res 2003; 9: 1145–54. [PubMed] [Google Scholar]
- 2. Hochstrasser M. Ubiquitin, proteasomes, and the regulation of intracellular protein degradation. Curr Opin Cell Biol 1995; 7: 215–23. [DOI] [PubMed] [Google Scholar]
- 3. Jentsch S, Schlenker S. Selective protein degradation: a journey’s end within the proteasome. Cell 1995; 82: 881–4. [DOI] [PubMed] [Google Scholar]
- 4. Hershko A, Ciechanover A. The ubiquitin system. Annu Rev Biochem 1998; 67: 425–79. [DOI] [PubMed] [Google Scholar]
- 5. Desai SD, Liu LF, Vazquez‐Abad D, D’Arpa P. Ubiquitin‐dependent destruction of topoisomerase I is stimulated by the antitumor drug camptothecin. J Biol Chem 1997; 272: 24159–64. [DOI] [PubMed] [Google Scholar]
- 6. Ciechanover A, DiGiuseppe JA, Bercovich B et al. Degradation of nuclear oncoproteins by the ubiquitin system in vitro. Proc Natl Acad Sci U S A 1991; 88: 139–43. [DOI] [PMC free article] [PubMed] [Google Scholar]
- 7. Treier M, Staszewski LM, Bohmann D. Ubiquitin‐dependent c‐Jun degradation in vivo is mediated by the delta domain. Cell 1994; 78: 787–98. [DOI] [PubMed] [Google Scholar]
- 8. Grimm LM, Goldberg AL, Poirier GG, Schwartz LM, Osborne BA. Proteasomes play an essential role in thymocyte apoptosis. EMBO J 1996; 15: 3835–44. [PMC free article] [PubMed] [Google Scholar]
- 9. Roccaro AM, Hideshima T, Raje N et al. Bortezomib mediates antiangiogenesis in multiple myeloma via direct and indirect effects on endothelial cells. Cancer Res 2006; 66: 184–91. [DOI] [PubMed] [Google Scholar]
- 10. Rajkumar SV, Richardson PG, Hideshima T, Anderson KC. Proteasome inhibition as a novel therapeutic target in human cancer. J Clin Oncol 2005; 23: 630–9. [DOI] [PubMed] [Google Scholar]
- 11. Mani A, Gelmann EP. The ubiquitin‐proteasome pathway and its role in cancer. J Clin Oncol 2005; 23: 4776–89. [DOI] [PubMed] [Google Scholar]
- 12. Genini D, Carbone GM, Catapano CV Multiple Interactions between Peroxisome Proliferators‐Activated Receptors and the Ubiquitin‐Proteasome System and Implications for Cancer Pathogenesis. PPAR Res 2008; 2008: 195065. [DOI] [PMC free article] [PubMed] [Google Scholar]
- 13. APEX (Assessment of Proteasome inhibition for Extending remissions) trial: phase III randomized, multicenter, placebo‐controlled trial to evaluate the efficacy and safety of bortezomib versus dexamethasone in patients with recurrent or treatment‐resistant multiple myeloma. Clin Adv Hematol Oncol 2003; 1: 190. [PubMed] [Google Scholar]
- 14. Jung L, Holle L, Dalton WS. Discovery, Development, and clinical applications of bortezomib. Oncology (Williston Park) 2004; 18: 4–13. [PubMed] [Google Scholar]
- 15. Richardson PG, Sonneveld P, Schuster MW et al. Bortezomib or high‐dose dexamethasone for relapsed multiple myeloma. N Engl J Med 2005; 352: 2487–98. [DOI] [PubMed] [Google Scholar]
- 16. Pham LV, Tamayo AT, Yoshimura LC, Lo P, Ford RJ. Inhibition of constitutive NF‐kappa B activation in mantle cell lymphoma B cells leads to induction of cell cycle arrest and apoptosis. J Immunol 2003; 171: 88–95. [DOI] [PubMed] [Google Scholar]
- 17. Hideshima T, Richardson P, Chauhan D et al. The proteasome inhibitor PS‐341 inhibits growth, induces apoptosis, and overcomes drug resistance in human multiple myeloma cells. Cancer Res 2001; 61: 3071–6. [PubMed] [Google Scholar]
- 18. Strauss SJ, Higginbottom K, Juliger S et al. The proteasome inhibitor bortezomib acts independently of p53 and induces cell death via apoptosis and mitotic catastrophe in B‐cell lymphoma cell lines. Cancer Res 2007; 67: 2783–90. [DOI] [PubMed] [Google Scholar]
- 19. Hayashi T, Hideshima T, Anderson KC. Novel therapies for multiple myeloma. Br J Haematol 2003; 120: 10–7. [DOI] [PubMed] [Google Scholar]
- 20. Hideshima T, Chauhan D, Podar K, Schlossman RL, Richardson P, Anderson KC. Novel therapies targeting the myeloma cell and its bone marrow microenvironment. Semin Oncol 2001; 28: 607–12. [DOI] [PubMed] [Google Scholar]
- 21. Podar K, Shringarpure R, Tai YT et al. Caveolin‐1 is required for vascular endothelial growth factor‐triggered multiple myeloma cell migration and is targeted by bortezomib. Cancer Res 2004; 64: 7500–6. [DOI] [PubMed] [Google Scholar]
- 22. Takeda M, Arao T, Yokote H et al. AZD2171 shows potent antitumor activity against gastric cancer over‐expressing fibroblast growth factor receptor 2/keratinocyte growth factor receptor. Clin Cancer Res 2007; 13: 3051–7. [DOI] [PubMed] [Google Scholar]
- 23. Matsumoto K, Arao T, Tanaka K et al. mTOR signal and hypoxia‐inducible factor‐1 alpha regulate CD133 expression in cancer cells. Cancer Res 2009; 69: 7160–4. [DOI] [PubMed] [Google Scholar]
- 24. Schwartz EL. Antivascular actions of microtubule‐binding drugs. Clin Cancer Res 2009; 15: 2594–601. [DOI] [PMC free article] [PubMed] [Google Scholar]
- 25. Leonard JP, Furman RR, Coleman M. Proteasome inhibition with bortezomib: a new therapeutic strategy for non‐Hodgkin’s lymphoma. Int J Cancer 2006; 119: 971–9. [DOI] [PubMed] [Google Scholar]
- 26. Lippert JW III. Vascular disrupting agents. Bioorg Med Chem 2007; 15: 605–15. [DOI] [PubMed] [Google Scholar]
- 27. Tozer GM, Kanthou C, Baguley BC. Disrupting tumour blood vessels. Nat Rev Cancer 2005; 5: 423–35. [DOI] [PubMed] [Google Scholar]
- 28. Siemann DW, Bibby MC, Dark GG et al. Differentiation and definition of vascular‐targeted therapies. Clin Cancer Res 2005; 11: 416–20. [PubMed] [Google Scholar]