

Abstract
Cell surface proteolysis is important for the generation of bioactive proteins mediating tumor progression. Recent studies suggest that the membrane‐anchored cell surface proteinases matriptase and hepsin have significant roles in tumors. We analyzed the expression and clinical relevance of matriptase and hepsin, and their inhibitors hepatocyte growth factor activator inhibitor type 1 (HAI‐1) and type 2 (HAI‐2) in 66 cases of conventional renal cell carcinomas (RCC). The mRNA level was evaluated in paired samples from tumor and non‐tumorous renal tissues by real‐time reverse transcription–polymerase chain reaction. As matriptase and hepsin potently activate the proform of hepatocyte growth factor (HGF), the expression of HGF and its receptor, c‐Met, was also analyzed. Although upregulation of matriptase was observed occasionally in RCC, the expression level was not associated with prognostic parameters. Hepsin was downregulated in RCC, particularly in early stage disease, but upregulated in advanced stages. There was a trend of higher hepsin expression in RCC with distant metastasis, and Kaplan–Meier survival curves showed that high hepsin expression was associated with reduced overall survival (P < 0.01, log‐rank test). Moreover, multivariate analysis indicated that hepsin was an independent prognostic factor. Overexpression of HGF or c‐Met also showed reduced overall survival. We also observed a tendency of low HAI‐2 expression with reduced overall survival and a statistical association between high hepsin and low HAI‐2 level. No associations were observed between matriptase and HAI‐1 and HAI‐2. Our findings suggest that the balance between hepsin and its inhibitor, HAI‐2, may have prognostic value in RCC. (Cancer Sci 2007; 98: 491–498)
It is well known that deregulated proteolysis is a hallmark of cancer. Proteolytic activities in the pericellular microenvironment are critically important for cancer cells to enable growth, survival and invasion. Membrane‐anchored serine proteinases are a recently emerging group of cell surface enzymes with potential roles in cancer. So far more than 20 enzymes that belong to this group have been reported.( 1 ) Among them, a number of recent studies have indicated that matriptase (also known as membrane‐type serine protease 1) and hepsin are involved in malignant progression of various cancers.( 1 , 2 , 3 , 4 , 5 , 6 , 7 ) Both matriptase and hepsin are type 2 transmembrane proteins with an extracellular serine proteinase domain, and show enhanced expression in a variety of tumor tissues.( 1 ) Matriptase has been proposed to initiate signaling and proteolytic cascades through its ability to activate pro‐urokinase and protease‐activated receptor 2,( 8 , 9 ) and hepsin is thought to be involved in the activation of the coagulation cascade.( 10 ) Moreover, recent studies have revealed that both enzymes efficiently activate the proform of hepatocyte growth factor (HGF), a multifunctional growth factor acting through its high‐affinity receptor tyrosine kinase, c‐Met.( 8 , 9 , 11 )
A significant body of evidence has accumulated suggesting that the HGF/c‐Met signaling axis is involved in tumor progression.( 12 ) HGF is secreted as an inactive single‐chain precursor (proHGF) that lacks biological activity, and requires proteolytic cleavage for conversion to an active two‐chain mature form.( 13 , 14 ) Enhanced activation of proHGF has been observed in tumors.( 14 , 15 , 16 , 17 ) To date, two different activation modalities for proHGF have been proposed. One is activation by a serum serine proteinase (serum activator) called HGF activator (HGFA).( 13 ) HGFA is synthesized mainly by the liver and circulates in blood as an inactive proform. This HGFA zymogen (proHGFA) is activated exclusively in response to tissue injury, including cancer tissues, probably via thrombin.( 14 , 15 , 18 ) The other proHGF activation system involves cellular surface serine proteinases (cellular activators). Matriptase and hepsin are potential candidates for the cellular activators of proHGF in cancer tissue.( 8 , 11 , 13 ) Importantly, the activities of these proteinases are closely controlled in the pericellular microenvironment by HGFA inhibitor (HAI).( 13 , 14 ) HAI is a type 1 transmembrane protein with two Kunitz‐type serine proteinase domains in its extracellular portion. Two types of HAI have been identified so far, HAI type 1 (HAI‐1) and type 2 (HAI‐2), both of which show cell surface expression on epithelial cells. HAI‐1 appears to be the cognate inhibitor of HGFA and matriptase,( 19 , 20 ) and both HAI inhibit HGFA and hepsin. HAI‐2 is a more efficient inhibitor of hepsin,( 11 ) and displays a broader inhibitory spectrum than HAI‐1.( 21 , 22 ) Previously we reported that HAI‐2 mRNA levels are significantly decreased in tumors such as glioblastoma( 23 ) and hepatocellular carcinoma,( 24 ) possibly due to hypermethylation of the promoter region.( 24 ) Although HAI‐1 and HAI‐2 show similar molecular structures, with two extracellular Kunitz‐type serine proteinase inhibitor domains, HAI‐1 and HAI‐2 gene knock‐out studies have indicated that their functions are quite distinct in vivo such that each HAI appears to play an important, non‐redundant biological role.( 25 , 26 )
Renal cell carcinoma (RCC) is the most common malignant renal tumor, with the majority of cases (∼75%) classified as being clear cell type (conventional RCC), and the next most common classification being papillary RCC.( 27 ) Germline activating mutations in the c‐Met gene and inactivating mutations in the VHL tumor suppressor gene lead to hereditary type 1 papillary RCC and von Hippel‐Lindau disease, respectively.( 28 , 29 ) Whereas the VHL tumor suppressor gene is inactivated by somatic mutation or promoter methylation in most sporadic conventional RCC cases,( 29 , 30 ) somatic c‐Met‐activating mutations are not a feature of sporadic conventional RCC.( 28 ) However, increased expression of c‐Met and HGF, and enhanced activation of proHGF, have been reported in conventional RCC,( 17 , 31 ) which suggests that HGF‐dependent activation of c‐Met may have a role in conventional RCC progression. Moreover, synergy between the effects of VHL inactivation and increased c‐Met signaling has been reported.( 32 ) Therefore, the cell surface proHGF‐activation machinery might be important in conventional RCC. However, little is known regarding the role and significance of matriptase, hepsin, and their inhibitors, HAI‐1 and HAI‐2, in RCC. We have reported that HAI are downregulated in RCC,( 18 ) and it has recently been shown that this downregulation is caused by hypermethylation of the HAI‐2 promoter, and that HAI‐2 exhibits tumor suppressor activity in RCC cells.( 33 ) The purpose of the present study was to determine the expression and prognostic significance of matriptase, hepsin, HAI, HGF and c‐Met in conventional RCC.
Materials and Methods
Clinical samples. The experimental protocol was approved by the Human Ethics Review Committees of Miyazaki University and Koga General Hospital. Kidney samples were obtained from 66 conventional RCC patients (mean age: 62 years) that received radical nephrectomy surgery at Miyazaki University and Koga General hospitals between January 1999 and November 2005. Both tumor tissue (T) and background normal tissue (N) situated well away from tumor‐affected tissue in the parenchyma of the same kidney were collected from all patients. Cases with pathological findings, such as interstitial tubulonephritis or major glomerular abnormalities with or without impaired renal function by serum chemistry, were excluded. Clinical data including age, sex, date of diagnosis, preoperative modalities, most recent follow‐up, and detection of new metastatic lesion were also collected. Tumors were assessed according to the WHO classification (2002)( 34 ) and tumor stage was based on the TNM Classification of Malignant Tumors (6th Edition, 2002).( 35 ) In all cases, kidney pathology was assessed independently by two pathologists. The presence of microscopic vascular invasion was verified using an elastica van Gieson stain. Six cases (five of six had died by the end of the study) had detectable tumor metastasis at the time of surgery. Nine cases (five of nine had died by the end of the study) had metastatic lesions detected after surgery. Eleven out of 66 had died by the end of the study, with 10 dying of RCC and one of mycosis fungoides.
Reverse transcription–polymerase chain reaction. Total cellular RNA was extracted using Trizol reagent (Invitrogen, Carlsbad, CA, USA) according to the manufacturer's instructions. Extracted RNA was reverse‐transcribed with Superscript II reverse transcriptase (Invitrogen), and the resultant cDNA was used for conventional reverse transcription–polymerase chain reaction (RT‐PCR) and quantitative real‐time RT‐PCR. Sequences of the primers used are shown in Table 1. Conventional PCR was carried out using the hot start Taq enzyme (Qiagen, Valencia, CA, USA) with a thermal cycle profile of 30 s at 95°C, 1 min at 60°C and 2 min at 72°C, using an i‐cycler thermal cycler (Bio‐Rad, Hercules, CA, USA). PCR products were purified and concentrations measured using a NanoDrop ND‐1000 Spectrophotometer (NanoDrop Technologies, Wilmington, DE, USA) for use as standards for the corresponding quantitative real‐time PCR. For quantitative real‐time PCR, primers as used in conventional PCR and fluorogenic probes labeled with the FAM (6‐carboxyfluorescein) fluorescent reporter at the 5′ end and the TAMRA (6‐carboxy‐tetramethyl‐rhodamine) quencher at the 3′ end were used (Table 1). Quantitative real‐time PCR was carried out according to the manufacturer's instruction with a thermal cycle profile of 10 s at 95°C and 20 s at 60°C using a LightCycler (Roche Diagnostics, Mannheim, Germany). The amount of mRNA in each sample was calculated as the number of copies per 103 copies of β‐actin (Roche Diagnostics). The mRNA level of each target gene in tumor or corresponding normal tissues from each RCC specimen was determined from three independent experiments, and the mean value was used for calculation of a tumor versus normal ratio (T/N).
Table 1.
Primers and probes for real‐time quantitative reverse transcription–polymerase chain reaction
| Target gene | Primer/hybridization probe sequence |
|---|---|
| Matriptase | Forward 5′‐CTTTGAGGCCACCTTCTT‐3′ |
| Reverse 5′‐GGTAGTGGCCTGGGTAGTA‐3′ | |
| TaqMan FAM‐CAGCTGTGGAGGCCGCTTACGTA‐TAMRA | |
| Hepsin | Forward 5′‐GGGACCCTGCTACTTCTGA‐3′ |
| Reverse 5′‐ACGTCCCTTCCGTCTTGTC‐3′ | |
| TaqMan FAM‐AAGACCATGAGCCGAGCGTCCG‐TAMRA | |
| HAI‐1 | Forward 5′‐TCCATTTCCCCAGTGACA‐3′ |
| Reverse 5′‐TGCCATAACAACCACCATAG‐3′ | |
| TaqMan FAM‐ACTGCGTGGACCTGCCAGACACA‐TAMRA | |
| HAI‐2 | Forward 5′‐AAGAAATGTGCCACTGTCA‐3′ |
| Reverse 5′‐GTTGAACATATCGCTGGAGT‐3′ | |
| TaqMan FAM‐TCCTGCCTTCTGGGAGCACTTGG‐TAMRA | |
| HGF | Forward 5′‐GAAATGCAAACAGGTTCTCA‐3′ |
| Reverse 5′‐CAAAATCATCCAGGACAGC‐3′ | |
| TaqMan FAM‐CTGGTATATGGCCCTGAAGGATCAGATC‐ TAMRA | |
| c‐Met | Forward 5′‐TGTCCCGAGAATGGTCATAA‐3′ |
| Reverse 5′‐AGGGAAGGAGTGGTACAACA‐3′ | |
| TaqMan FAM‐AACTTTACAGTGGCATGTCAACATCGCT‐ TAMRA |
Immunohistochemistry. Ethanol‐fixed frozen sections were treated with 3% H2O2 in methanol for 30 min and then washed twice in phosphate‐buffered saline (PBS). The sections were blocked in 3% bovine serum albumin (BSA) and 10% normal goat serum in PBS for 1 h at room temperature, and then incubated with rabbit polyclonal antibody against human hepsin (0.5 µg/mL) in PBS with 1% BSA for 16 h at 4°C. After washing in PBS, sections were incubated with ENvision labeled polymer reagents (DAKO, Carpinteria, CA, USA) for 30 min at 37°C. Reactions were revealed using with nickel, cobalt‐3,3′‐diaminobenzidine (Pierce, Rockford, IL, USA) and counterstained with Mayer's hematoxylin.
Cell culture and proHGF processing assay. Two human RCC cell lines, MRT‐1 and Caki‐1, were cultured in Dulbecco's modified Eagle's medium supplemented with 10% fetal bovine serum. MRT‐1 was established in our laboratory,( 36 ) and Caki‐1 was obtained from RIKEN cell bank (Tsukuba, Japan). The proHGF processing activity of cultured cells was analyzed in accordance with a method described previously.( 37 ) After incubating the cells with proHGF, the cellular extracts were prepared and analyzed by immunoblot analysis using anti‐HGF rabbit polyclonal antibody (IBL, Gunma, Japan), anti‐c‐Met (C12; Santa Cruz Biotechnology, Santa Cruz, CA, USA) or antiphosphorylated c‐Met (Biosource, Camarillo, CA, USA), as described previously.( 37 )
Statistical analysis. Statistical parameters were assessed using the StatView 5.0 program (SAS Institute, Cary, NC). Comparison between groups was determined by Mann–Whitney's U‐test or by one‐way analysis of variance (Fisher's protected least‐significance difference test). For analysis of follow‐up data, life table curves were calculated by the Kaplan–Meier method and survival distributions were compared by log‐rank statistics. The primary end point was cancer‐related death, as measured from the date of surgery to date of death. Multivariate analysis was carried out using Cox proportional hazards analysis. For evaluation of continuous variables in survival analysis, patients were divided into two groups. The two‐tailed Pearson's χ2 and Fischer's exact tests were also used for correlation analysis. The threshold for statistical significance was P < 0.05.
Results
Expression profiles of matriptase, hepsin, HAI, HGF and c‐Met in RCC. Samples from 66 surgically resected primary clear cell RCC tissues from patients with no prior history of treatment for the cancer were analyzed. Clinical and pathological characteristics of the samples are shown in Table 2. Tissue samples were obtained from tumor and corresponding non‐tumor regions from each case, from which the mRNA levels of matriptase, hepsin, HAI‐1 (endogenous inhibitor of matriptase, hepsin and HGF activator) and HAI‐2 (inhibitor of hepsin and HGF activator) were measured. In addition, as these molecules may be involved in the activation of proHGF, the mRNA levels of HGF and c‐Met were also measured.
Table 2.
Characteristics of renal cell carcinoma cases in this study
| Characteristic | n |
|---|---|
| No. patients | 66 |
| Age at diagnosis (years) | Median: 62 (range: 33–88) |
| Sex | |
| Male | 44 (67%) |
| Female | 22 (33%) |
| Overall survival follow‐up (months) | Median: 35 (range: 2–88) |
| pT stage | |
| pT1 | 38 |
| pT1a | 26 |
| pT1b | 12 |
| pT2 | 6 |
| pT3 | 20 |
| pT3a | 11 |
| pT3b | 9 |
| pT4 | 2 |
| Lymph node metastasis at the operation | |
| – | 65 |
| + | 1 (N2) |
| Distant metastasis at the operation | |
| –(M0) | 60 |
| +(M1) | 6 |
The mean mRNA copy numbers of each gene (normalized according to β‐actin mRNA level in the same sample) in RCC or normal renal tissues are shown in Fig. 1a. Clear expression of all molecules was observed in normal kidney tissues. There was a tendency for c‐Met mRNA levels to be increased in cancer tissues, and for HAI‐1 and HAI‐2 mRNA levels to be decreased. The T/N ratios for matriptase, hepsin, HAI‐1, HAI‐2, HGF and c‐Met mRNA were calculated for each RCC case and the summary of T/N values is shown in Fig. 1b. Whereas median T/N values were decreased for hepsin, HAI‐1 and HAI‐2, the median T/N value for c‐Met was markedly increased, with 26% (17/66) of cases showing overexpression (T/N ≥ 3). It should be noted that, although median hepsin expression was decreased in cancer tissues relative to corresponding normal tissues, 17% (11/66) of cases showed overexpression (T/N ≥ 3) of hepsin mRNA. For matriptase, 26% (17/66) of cases showed overexpression (T/N ≥ 3).
Figure 1.
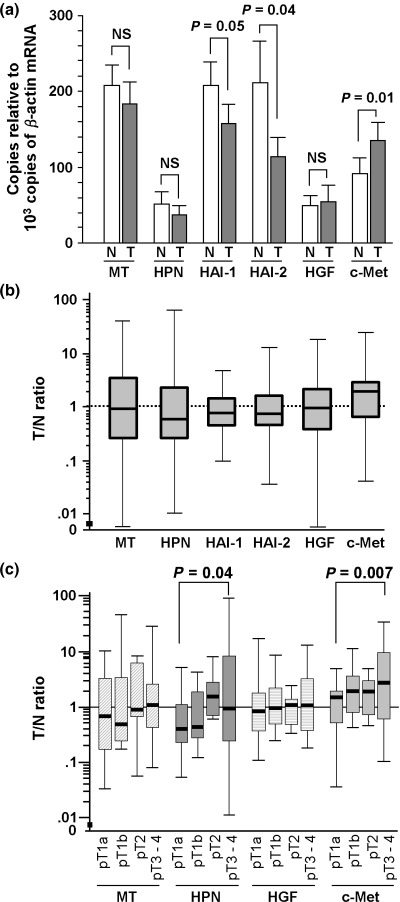
Expression of matriptase (MT), hepsin (HPN), hepatocyte growth factor (HGF), HGF activator inhibitor (HAI)‐1 and HAI‐2, and c‐Met in conventional renal cell carcinoma (RCC). (a) The mRNA level of each molecule in 66 cases of normal and RCC tissues. Each mRNA level is expressed as copy number per 103 copies of β‐actin mRNA (mean of 66 cases). Statistical significance was evaluated by Mann–Whitney U‐test. Vertical lines show standard error. (b) Semilogarithmic plot of tumor (T)/normal (N) values of the mRNA level of each molecule. Boxes, 25–75% quartiles; horizontal lines, group medians; range, peak and minimal. (c) Correlation of MT, HPN, HGF and c‐Met mRNA levels (T/N ratios) to tumor stage: pT1a (26 cases), pT1b (12 cases), pT2 (six cases) and pT3‐4 (22 cases). Comparison between groups was determined by one‐way analysis of variance.
Correlation with pT stage. To analyze the expression pattern of each HGF‐related molecule in more detail, the 66 cases were classified according to tumor stage (pT stage): pT1a (n = 26), pT1b (n = 12), pT2 (n = 6) or pT3‐4 (n = 22). Then, T/N ratios were compared between groups. We observed a positive correlation between tumor stage and c‐Met expression. Although HGF mRNA level was not related to pT stage, c‐Met mRNA expression was significantly increased in advanced RCC stages (pT3‐4) relative to pT1a (P < 0.01) (Fig. 2). Matriptase showed a modest increase in T/N ratios in advanced stages, but this trend was not statistically significant (Fig. 1c). Hepsin mRNA expression was also increased in advance stages (pT3‐4) relative to pT1a, and the difference was statistically significant (P = 0.04) (Fig. 1c). In contrast, the mRNA levels of HAI‐1 and HAI‐2 were not related to the pT stage (data not shown).
Figure 2.
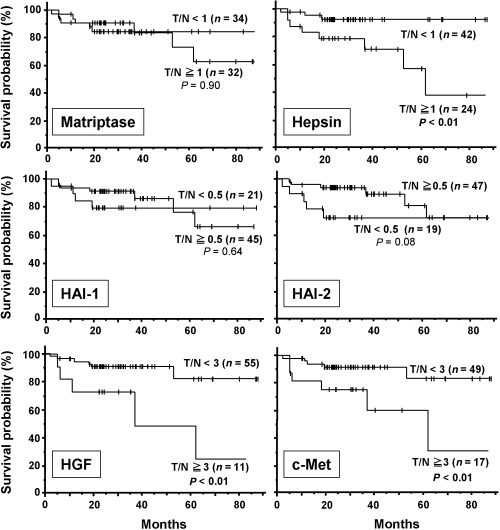
Survival curves in relation to mRNA expression of matriptase, hepsin, hepatocyte growth factor (HGF), HGF activator inhibitor (HAI)‐1 and HAI‐2, and c‐Met showing Kaplan–Meier survival analyses in 65 patients with renal cell carcinoma after tumor nephrectomy. Survival curves in relation to tumor stage and microscopic vascular invasion are also shown. In each analysis, the patients were subdivided into two groups as indicated, and survival distributions were compared by log‐rank statistics.
Correlation with metastasis and survival. To analyze the correlation with metastasis and also to allow evaluation of continuous variables in survival analysis, the T/N‐values of each molecule were categorized into two groups: high expression versus low expression (T/N ≥ 1 versus T/N < 1 or T/N ≥ 3 versus T/N < 3) for matriptase, hepsin, HGF and c‐Met, or a significantly low expression group (T/N < 0.5) versus preserved/enhanced expression group (T/N ≥ 0.5) for HAI‐1 and HAI‐2. Complete follow‐up data were available for all patients (66 cases), and one patient died of a disease unrelated to RCC. The median follow‐up duration was 35 months. Sixteen out of 66 cases showed metastatic lesions in the lungs (14 cases), bone (six cases) or other organs. Six cases had metastatic lesions that were identified at preoperative examination, and 10 cases exhibited metastatic progression after surgery. With respect to pT stage, two cases were pT1b (17%, 2/12), one case was pT2 (17%, 1/6), four cases were pT3a (36%, 4/11) and nine cases were pT3b or greater (82%, 9/11). None of the pT1a tumors showed metastatic disease progression. We observed a trend of higher hepsin, c‐Met or HGF mRNA levels in RCC tissues from patients with distant metastases compared with those without metastases (Table 3). The results for hepsin (T/N ≥ 3), HGF (T/N ≥ 3) and c‐Met (T/N ≥ 3) reached statistical significance (Fisher's exact and χ2 tests).
Table 3.
Correlation of metastatic progression with tumor (T)/normal (N) value of each factor
| Variable | No. patients | Metastasis absent | Metastasis present § | P‐value (odds ratio [95% CI]) |
|---|---|---|---|---|
| Matriptase | ||||
| T/N ≥ 1 | 32 | 24 (75.0) | 8 (25.0) | 0.889 |
| T/N < 1 | 34 | 26 (76.5) | 8 (23.5) | |
| T/N ≥ 3 | 17 | 14 (82.4) | 3 (17.6) | 0.533* |
| T/N < 3 | 49 | 36 (73.5) | 13 (26.5) | |
| Hepsin | ||||
| T/N ≥ 1 | 24 | 16 (66.7) | 8 (33.3) | 0.193 |
| T/N < 1 | 42 | 34 (81.0) | 8 (19.0) | |
| T/N ≥ 3 | 11 | 5 (45.5) | 6 (54.5) | 0.019* |
| T/N < 3 | 55 | 45 (81.8) | 10 (18.2) | (3.00 [1.30–6.94]) |
| HAI‐1 | ||||
| T/N < 0.5 | 21 | 16 (76.2) | 5 (23.8) | 0.955 |
| T/N ≥ 0.5 | 45 | 34 (75.6) | 11 (24.4) | |
| HAI‐2 | ||||
| T/N < 0.5 | 19 | 12 (63.2) | 7 (36.8) | 0.203 † |
| T/N ≥ 0.5 | 47 | 38 (80.9) | 9 (19.1) | |
| HGF | ||||
| T/N ≥ 3 | 11 | 5 (45.5) | 6 (54.5) | 0.019 † |
| T/N < 3 | 55 | 45 (81.8) | 10 (18.2) | (3.00 [1.30–6.94]) |
| c‐Met | ||||
| T/N ≥ 3 | 17 | 9 (52.9) | 8 (47.1) | 0.020 † |
| T/N < 3 | 49 | 41 (83.7) | 8 (16.3) | (2.88 [1.28–6.51]) |
Significance was determined by *χ2‐test or †Fisher's exact test. §The existence of metastasis at operation and in the follow‐up period (total 16 cases). CI, confidence interval.
Next, we examined whether the expression of these molecules was associated with patient survival. With Kaplan–Meier survival analysis, there was a statistically significant association between high hepsin mRNA expression (T/N ≥ 1) and reduced cancer‐related survival (P < 0.01 by log‐rank test) (Fig. 2). Low HAI‐2 expression (T/N < 0.5) was also associated with reduced cancer‐related survival, but the tendency was not statistically significant (P = 0.08) (Fig. 2). In addition, overexpression (T/N ≥ 3) of c‐Met or HGF was significantly associated with poor survival (P < 0.01) (Fig. 2). As expected, metastasis at the operation and advanced pT stage (≥pT3) were significant predictors of poor outcome, and the presence of microvascular invasion was also associated with reduced patient survival (data not shown). We also carried out univariate Cox proportional hazard analyses on all eligible patients for pT stage, patient age, nuclear grade, presence or absence of metastatic lesion at the operation, microscopic vascular invasion and expression levels of the molecules (Table 4). Of these, metastasis showed the strongest association with poor patient outcome. The pT stage, existence of microscopic vascular invasion, nuclear grade, high hepsin level and overexpression of HGF or c‐Met were also associated with poor outcome (Table 4). Low HAI‐2 was also associated with poor outcome, although the association was not statistically significant (P = 0.09) (Table 4).
Table 4.
Univariate analysis of cancer‐related survival (66 cases)
| Variable | Case number | P‐value* | Relative risk |
|---|---|---|---|
| Age ≥ 60 years | 36 | 0.446 | 0.63 |
| pT stage pT3‐4 | 22 | <0.01 | 20.70 |
| Metastasis at the operation positive | 6 | <0.001 | 35.84 |
| Nuclear grade | |||
| G2 with G3 component | 11 | <0.01 | 10.63 |
| G3 | 4 | 0.022 | 8.28 |
| Microscopic vascular invasion positive | 32 | 0.026 | 10.38 |
| Matriptase | |||
| T/N ≥ 1 versus T/N < 1 | 32 versus 34 | 0.901 | 1.08 |
| T/N ≥ 3 versus T/N < 3 | 17 versus 49 | 0.988 | 0.99 |
| Hepsin | |||
| T/N ≥ 1 versus T/N < 1 | 24 versus 42 | 0.018 | 4.96 |
| T/N ≥ 3 versus T/N < 3 | 11 versus 55 | <0.01 | 6.10 |
| HAI‐1 T/N < 0.5 versus T/N = 0.5 | 21 versus 45 | 0.645 | 1.34 |
| HAI‐2 T/N ≤ 0.5 versus T/N > 0.5 | 19 versus 47 | 0.090 | 2.85 |
| HGF | |||
| T/N = 1 versus T/N < 1 | 32 versus 34 | 0.116 | 2.91 |
| T/N = 3 versus T/N < 3 | 11 versus 55 | 0.013 | 4.55 |
| c‐Met | |||
| T/N = 1 versus T/N < 1 | 45 versus 21 | 0.324 | 2.16 |
| T/N = 3 versus T/N < 3 | 17 versus 49 | 0.018 | 4.23 |
Cox proportional hazard analysis. HAI, HGF activator inhibitor; HGF, hepatocyte growth factor; N, normal tissue; T, tumor tissue.
To directly compare all factors in terms of impact on patient outcome, we carried out a multivariate analysis on all eligible patients. This analysis revealed that metastasis (P = 0.025), pT stage (P = 0.029) and high hepsin level (P = 0.045) were independent factors associated with poor outcome in patients with RCC (Table 5).
Table 5.
Multivariate analysis for cancer‐related survival of renal cell carcinoma patients (n = 66)
| Variable | P‐value | Relative risk (95% CI) |
|---|---|---|
| Age continuous form | 0.443 | 0.97 (0.9–1.0) |
| pT stage pT3–4 | 0.029 | 19.34 (1.4–274.3) |
| Metastasis at operation positive | 0.025 | 35.17 (1.6–794.5) |
| Microscopic vascular invasion positive | 0.790 | 1.45 (0.1–21.7) |
| Nuclear grade | ||
| G2 with G3 component | 0.642 | 1.96 (0.1–33.2) |
| G3 | 0.648 | 0.45 (0.01–14.0) |
| Matriptase T/N ≥ 1.0 | 0.117 | 0.15 (0.01–1.6) |
| Hepsin T/N ≥ 1.0 | 0.045 | 19.26 (1.1–346.7) |
| HAI‐1 T/N < 0.5 | 0.263 | 9.12 (0.2–436.3) |
| HAI‐2 T/N < 0.5 | 0.264 | 6.20 (0.3–152.0) |
| HGF T/N ≥ 3.0 | 0.974 | 0.96 (0.1–10.0) |
| c‐Met T/N ≥ 3.0 | 0.505 | 3.16 (0.1–92.3) |
CI, confidence interval; HAI, HGF activator inhibitor; HGF, hepatocyte growth factor; N, normal tissue; T, tumor tissue.
Correlation between factors. We then tested for a statistical association between HAI and hepsin, and we found an association between low HAI‐2 mRNA level (T/N ≤ 0.5) and high hepsin mRNA level (T/N > 1) (P < 0.01 by χ2‐test) (Table 6). Thus, their expression patterns would probably result in a synergistic effect and significantly dysregulated hepsin activity. High hepsin expression was also associated with low HAI‐1 level (T/N ≤ 0.5) (P = 0.011) and low HAI‐1 level with low HAI‐2 level (T/N ≤ 0.5 for each HAI; P < 0.001). No associations were observed between matriptase and the HAI. Overexpression of HGF (T/N = 3) was associated with overexpression of c‐Met (T/N ≥ 3) (P = 0.026; Fisher's exact test) (Table 6). Interestingly, a significant correlation was observed between overexpression of hepsin (T/N ≥ 3.0) and HGF (T/N ≥ 3) or c‐Met (T/N ≥ 3) (P = 0.014 or 0.026, respectively; Fisher's exact test) (Table 6).
Table 6.
Correlation analysis of factors (MT, HPN, HAI‐1, HAI‐2, HGF and c‐Met)
| Parameters | MT T/N ≥ 1 | HPN T/N ≥ 1 (T/N ≥ 3) | HAI‐1 T/N < 0.5 | HAI‐2 T/N < 0.5 | HGF (T/N ≥ 3) |
|---|---|---|---|---|---|
| MT T/N ≥ 1 | |||||
| HPN T/N ≥ 1 (T/N ≥ 3) | 0.226 (0.078) | ||||
| HAI‐1 T/N < 0.5 | 0.923 | 0.011 (0.153 † ) | |||
| HAI‐2 T/N < 0.5 | 0.908 | <0.01 (0.156 † ) | <0.001 | ||
| HGF T/N ≥ 3 | 0.378 | 0.511 † (0.014 † ) | 0.733 † | 0.716 † | |
| c‐Met T/N ≥ 3 | 0.670 | 0.287 (0.026 † ) | 0.805 | >0.999 † | 0.026 † |
The P‐value of each correlation was calculated by χ2‐test or †Fisher's exact test. Values in parentheses are correlation data (P‐value) with overexpression of hepsin (ΗΠΝ) (Τ/Ν ≥ 3). HAI, HGF activator inhibitor; HGF, hepatocyte growth factor; MT, matriptase; N, normal tissue; T, tumor tissue.
Expression of hepsin in RCC cells and pericellular activation of proHGF. To confirm the expression and localization of hepsin protein in RCC cells, we carried out immunohistochemical analysis of RCC tissues and also examined hepsin expression in cultured RCC cells in vitro. In cases of high T/N ratio for hepsin mRNA, strong immunoreactivity for hepsin protein was observed in RCC cells (Fig. 3a–c). Hepsin immunoreactivity seemed to be more evident in tumor cells showing less‐differentiated features.
Figure 3.
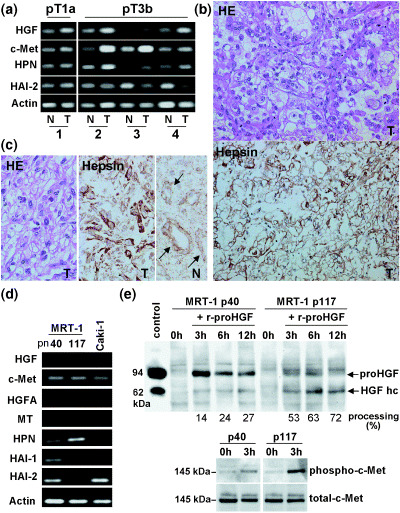
(a) Representative results of conventional reverse transcription–polymerase chain reaction (RT‐PCR) for hepatocyte growth factor (HGF), c‐Met, hepsin (HPN) and HGF activator inhibitor (HAI)‐1, using the same primer sets as real‐time RT‐PCR in the present study. Four cases of renal cell carcinoma (RCC), one pT1a tumor (case 1) and three pT3b tumors (case 2–4) are shown. For internal control, RT‐PCR for β‐actin mRNA is also shown. (b) Immunostains for HPN protein in RCC tumor tissue (T) corresponding to case 4 in (a). Cellular surface localization of the immunoreactivity is shown. HE, hematoxylin–eosin stain. (c) Immunostain for HPN protein of case 2 in (a). In this case, sarcomatous change was observed in part of the tumor (T), showing strong hepsin immunoreactivity. In the corresponding normal kidney (N), hepsin immunoreactivity was observed in the tubular epithelium (arrows). (d) RT‐PCR for HGF, c‐Met, HGF activator (HGFA), matriptase (MT), HPN, HAI‐1 and HAI‐2 of the cultured human RCC cell lines MRT‐1 (passage number [pn] 40 and 117) and Caki‐1. Note that MRT‐1 pn 40 expressed high HAI‐2 and low hepsin, whereas MRT‐1 pn 117 expressed high hepsin and undetectable HAI‐2. (e) In vitro proHGF processing by cultured MRT‐1 cells of different passage numbers. ProHGF (8 ng) was added and incubated for the times indicated. Processing of proHGF was assessed by immunoblot analyses. Partially processed proHGF was used as a molecular control of HGF. Samples obtained at 0 h (negative control) and 3 h after treatment were also subjected to the immunoblot analyses for total c‐Met and phosphorylated c‐Met. Significantly enhanced proHGF processing and c‐Met phosphorylation were observed in MRT‐1 cells of high passage numbers (pn 117).
Analysis of cultured MRT‐1 human RCC cells also confirmed the expression of hepsin in RCC cells. Of particular interest was the observation that hepsin showed a reciprocal expression pattern to HAI even in cultured RCC cells. As shown in Fig. 3d, MRT‐1 cells at low passage number (40 passages) showed abundant expression of HAI‐2 with a low level of hepsin. After serial passages (117 passages), the cells showed increased expression of hepsin with significantly decreased levels of both HAI‐1 and HAI‐2 mRNA. In contrast, a low but distinct level of c‐Met mRNA was observed consistently. HGF, HGFA and matriptase mRNA were hardly detectable in this cell line. Another human RCC cell line, Caki‐1, was also analyzed. In this cell line, HGF, HGFA, matriptase, hepsin and HAI‐1 were not detectable, whereas c‐Met and HAI‐2 were detected (Fig. 3d). Finally, by using MRT‐1 cells, pericellular activation of proHGF was examined. Notably, MRT‐1 cells with high hepsin and low HAI‐2 (i.e. MRT‐1 cells of high passage number) showed enhanced processing of proHGF compared with MRT‐1 cells with low hepsin and high HAI‐2, accompanied by significantly enhanced phosphorylation of c‐Met (Fig. 3e).
Discussion
In the present study, we analyzed the mRNA levels and clinical relevance of matriptase, hepsin, HAI‐1 and HAI‐2 in conventional RCC. All of these proteinases and inhibitors are membrane‐bound proteins acting on the surface of tumor cells and might have important roles in the pericellular proteolysis and processing of bioactive molecules such as HGF, protease‐activated receptors and coagulation factors. Of the molecules analyzed in the present study, we found that high hepsin and low HAI‐2 mRNA levels were risk factors for conventional RCC. In addition, high HGF and c‐Met levels were also predictors of poor patient survival.
Hepsin is a type 2 transmembrane protein expressed predominantly in the liver,( 33 ) and is thought to be involved in the blood coagulation pathway( 10 ) and in cellular growth.( 38 ) The reported roles of hepsin in tumor cells appear to be complicated, and may depend on experimental design, cellular microenvironment and tumor type.( 4 ) A number of studies have indicated that hepsin is overexpressed in prostatic and ovarian cancers.( 5 , 6 , 7 ) The functional significance of hepsin overexpression in prostate cancer was recently elucidated in an in vivo mouse model, and clearly demonstrated that hepsin promotes cancer progression and metastasis.( 3 ) In the present study, hepsin was found to be expressed in normal renal tissue but downregulated in RCC, particularly in the early stages. However, in advanced‐stage RCC, hepsin was abnormally upregulated in some cases with poor prognoses. Expression of hepsin in RCC has been reported previously in a study that suggested a possible role for hepsin in pericellular pro‐coagulant activity in RCC.( 39 ) Although little is known regarding the clinical relevance of hepsin activity in RCC, it has been suggested that high hepsin mRNA expression levels are associated with better patient prognosis,( 40 ) the opposite finding to that observed in the present study. This discrepancy may be explained by the different numbers of RCC patients analyzed (27 cases vs 66 cases in the present study), or by the different experimental procedures used to measure and calculate mRNA levels and T/N ratios.
The functions of hepsin in tumor cells remain poorly understood. The physiological functions of human hepsin have not been clarified, partly due to the lack of knowledge around its specific protein substrate in vivo. In this regard, recent observations that hepsin potently activates proHGF,( 11 , 41 ) suggest the possibility of a specialized role for hepsin in tumors, such that the cell surface‐located enzyme may be involved in the activation of proHGF in the pericellular microenvironment of tumor cells, including RCC cells. Hepsin has also been implicated in activation of the coagulation cascade in the pericellular RCC microenvironment,( 39 ) generating thrombin, which then activates cell surface protease‐activated receptor 1 and circulating proHGFA, another important activator of proHGF.( 13 , 18 ) Matriptase is also a cellular activator of proHGF, and is expressed in RCC.( 42 ) Our study found that whereas it was significantly upregulated in some RCC cases, in contrast to hepsin, an association between matriptase level and clinicopathological parameters was not identified.
HAI‐1 and HAI‐2 are endogenous inhibitors of matriptase and hepsin. As both HAI‐1 and HAI‐2 are cell surface type 1 transmembrane proteins, it is possible that HAI critically regulate the pericellular activities of these proteinases in tumor tissues.( 13 , 14 ) Hepsin is sensitive to both HAI‐1 and HAI‐2, with HAI‐2 showing more efficient inhibitory activity than HAI‐1.( 11 ) However, HAI‐1 is thought to be a cognate inhibitor of matriptase.( 20 ) The observation that both high expression of hepsin and downregulation of HAI‐2 correlated with poor patient prognosis suggested that HAI‐2 may be a cognate inhibitor of hepsin in RCC and that disturbance of the balance between hepsin and HAI‐2 may result in the malignant progression of RCC. To date, several studies on HAI‐2 expression in tumor tissues have been published and have shown preserved, downregulated and upregulated expression, depending on the tumor type. For example, HAI‐2 expression was maintained in colorectal cancers,( 43 ) upregulated in pancreatic cancers,( 44 ) but markedly downregulated in glioblastoma( 23 ) and hepatocellular carcinomas,( 24 ) with this downregulation due, at least in part, to hypermethylation of the HAI‐2 promoter region.( 24 ) We have previously reported that HAI‐2 was downregulated in RCC.( 17 ) Recently, Morris and colleagues found hypermethylation of the HAI‐2 promoter in RCC, and suggested that HAI‐2 may exert tumor suppressor activity in RCC cells.( 45 )
Our study did not address whether the prognostic impact of hepsin was dependent on the activation of the HGF/c‐Met axis. Also, little is known regarding the mechanism underlying abnormal expression of hepsin in RCC cells. It is possible that the upregulated hepsin expression in RCC cells may simply be an epiphenomenon in the process of dedifferentiation. However, as HAI‐1 and HAI‐2 are also downregulated in RCC with high hepsin expression, the hepsin activity would be significantly increased in the pericellular RCC microenvironment. Together with the findings that c‐Met expression was upregulated along with RCC progression and the overexpression of HGF and c‐Met was significantly associated with the overexpression of hepsin (T/N ≥ 3.0), it is reasonable to postulate that the deregulated pericellular hepsin activity might modify the pericellular and intracellular milieu in favor of invasive growth of the RCC cells via activation of the HGF/c‐Met axis. In fact, our in vitro study using a cultured human RCC cell line suggested enhanced pericellular processing of proHGF in cells with high hepsin and low HAI‐2 expression.
In summary, we have shown that matriptase and hepsin, cellular activators of proHGF, are expressed in RCC, and that their inhibitors (HAI‐1 and HAI‐2) are downregulated in RCC tissues compared with corresponding normal renal tissues. Of the molecules tested, up‐regulation of hepsin and downregulation of HAI‐2 were associated with reduced cancer‐related survival. Although the precise biological significance of dysregulated pericellular hepsin activity in RCC due to hepsin upregulation or HAI‐2 depletion remains to be determined, our results indicate that hepsin and HAI‐2 may have prognostic value in RCC. The present study also supports the hypothesis that administration of HAI‐2 may provide a therapeutic approach for patients with RCC.( 45 )
Acknowledgments
This work was supported in part by Grant‐in‐Aid for Scientific Research (B) no. 17390116, and 21st Century COE program (Life Science) from the Ministry of Education, Science, Sports and Culture, Japan, a Grant‐in‐aid for Cancer Research from the Ministry of Health, Labor and Welfare (15‐13). We thank Mr Takashi Miyamoto for his help in tissue culture.
References
- 1. Netzel‐Arnett S, Hooper JD, Szabo R et al. Membrane anchored serine proteases: a rapidly expanding group of cell surface proteolytic enzymes with potential roles in cancer. Cancer Metast Rev 2003; 22: 223–36. [DOI] [PubMed] [Google Scholar]
- 2. List K, Szabo R, Molinolo A, Sriuranpong V et al. Deregulated matriptase causes ras‐independent multistage carcinogenesis and promotes ras‐mediated malignant transformation. Genes Dev 2005; 19: 1934–50. [DOI] [PMC free article] [PubMed] [Google Scholar]
- 3. Klezovitch O, Chevillet J, Mirosevich J, Roberts RL, Matusik RJ, Vasioukhin V. Hepsin promotes prostate cancer progression and metastasis. Cancer Cell 2004; 6: 185–95. [DOI] [PubMed] [Google Scholar]
- 4. Vasioukhin V. Hepsin paradox reveals unexpected complexity of metastatic process. Cell Cycle 2004; 3: 1394–7. [DOI] [PubMed] [Google Scholar]
- 5. Stephan C, Yousef GM, Scorilas A et al. Hepsin is highly over expressed in and a new candidate for a prognostic indicator in prostate cancer. J Urol 2004; 171: 187–91. [DOI] [PubMed] [Google Scholar]
- 6. Xuan JA, Schneider D, Toy P et al. Antibodies neutralizing hepsin protease activity do not impact cell growth but inhibit invasion of prostate and ovarian tumor cells in culture. Cancer Res 2006; 66: 3611–19. [DOI] [PubMed] [Google Scholar]
- 7. Tanimoto H, Yan Y, Clarke J et al. Hepsin, a cell surface serine protease identified in hepatoma cells, is overexpressed in ovarian cancer. Cancer Res 1997; 57: 2884–7. [PubMed] [Google Scholar]
- 8. Lee SL, Dickson RB, Lin CY. Activation of hepatocyte growth factor and urokinase/plasminogen activator by matriptase, an epithelial membrane serine protease. J Biol Chem 2000; 275: 36 720–5. [DOI] [PubMed] [Google Scholar]
- 9. Takeuchi T, Harris JL, Huang W, Yan KW, Coughlin SR, Craik CS. Cellular localization of membrane‐type serine protease 1 and identification of protease‐activated receptor‐2 and single‐chain urokinase‐type plasminogen activator as substrates. J Biol Chem 2000; 275: 26 333–42. [DOI] [PubMed] [Google Scholar]
- 10. Kazama Y, Hamamoto T, Foster DC, Kisiel W. Hepsin, a putative membrane‐associated serine protease, activates human factor VII and initiates a pathway of blood coagulation on the cell surface leading to thrombin formation. J Biol Chem 1995; 270: 66–72. [DOI] [PubMed] [Google Scholar]
- 11. Kirchhofer D, Peek M, Lipari MT, Billeci K, Fan B, Moran P. Hepsin activates pro‐hepatocyte growth factor and is inhibited by hepatocyte growth factor activator inhibitor‐1B (HAI‐1B) and HAI‐2. FEBS Lett 2005; 579: 1945–50. [DOI] [PubMed] [Google Scholar]
- 12. Jiang WG, Hiscox S, Matsumoto K, Nakamura T. Hepatocyte growth factor/scatter factor, its molecular, cellular and clinical implications in cancer. Crit Rev Oncol Hematol 1999; 29: 209–48. [DOI] [PubMed] [Google Scholar]
- 13. Kataoka H, Miyata S, Uchinokura S, Itoh H. Roles of hepatocyte growth factor (HGF) activator and HGF activator inhibitor in the pericellular activation of HGF/scatter factor. Cancer Metast Rev 2003; 22: 223–36. [DOI] [PubMed] [Google Scholar]
- 14. Kataoka Itoh H, Hamasuna R, Meng JY, Koono M. Pericellular activation of hepatocyte growth factor/scatter factor (HGF/GF) in colorectal carcinomas: roles of HGF activator (HGFA) and HGFA inhibitor type 1 (HAI‐1). Hum Cell 2001; 16: 83–93. [PubMed] [Google Scholar]
- 15. Kataoka H, Hamasuna R, Itoh H, Kitamura N, Koono M. Activation of hepatocyte growth factor/scatter in colorectal carcinoma. Cancer Res 2000; 60: 6148–59. [PubMed] [Google Scholar]
- 16. Tjin EP, Derksen PW, Kataoka H, Spaargaren M, Pals ST. Multiple myeloma cells catalyze hepatocyte growth factor (HGF) activation by secreting the serine protease HGF‐activator. Blood 2004; 104: 2172–5. [DOI] [PubMed] [Google Scholar]
- 17. Yamauchi M, Kataoka H, Itoh H, Seguchi T, Hasui Y, Osada Y. Hepatocyte growth factor activator inhibitor types 1 and 2 are expressed by tubular epithelium in kidney and down‐regulated in renal cell carcinoma. J Urol 2004; 171: 890–6. [DOI] [PubMed] [Google Scholar]
- 18. Shimomura T, Kondo J, Ochiai M et al. Activation of the zymogen of hepatocyte growth factor activator by thrombin. J Biol Chem 1993; 268: 22 927–32. [PubMed] [Google Scholar]
- 19. Kataoka H, Shimomura T, Kawaguchi T et al. Hepatocyte growth factor activator inhibitor type 1 is a specific cell surface binding protein of hepatocyte growth factor activator (HGFA) and regulates HGFA activity in the pericellular microenvironment. J Biol Chem 2000; 275: 40 453–62. [DOI] [PubMed] [Google Scholar]
- 20. Lin CY, Anders J, Johnson M, Dickson RB. Purification and characterization of a complex containing matriptase and a Kunitz‐type serine protease inhibitor from human milk. J Biol Chem 1999; 274: 18 237–42. [DOI] [PubMed] [Google Scholar]
- 21. Kawaguchi T, Qin L, Shimomura T et al. Purification and cloning of hepatocyte growth factor activator inhibitor type 2, a Kunitz‐type serine protease inhibitor. J Biol Chem 1997; 272: 27 558–64. [DOI] [PubMed] [Google Scholar]
- 22. Delaria KA, Muller DK, Marlor CW et al. Characterization of placental bikunin, a novel human serine protease inhibitor. J Biol Chem 1997; 272: 12 209–14. [DOI] [PubMed] [Google Scholar]
- 23. Hamasuna R, Kataoka H, Meng JY et al. Reduced expression of hepatocyte growth factor activator inhibitor type‐2/placental bikunin (HAI‐2/PB) in human glioblastomas: implication for anti‐invasive role of HAI‐2/PB in glioblastoma cells. Int J Cancer 2001; 93: 339–45. [DOI] [PubMed] [Google Scholar]
- 24. Fukai K, Yokosuka O, Chiba T et al. Hepatocyte growth factor activator inhibitor 2/placental bikunin HAI‐2/PB gene is frequently hypermethylated in human hepatocellular carcinoma. Cancer Res 2003; 63: 8674–9. [PubMed] [Google Scholar]
- 25. Tanaka H, Nagaike K, Takeda N et al. Hepatocyte growth factor activator inhibitor type 1 (HAI‐1) is required for branching morphogenesis in the chorioallantoic placenta. Mol Cell Biol 2005; 25: 5687–98. [DOI] [PMC free article] [PubMed] [Google Scholar]
- 26. Mitchell KJ, Pinson KI, Kelly OG et al. Functional analysis of secreted and transmembrane proteins critical to mouse development. Nat Genet 2001; 28: 241–9. [DOI] [PubMed] [Google Scholar]
- 27. Kovacs G, Akhtar M, Beckwith BJ et al. The Heidelberg classification of renal cell tumours. J Pathol 1997; 183: 131–3. [DOI] [PubMed] [Google Scholar]
- 28. Schmidt L, Duh FM, Chen F et al. Germline and somatic mutations in the tyrosine kinase domain of the MET proto‐oncogene in papillary renal carcinomas. Nat Genet 1997; 16: 68–73. [DOI] [PubMed] [Google Scholar]
- 29. Foster K, Prowse A, Van Den Berg A et al. Somatic mutations of the von Hippel‐Lindau disease tumour suppressor gene in non‐familial clear cell renal cell carcinoma. Hum Mol Genet 1994; 3: 2169–73. [DOI] [PubMed] [Google Scholar]
- 30. Herman JG, Latif F, Weng Y et al. Silencing of the VHL tumor‐suppressor gene by DNA methylation in renal carcinoma. Proc Natl Acad Sci USA 1994; 91: 9700–4. [DOI] [PMC free article] [PubMed] [Google Scholar]
- 31. Horie S, Aruga S, Kawamata H, Okui N, Kakizoe T, Kitamura T. Biological role of HGF/MET pathway in renal cell carcinoma. J Urol 1999; 161: 990–7. [PubMed] [Google Scholar]
- 32. Koochekpour S, Jeffers M, Wang PH et al. The von Hippel‐Lindau tumor suppressor gene inhibits hepatocyte growth factor/scatter factor‐induced invasion and branching morphogenesis in renal carcinoma cells. Mol Cell Biol 1999; 19: 5902–12. [DOI] [PMC free article] [PubMed] [Google Scholar]
- 33. Tsuji A, Torres‐Rosado A, Arai T et al. Hepsin, a cell membrane‐associated protease. J Biol Chem 1991; 266: 16 948–53. [PubMed] [Google Scholar]
- 34. Eble JN, Sauter G, Epstein JI et al. World Health Organization classification of tumours: pathology and genetics of tumours of the urinary system and male genital organs. Lyons: IARC Press; 2004. [Google Scholar]
- 35. American Joint Committee on Cancer . AJCC Cancer Staging Manual. 6th edn. Philadelphia: Lippincott‐Raven; 2002. [Google Scholar]
- 36. Muraoka K, Kataoka H, Nabeshima K et al. Establishment and characterization of a human renal cell carcinoma cell line MRT‐1, with special reference to the production of serine proteinase inhibitors. Hum Cell 1995; 8: 11–18. [PubMed] [Google Scholar]
- 37. Uchinokura S, Miyata S, Fukushima T et al. Role of hepatocyte growth factor activator (HGF activator) in invasive growth of human glioblastoma cells in vivo . Int J Cancer 2006; 118: 583–92. [DOI] [PubMed] [Google Scholar]
- 38. Torres‐Rosado A, O'Shea KS, Tsuji A, Chou SH, Kurachi K. Hepsin, a putative cell‐surface serine protease, is required for mammalian cell growth. Proc Natl Acad Sci USA 1993; 90: 7181–5. [DOI] [PMC free article] [PubMed] [Google Scholar]
- 39. Zacharski LR, Ornstein DL, Memoli VA, Rousseau SM, Kisiel W. Expression of the factor VII activating protease, hepsin, in situ in renal cell carcinoma. Thromb Haemost 1998; 79: 876–7. [PubMed] [Google Scholar]
- 40. Roemer A, Schwettmann L, Jung M et al. The membrane proteases adams and hepsin are differentially expressed in renal cell carcinoma. Are they potential tumor markers? J Urol 2004; 172: 2162–6. [DOI] [PubMed] [Google Scholar]
- 41. Herter S, Piper DE, Aaron W et al. Hepatocyte growth factor is a preferred in vitro substrate for human hepsin, a membrane‐anchored serine protease implicated in prostate and ovarian cancers. Biochem J 2005; 390: 125–36. [DOI] [PMC free article] [PubMed] [Google Scholar]
- 42. Jin JS, Chen A, Hsieh DS, Yao CW, Cheng MF, Lin YF. Expression of serine protease matriptase in renal cell carcinoma: correlation of tissue microarray immunohistochemical expression analysis results with clinicopathological parameters. Int J Surg Pathol 2006; 14: 65–72. [DOI] [PubMed] [Google Scholar]
- 43. Kataoka H, Itoh H, Uchino H et al. Conserved expression of hepatocyte growth factor activator inhibitor type‐2/placental bikunin in human colorectal carcinomas. Cancer Lett 2000; 148: 127–34. [DOI] [PubMed] [Google Scholar]
- 44. Muller‐Pillasch F, Wallrapp C, Bartels K et al. Cloning of a new Kunitz‐type protease inhibitor with a putative transmembrane domain overexpressed in pancreatic cancer. Biochim Biophys Acta 1998; 1395: 88–95. [DOI] [PubMed] [Google Scholar]
- 45. Morris MR, Gentle D, Abdulrahman M et al. Tumor suppressor activity and epigenetic inactivation of hepatocyte growth factor activator inhibitor type 2/spint2 in papillary and clear renal cell carcinoma. Cancer Res 2005; 65: 4598–606. [DOI] [PubMed] [Google Scholar]