

Abstract
We performed genome‐wide screening for deoxyribonucleic acid copy‐number aberrations in 31 gastric cancer (GC) cell lines by using custom‐made comparative genomic hybridization (CGH)‐array. Copy‐number gains were frequently detected at 1q, 3q, 5p, 7p, 7q, 8q, 11q, 17q, 20p, 20q, Xp and Xq, and losses at 3p, 4p, 4q, 8p, 9p, 18p and 18q. With respect to histological subtypes, copy‐number gains at 1p, 16p, 20p, 20q and 22q, and losses at 8p, 10p, 10q and 18q were significantly frequent in cell lines derived from tumors of the well‐differentiated type, whereas copy‐number gains at 1q, 7p, 7q, Xp and Xq were frequent in the undifferentiated type. Homozygous deletions were seen at five loci, whereas high‐level amplifications were detected in 15 of the 31 GC cell lines; these had occurred at 24 loci, including the segment containing CDK6 (7q21.2). Amplification of that gene had never been reported in GC before. Immunohistochemical studies showed increased levels of CDK6 protein in 54 of the 292 primary GC samples we examined (18.5%). Cytoplasmic localization of CDK6, as well as CDK6 over‐expression, was more frequent in well‐differentiated GC than in undifferentiated tumors. Nuclear expression of CDK6 was more frequent in early stage GC than in advanced tumors, suggesting that nuclear localization of CDK6 is likely to be a prognostic factor for GC. Taken together, our data indicate that CDK6 might be involved in the pathogenesis of GC and, more generally, that CGH‐arrays have a powerful potential for identifying novel cancer‐related genetic changes in a variety of tumors. (Cancer Sci 2005; 96: 100–110)
Gastric cancer (GC) is the second most common cause of cancer‐associated death worldwide, (1) despite recent advances in early diagnosis and treatment. Accumulated evidence suggests that multiple genetic alterations, occurring sequentially in a cell lineage, underlie the carcinogenetic process in solid tumors such as GC. Although several specific genetic changes have been reported in GC, including amplifications of CCNE, CMET, ERBB2, and KSAM/FGFR2, mutations of KRAS, TP53, APC, and E‐cadherin genes, and loss of heterozygosity (LOH) on 5q, 17p, and 18q, (2) the molecular events leading to gastric malignancy and the genetic components that are altered at the inception and course of the neoplasm are largely unknown. Unraveling the molecular mechanisms in this process could provide biomarkers for early detection and new molecular targets for development of more effective therapeutic agents.
Because chromosomal gains and losses across an entire genome might be landmarks of putative oncogenes and tumor suppressor genes, respectively, other groups of investigators and the authors of the present paper have analyzed GC by conventional comparative genomic hybridization (CGH). 3 , 4 , 5 That approach has revealed various and frequent copy‐number alterations in gastric tumors, suggesting that many genes are involved in gastric carcinogenesis. Indeed, our CGH experiments successfully identified several novel amplification targets, notably CD44 at 11p13 and IQGAP1 at 15q26. 6 , 7 However, techniques allowing more detailed detection and quantification of copy‐number changes in GC should identify additional genes involved in gastric carcinogenesis, whose products could serve as diagnostic markers and/or therapeutic targets.
Due to its limited sensitivity, conventional CGH requires that a minimum of 5–10 megabases of deoxyribonucleic acid (DNA), in a given genomic region, must be imbalanced for low copy‐number changes to be detectable there. 8 , 9 Furthermore, CGH does not provide information that is precise enough to flag the exact locations of oncogenes or tumor suppressor genes. Therefore, newer techniques that allow high throughput, high‐resolution, and high sensitivity for mapping of copy‐number alterations could provide valuable clues in the hunt for genes associated with gastric carcinogenesis. A recent development, CGH‐array, allows high‐throughput and quantitative analysis of copy‐number changes at high resolution throughout the genome. CGH arrays provide many advantages over conventional CGH and other methods. 10 , 11
In this present study, we created a unique genomic array comprised of 800 bacterial artificial chromosome (BAC)/P1 artificial chromosome (PAC) clones, each spotted in duplicate and specifically selected to contain potential tumor‐related genes. When we used this array to analyze a panel of 31 GC cell lines, the system quantitatively detected and mapped genomic copy‐number alterations at a higher resolution than conventional CGH had performed for the same cells. We also identified a different pattern of genetic aberrations between cell lines with well‐differentiated phenotype and cells derived from undifferentiated tumors.
Materials and Methods
Cell lines and primary tumors. The 31 GC cell lines listed in Table 1 were used in the present study. Characteristics and origins of 25 among these lines are described elsewhere; (6) the other six lines were obtained from the Japanese Collection of Research Bioresources (Osaka, Japan). All lines were maintained in RPMI 1640 supplemented with 10% fetal bovine serum (FBS), 100 U/mL penicillin, and 100 µg/mL streptomycin. Genomic DNA and total ribonucleic acid (RNA) were extracted from each cell line as described elsewhere. (12)
Table 1.
Summary of 31 gastric cancer cell lines
| n | Cell line | Histology † | Source of tumor |
|---|---|---|---|
| 1 | HSC39 | Signet‐ring cell carcinoma | Ascitic fluid |
| 2 | HSC40A | Signet‐ring cell carcinoma | Tumor in nudemouse |
| 3 | HSC41 | Tubular adenocarcinoma (well‐differentiated type 2) | Tumor in nudemouse |
| 4 | HSC42 | Tubular adenocarcinoma (well‐differentiated type 1) | Tumor in nudemouse |
| 5 | HSC43 | Signet‐ring cell carcinoma | Primary tumor |
| 6 | HSC44PE | Signet‐ring cell carcinoma | Pleural fluid |
| 7 | HSC45 | Signet‐ring cell carcinoma | Ascitic fluid |
| 8 | HSC57 | Tubular adenocarcinoma (well‐differentiated type 1) | Ascitic fluid |
| 9 | HSC58 | Signet‐ring cell carcinoma | Ascitic fluid |
| 10 | HSC60 | Signet‐ring cell carcinoma | Ascitic fluid |
| 11 | HSC64 | Poorly differentiated adenocarcinoma | Ascitic fluid |
| 12 | SNU216 | Tubular adenocarcinoma (well‐differentiated type 2) | Lymph node |
| 13 | SNU484 | Poorly differentiated adenocarcinoma | Primary tumor |
| 14 | SNU601 | Signet‐ring cell carcinoma | Ascitic fluid |
| 15 | SNU638 | Poorly differentiated adenocarcinoma | Ascitic fluid |
| 16 | SNU668 | Signet‐ring cell carcinoma | Ascitic fluid |
| 17 | SNU719 | Tubular adenocarcinoma (well‐differentiated type 2) | Primary tumor |
| 18 | SH101‐P4 | Tubular adenocarcinoma (well‐differentiated type 1) | Primary tumor |
| 19 | MKN1 | Adenosquamous cell carcinoma | Lymph node |
| 20 | MKN7 | Tubular adenocarcinoma (well‐differentiated type 1) | Lymph node |
| 21 | MKN28 | Tubular adenocarcinoma (well‐differentiated type 2) | Lymph node |
| 22 | MKN45 | Poorly differentiated adenocarcinoma | Liver metastasis |
| 23 | MKN74 | Tubular adenocarcinoma (well‐differentiated type 2) | Liver metastasis |
| 24 | KATO‐III | Signet‐ring cell carcinoma | Pleural fluid |
| 25 | OKAJIMA | Poorly differentiated adenocarcinoma | Pleural fluid |
| 26 | NUGC‐2 | Poorly differentiated adenocarcinoma | Lymph node |
| 27 | NUGC‐3 | Poorly differentiated adenocarcinoma | Branchial muscle metastasis |
| 28 | NUGC‐4 | Poorly differentiated adenocarcinoma containing signet‐ring cells | Lymph node |
| 29 | OCUM‐1 | Poorly differentiated adenocarcinoma containing signet‐ring cells | Tumor in nudemouse |
| 30 | RERF‐GC‐1B | Unknown | Lymph node |
| 31 | AZ‐521 | Unknown | Unknown |
Histological subtype of the primary tumor from which each cell was derived.
Paraffin‐embedded specimens of primary GC to be used for immunohistochemistry (IHC) were obtained from 292 unrelated patients (160 with well‐differentiated type and 132 with undifferentiated type), treated at the National Defense Medical Collage Hospital (Saitama, Japan) with written consent from each patient in the formal style and after approval by the local ethics committee. Clinicopathological data were collected on the basis of the Japanese Research Society for Gastric Cancer, Japanese classification of gastric carcinoma. Tumor stages were classified according to the tumor‐node‐metastasis (TNM) classification of the International Union Against Cancer; 152 with stage I, 38 with stage II, 57 with stage III, and 45 with stage IV. The duration of overall survival was calculated for each patient from the date of primary surgery to the date of the last follow‐up visit or death.
CGH‐array analysis. We prepared our custom‐made CGH‐array (MCG Cancer Array‐800) using 800 BAC/PAC clones that carried genes or sequence‐tagged site (STS) markers, which we judged to be of potential importance in cancer genesis or progression. These clones were selected from the genome databases archived by the National Center for Biotechnology Information (http://www.ncbi.nlm.nih.gov/), or the University of California Santa Cruz Genome Bioinformatics (http://genome.ucsc.edu/), and on the basis of results from a similarity‐search program (BLAST; http://www.ncbi.nlm.nih.gov/BLAST/). Since the average size of BAC/PAC clones is approximately 150–200 kb, each BAC/PAC contains up to three genes at least, partially including a representative gene/STS marker of each region (http://www.cghtmd.jp/cghdatabase/arraylist/frame.html). All of those genes and STS markers are listed elsewhere (http://www.cghtmd.jp/cghdatabase/index.html).
Each DpnI/RsaI/HaeIII‐restricted BAC/PAC DNA was amplified by two rounds of ligation‐mediated PCR, with a primer containing a 5′‐amine group, printed in duplicate by inkjet‐type spotter (GENESHOT; NGK Insulators, Nagoya, Japan), and covalently attached to an Oligo DNA Microarray (Matsunami Glass, Osaka Japan). Sequences of the adaptors and primers are available upon request.
CGH‐array hybridizations were carried out as described by Snijders et al. (13) and Massion et al. (14) with modifications. (15) Briefly, DpnII‐restricted test and reference (male) genomic DNA were labeled by random priming with 0.2 mM each of dATP, dTTP and dGTP, 0.1 mM dCTP, and 0.4 mM of either Cy3‐dCTP (test DNA) or Cy5‐dCTP (reference DNA) (Amersham Biosciences, Tokyo, Japan). Cy‐labeled test and reference DNA were precipitated together with ethanol in the presence of Cot‐1 DNA, redissolved in a hybridization mix (50% formamide, 10% dextran sulfate, 2 × standard saline citrate [SSC], 4% sodium dodecyl sulfate [SDS], pH 7), and denatured at 75°C for 10 min. After incubation at 37°C for 30 min, the mixture was applied to array slides set up in custom‐made hybridization chambers, and incubated at 37°C on a slowly rocking table for 48–72 h. After hybridization, the slides were washed once in a solution of 50% formamide, 2 × SSC (pH 7.0) for 15 min at 50°C, once in 2 × SSC, 0.1% SDS for 15 min at 50°C, and once in a 0.1 mol/L sodium phosphate buffer containing 0.1% Nonidet P‐40 (pH 8) for 15 min at room temperature. After air‐drying, the arrays were scanned with a GenePix 4000B (Axon Instruments, Foster City, CA, USA), and acquired images were analyzed with GenePix Pro 4.1 imaging software (Axon Instruments). Fluorescence ratios were normalized so that the mean of the middle third of log2ratios across the array was zero. Average ratios that deviated significantly (>2 SD) from 0 were considered abnormal.
Fluorescence in situ hybridization. Metaphase chromosome slides were prepared from each cell line. To prepare elongated prophase chromosomes, we treated the cells with ICRF154. (16) BAC containing CDK6 (RP5–850G1), MCL1 (RP11–54A4), MET (MCG‐1), MUC1 (RP11–98F1), RNF28 (RP11–96L14), RB1 (CTD‐2173J2), or GPC5 (RP11–95C14) genes were labeled with biotin‐16‐dUTP or digoxigenin‐11‐dUTP by nick‐translation (Roche Diagnostics, Tokyo, Japan), denatured with Cot‐1 DNA, and then hybridized to the chromosome slides. Fluorescent detection of hybridization signals was carried out as described elsewhere. (17) The cells were counter‐stained with 4′, 6‐diamidino‐2‐phenylindole (DAPI).
Quantitative real‐time reverse transcription‐polymerase chain reaction. Levels of CDK6 messenger‐RNA (mRNA) were measured by means of a real‐time fluorescence detection method. (18) Single‐stranded cDNA were generated from total RNA using the SuperScript First‐Strand Synthesis System (Invitrogen, Carlsbad, CA, USA). Real‐time quantitative polymerase chain reaction (PCR) was performed with an ABI PRISM 7900HT (Applied Biosystems, Foster City, CA, USA) according to the manufacturer's protocol, using CYBR Green and primers CDK6‐F (5′‐ACCTCAGTGGTCGTCACGCT‐3′) and CDK6‐R (5′‐AGCCAACACTCCAGAGATCCA‐3′). The glyceraldehyde‐3‐phosphate dehydrogenase gene (GAPDH) served as an endogenous control; the expression level of CDK6 mRNA in each sample was normalized on the basis of the respective GAPDH content and recorded as a relative expression level. PCR amplification was performed in duplicate for each sample.
Immunohistrochemistry. Indirect IHC was performed on formalin‐fixed, paraffin‐embedded tissue sections, as described elsewhere. (12) For each of 292 cases of GC, we selected one to four representative hematoxylin–eosin (HE)‐stained sections by reviewing routine histopathological sections microscopically, and obtained the corresponding tissue blocks stored in the hospital. To construct tissue‐microarray (TMA) blocks, 2–5 tissue cores were taken from each representative tissue block, and a maximum of 57 tissue cores were transferred to a recipient block using a Tissue Microarrayer (Beecher Instruments, Silver Spring, MD, USA). We used cores measuring 2.0 mm in diameter and arranged them 0.7–0.8 mm apart in a recipient block. A total of 24 TMA sets, comprising 1 017 core specimens, were constructed. The sections were de‐waxed and rehydrated in graded concentrations of ethanol. Antigens were retrieved by microwave pretreatment in 10 mM citrate buffer (pH 6.0) for 10 min. After cooling, the sections were treated with 3% hydrogen peroxide to block endogenous peroxidase, then reacted overnight at 4°C with antihuman CDK6 polyclonal antibody (1:100, C‐21; Santa Cruz Biotechnology, Santa Cruz, CA, USA), CCND1 monoclonal antibody (1:50, DSC‐6; DakoCytomation, Kyoto, Japan) or normal rabbit serum. The sections were rinsed, incubated with rabbit EnVision + peroxidase (DakoCytomation), stained with 0.05% hydrogen peroxide and 3,3′‐diaminobenzidine, and counterstained with hematoxylin. Two formalin‐fixed cell lines over‐expressing CDK6 (OKAJIMA and SNU484) were used as positive controls, and also as negative controls where the primary antibody was omitted.
Expression levels of CDK6 were divided into four categories according to the percentages of CDK6‐positive cells in a sample (cytoplasm or nucleus) as follows: no positive cells or <10% positive cells, 0; weakly positive cells >10%, +1; strongly positive cells >10%, +2; very strongly positive cells >10%, +3. Expression levels of CCND1 were divided into three categories according to the degree of CCND1 positivity, as follows: no positivity, 0; weakly positive, +1; strongly positive, +2. GC samples containing levels 0 or +1 were defined in both cases as negative expression, and samples containing levels +2 or +3, as positive.
Statistical analysis. Possible correlations between histological subtypes of the GC cell lines and copy‐number status of each spot were tested by χ2 or Fisher's exact tests. The Mann–Whitney U‐test was used to compare the mRNA expression level of CDK6, between its DNA copy‐number status and the histological subtype of the original tumor from which each cell line was derived. Correlation between CDK6 expression/expression pattern in primary tumors of GC and histological subtype, clinicopathological variables, or CCND1‐expression status were analyzed for statistical significance by χ2 or Fisher's exact tests. Survival data were analyzed according to the method of Kaplan and Meier. The log‐rank test was used to compare survival data with CDK6‐expression patterns. P‐values of less than 0.05 were considered significant.
Results
Quality test of the MCG Cancer‐800 array. We tested the quality of our MCG Cancer Array‐800 and the intrinsic variability of the method by performing five sex‐matched, normal‐versus‐normal control hybridizations, using DNA from peripheral blood leukocytes. These control experiments used the same batch of arrays, with identical labeling and hybridization conditions. Figure 1 shows a representative profile and a histogram of copy numbers across all clones from chromosomes 1–22, X, and Y, in the five control hybridizations. The average values for each clone were contained within the thresholds of 0.2 and −0.2 (log2ratio), and the means ± 2 SD of all clones were within the range of 0.4 and −0.4 (log2ratio). The histogram in Figure 1b indicates a correct normal distribution. On the basis of these results, the thresholds for copy‐number gain and loss were set at log2ratios of 0.4 and −0.4, respectively, for calculating the frequencies of copy‐number alterations in GC cell lines. For the present study, we defined log2ratios > 2.0 as high‐level amplifications and log2ratios < −2.0 as homozygous deletions.
Figure 1.
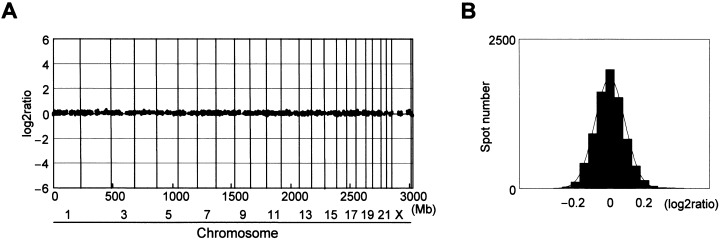
Normal‐versus‐normal control hybridizations. (a) Representative genomic profile obtained from one of the five control experiments. Clones are ordered from chromosomes 1–22, X and Y, and within each chromosome on the basis of the UCSC mapping position (http://genome.ucsc.edu/[version April, 2003]). Each dark spot (two spots/each clone) represents test over reference value after normalization and log2 transformation. Thresholds for copy‐number gain and loss were defined at log2ratios of 0.4 and − 0.4, respectively. None of the clones included in the final data set crossed these thresholds for the control experiment, (b) histogram of the ratios obtained for all five control hybridizations. Thresholds for copy‐number gain and loss were set at log2ratios of 0.4 and −0.4, respectively.
CGH‐array analysis of GC cell lines. We assessed copy‐number alterations among the 31 GC cell lines using the same batch of MCG Cancer Array‐800 slides for all of them. Figure 2 shows the frequencies of copy‐number gains and losses across the entire genomes of all 31 cell lines. Table 2 lists the clones that had the most frequent gains or loses in this series, and those with high‐level amplifications or homozygous deletions. Some degree of gain and/or loss was seen in every cell line. Our CGH‐array predicted frequent copy‐number gains for 1q, 3q, 5p, 7p, 7q, 8q, 11q, 17q, 20p, 20q, Xp and Xq, and frequent losses for 3p, 4p, 4q, 8p, 9p, 18p and 18q. High‐level amplifications (log2ratio > 2) were detected in 15 of the 31 GC cell lines, and 24 genes (clones) were represented (Table 3). Among them, nine genes, MET (7q31.2), MYC (8q24.21), PVT1 (8q24.21), KSAM (10q26.13), PKY (11p13), CD44 (11p13), KRAS (12p12.1), IQGAP1 (15q26.1), and FURIN (15q26.1), were detected as high‐level amplifications in more than two cell lines each. However, homozygous deletions (log2ratio < −2) were seen in 10 of the cell lines. Of those, MTAP and CDKN2A/p16 at 9p21.3 and TEK at 9p21.2 were homozygously deleted in seven and three cell lines, respectively. Deletions of RB1 at 13q14.2 and SNRPN at 15q11.2 were observed in one cell line each.
Figure 2.
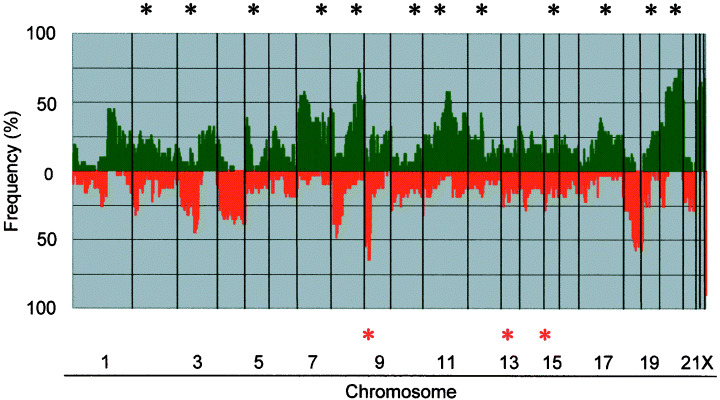
Genome‐wide frequencies of copy‐number gains (above 0, green) and losses (below 0, red) in 31 gastric cancer (GC) cell lines. Clones are ordered from chromosomes 1–22, X and Y, and within each chromosome on the basis of the UCSC mapping position (http://genome.ucsc.edu/[version April, 2003]). Green asterisks, clones with at least one high‐level amplification; red asterisks, clones with at least one homozygous deletion.
Table 2.
Most frequently gained and/or lost clones
| Alteration | Gene | Locus | Frequency (%) † |
|---|---|---|---|
| Gain | PVT1 | 8q24.21 | 71.0 |
| MYC | 8q24.21 | 69.4 | |
| FOLR1 | 11q13.4 | 58.1 | |
| PLUNC(LUNX) | 20q11.21 | 59.7 | |
| BCL2L1(BCLX) | 20q11.21 | 58.1 | |
| E2F1 | 20q11.22 | 58.1 | |
| TGIF2 | 20q11.23 | 61.3 | |
| TNFRSF5 | 20q13.12 | 67.7 | |
| NCOA3 | 20q13.12 | 67.7 | |
| ELMO2 | 20q13.12 | 66.1 | |
| MYBL2 | 20q13.12 | 64.5 | |
| NCOA3(AIB1) | 20q13.12 | 58.1 | |
| PTPN1 | 20q13.13 | 74.2 | |
| PRex1 | 20q13.13 | 66.1 | |
| BCAS1 | 20q13.2 | 74.2 | |
| ZNF217 | 20q13.2 | 72.6 | |
| STK6(BTAK) | 20q13.31 | 58.1 | |
| Cul4B | Xq24 | 62.9 | |
| MCF2 | Xq27.1 | 62.9 | |
| CTAG | Xq28 | 66.1 | |
| Loss | BAIAP1 | 3p14.1 | 45.2 |
| PTPRG | 3p14.2 | 43.5 | |
| N33 | 8p22 | 46.8 | |
| TEK | 9p21.2 | 45.2 | |
| MTAP | 9p21.3 | 64.5 | |
| CDKN2A(p16) | 9p21.3 | 64.5 | |
| MLLT3 | 9p21.3 | 43.5 | |
| JAK2 | 9p24.1 | 53.2 | |
| GASC1 | 9p24.1 | 51.6 | |
| D9S913 | 9p24.3 | 50.0 | |
| SMAD4 | 18q21.1 | 53.2 | |
| MADH2 | 18q21.1 | 50.0 | |
| MADH7(SMAD7) | 18q21.1 | 45.2 | |
| DCC | 18q21.2 | 56.5 | |
| MALT1 | 18q21.31 | 50.0 | |
| MALT1 | 18q21.31 | 46.8 | |
| GRP | 18q21.32 | 53.2 | |
| BCL2 | 18q21.33 | 54.8 | |
| FVT1 | 18q21.33 | 50.0 | |
| SERPINB5(PI5) | 18q21.33 | 43.5 | |
| CTDP1 | 18q23 | 54.8 |
Alterations were defined by log2ratio thresholds of 0.4 and −0.4 for copy‐number gain and loss, respectively. Using this threshold, we generated a frequency Table. In this Table, the 20 and 21most frequently gained and lost clones are shown, ordered according to chromosomal positions.
Table 3.
Genes showing high‐level amplifications and homozygous deletions among 31 gastric cancer cell lines
| Alteration | Genes | Locus | n † | Well (/9) ‡ | Un (/19) § | Others |
|---|---|---|---|---|---|---|
| High‐level amplifications (log2 > 2.0) | SDC1 | 2p24.1 | 1 | 0 | 1 | 0 |
| DNMT3A | 2p23.3 | 1 | 0 | 1 | 0 | |
| MLH1 | 3p22.3 | 1 | 0 | 1 | 0 | |
| CTNNB1 | 3p22.1 | 1 | 0 | 1 | 0 | |
| CCK | 3p21 | 1 | 0 | 1 | 0 | |
| ZNF131 | 5p12 | 1 | 0 | 1 | 0 | |
| CDK6 | 7q21.2 | 1 | 0 | 1 | 0 | |
| MET | 7q31.2 | 3 | 0 | 3 | 0 | |
| MYC | 8q24.21 | 6 | 1 | 5 | 0 | |
| PVT1 | 8q24.21 | 6 | 1 | 5 | 0 | |
| EGR2 | 10q21.3 | 1 ¶ | 0 | 0 | 1 | |
| KSAM(FGFR2) | 10q26.13 | 4 | 0 | 4 | 0 | |
| PKY(HIPK3) | 11p13 | 2 | 0 | 2 | 0 | |
| LMO2 | 11p13 | 1 | 0 | 1 | 0 | |
| CD44 | 11p13 | 3 | 0 | 3 | 0 | |
| KRAS | 12p12.1 | 5 †† | 1 | 3 | 1 | |
| KRAG(SSPN) | 12p12.1 | 1 ‡‡ | 0 | 0 | 1 | |
| CYP1A1 | 15q24.1 | 1 | 0 | 1 | 0 | |
| IQGAP1 | 15q26.1 | 2 | 0 | 2 | 0 | |
| FURIN(PACE) | 15q26.1 | 2 | 0 | 2 | 0 | |
| PPARBP | 17q12 | 1 | 1 | 0 | 0 | |
| ERBB2 | 17q12 | 1 | 1 | 0 | 0 | |
| CCNE1 | 19q12 | 1 | 1 | 0 | 0 | |
| MYBL2 | 20q13.12 | 1 § | 0 | 0 | 1 | |
| Homozygous deletions (log2 < −2.0) | MTAP | 9p21.3 | 7 | 1 | 6 | 0 |
| CDKN2A(p16) | 9p21.3 | 7 | 1 | 6 | 0 | |
| TEK | 9p21.2 | 3 | 0 | 3 | 0 | |
| RB1 | 13q14.2 | 1 | 0 | 1 | 0 | |
| SNRPN | 15q11.2 | 1 | 0 | 1 | 0 |
n, Total number of cell lines involved in high‐level amplification or homozygous deletion,
‡ well, total number of cell lines from well‐differentiated tumors showing amplification or homozygous deletion,
§ Un, total number of cell lines from undifferentiated tumors showing amplification or homozygous deletion,
¶ amplification observed without information about histological subtype,
†† one of these lines was established from an adenosquamous gastric cancer (GC),
‡‡ this cell line was established from adenosquamous GC.
The copy‐number aberrations, revealed through CGH‐array analysis, were mostly consistent with those of our earlier conventional CGH analysis of the same GC cell lines, (6) and with results of other published reports using primary GC samples. 3 , 4 , 5 However, our CGH‐array analysis disclosed additional regions that had never been pointed out by conventional CGH, such as small gains, losses and homozygous deletions. In particular, we detected a copy‐number gain of the MCL1‐containing region at 1q21.3 and loss of the RNF28‐containing region at 1p36.11 in MKN45 cells, as well as homozygous deletion of RB1 at 13q14.2 in HSC43 cells. Fluorescence in situ hybridization (FISH) images, specific for MCL1, RNF28 and RB1, confirmed the respective copy‐number gain, loss and homozygous deletion (Fig. 3a,b). In the OKAJIMA cell line, conventional CGH had shown gain of almost the entire long‐arm of chromosome 7, whereas the CGH‐array identified independent high‐level amplifications of CDK6 at 7q21.2 and MET at 7q31.2 (Fig. 3c). Notably, FISH clearly demonstrated that CDK6 and MET were independently amplified on different double minute chromosomes in OKAJIMA cells (Fig. 3c).
Figure 3.
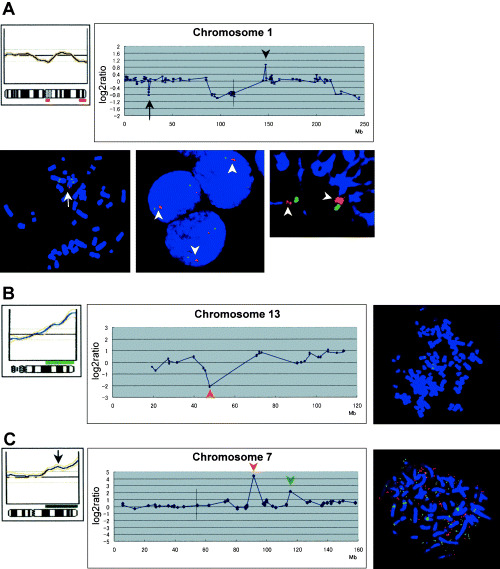
(a) Genetic changes observed on chromosome 1 of MKN45 cells. Copy‐number gain of MCL1 at 1q21.3 and loss of RNF28 at 1p36.11, neither of which had been detected by conventional comparative genomic hybridization (CGH) (upper left), were clearly revealed by CGH‐array analysis (upper right). A vertical line indicates the position of the centromere. These alterations were confirmed by fluorescence in situ hybridization (FISH) analysis; one‐copy loss of RNF28 (red, arrow) was detected compared to MUC1 (blue, bottom left), whereas two‐copy gain of MCL1 (red, arrowheads) was detected compared to MUC1 (blue) in interphase (bottom middle) or prophase (bottom right) chromosome slides, (b) genetic changes observed on chromosome 13 of the HSC43 cell line. Homozygous deletion of RB1 (red arrowhead) at 13q14.2 was detected by CGH‐array (middle), although conventional CGH had failed to detect this alteration (left). FISH images specific for RB1 (red) confirmed the homozygous deletion, (c) genetic changes observed on chromosome 7 of the OKAJIMA cell line. CGH‐array analysis identified two independent high‐level amplifications, of CDK6 at 7q21.2 (middle, red arrowhead) and MET at 7q31.2 (green arrowhead), whereas conventional CGH had detected gain of almost the entire long‐arm of chromosome 7 (arrow, left). A vertical line in the middle panel indicates the position of the centromere. FISH analysis demonstrated that CDK6 (red) and MET (green) were independently amplified on different double minute chromosomes (right).
Relationship between patterns of copy‐number changes and histological subtypes of GC‐derived cell lines. GC is classified into two major histological subtypes according to the degree of differentiation: a well‐differentiated (intestinal) type and an undifferentiated (diffuse) type; the latter category comprises poorly differentiated adenocarcinomas and signet‐ring cell carcinomas. 19 , 20 Each type reveals different characteristics with regard to clinicopathological parameters and genetic differences, and candidate genes responsible for those phenotypic differences have been proposed. 2 , 21 , 22 , 23 , 24 The ability of CGH‐arrays to differentiate among histological types of renal cancer (25) suggested that we might be able to identify novel genes involved in different histological types of GC by CGH‐array analysis. According to the degree of differentiation, we classified 28 of our GC cell lines into well‐differentiated and undifferentiated types, on the basis of the diagnoses of the primary tumors from which they were derived, and compared their patterns of copy‐number aberrations. The RERF‐GC‐1B and AZ‐521 cell lines were excluded because we lacked a pathological diagnosis of their original tumors; the MKN1 cell line was excluded because it had been established from adenosquamous cell carcinomas.
In cells derived from well‐differentiated tumors (Fig. 4a), the most frequent gain was at 20q (>85%) and frequent losses were seen at 8p, 18q and 9p (>75%). In the undifferentiated type (Fig. 4b), frequent gains were observed at Xq and 8q (>70%) and losses at 9p and 18q (>40%). Statistically significant differences of copy‐number gains between well‐ and undifferentiated types were found in spots located at 1p, 16p, 20p, 20q and 22q (well‐differentiated > undifferentiated) and 1q, 7p, 7q, Xp and Xq (undifferentiated > well‐differentiated). In particular, PCNA at 20p12.3 and PYGB at 20p11.21 were the most significantly gained spots in the well‐differentiated type compared to the undifferentiated type (P < 0.01). However, significant differences in losses between well‐ and undifferentiated types were seen in spots located at 8p, 10p, 10q and 18q (well‐differentiated > undifferentiated). NAT1 and NAT2 at 8p22 were the most significant losses in well‐differentiated cells compared to the undifferentiated type (P < 0.001; Table 4).
Figure 4.

Genome‐wide frequency of copy‐number gains (above 0, green) and losses (below 0, red) in nine well‐ (a), versus 19 undifferentiated (b) types of gastric cancer (GC) cells. Clones are ordered from chromosomes 1–22, X, and Y, and within each chromosome on the basis of the UCSC mapping position (http://genome.ucsc.edu/[version April, 2003]). Green arrowheads or arrows, regions frequently gained; red arrowheads, regions frequently deleted in the well‐differentiated type.
Table 4.
Differences of copy number alterations between well‐ and undifferentiated phenotypes
| Alteration | Difference | Gene | Locus | P‐value |
|---|---|---|---|---|
| Gain | Well > Un | PRKCZ | 1p36.33 | 0.026 |
| TGFBR3 | 1p22.1 | 0.026 | ||
| Un > Well | MCL1 | 1q21.3 | 0.039 | |
| AF1Q | 1q21.3 | 0.049 | ||
| BRAL1 | 1q23.1 | 0.049 | ||
| PRCC | 1q23.1 | 0.016 | ||
| NTRK1 | 1q23.1 | 0.049 | ||
| KISS1 | 1q32.1 | 0.026 | ||
| PCTK3 | 1q32.1 | 0.029 | ||
| TP53BP2 | 1q42.11 | 0.026 | ||
| ABCB10 | 1q42.13 | 0.029 | ||
| Un > Well | EGFR | 7p11.2 | 0.042 | |
| ELN | 7q11.23 | 0.042 | ||
| MUC3A | 7q22.1 | 0.049 | ||
| MET | 7q31.2 | 0.039 | ||
| Well > Un | MYH11 | 16p13.11 | 0.026 | |
| LRP | 16p11.2 | 0.026 | ||
| Well > Un | PCNA | 20p12.3 | 0.003 | |
| PYGB | 20p11.21 | 0.003 | ||
| BCL2L1(BCLX) | 20q11.21 | 0.039 | ||
| HCK | 20q11.21 | 0.039 | ||
| PLUNC(LUNX) | 20q11.21 | 0.039 | ||
| E2F1 | 20q11.22 | 0.039 | ||
| TGIF2 | 20q11.23 | 0.049 | ||
| TNFRSF5 | 20q13.12 | 0.026 | ||
| ELMO2 | 20q13.12 | 0.026 | ||
| NCOA3(AIB1) | 20q13.12 | 0.039 | ||
| NCOA3 | 20q13.12 | 0.026 | ||
| PRex1 | 20q13.13 | 0.026 | ||
| STK6(BTAK) | 20q13.31 | 0.026 | ||
| TFAP2C | 20q13.31 | 0.049 | ||
| Well > Un | BCR | 22q11.23 | 0.026 | |
| CABIN1(KIAA0330) | 22q11.23 | 0.026 | ||
| Un > Well | SSX1 | Xp11.23 | 0.042 | |
| AR | Xq12 | 0.035 | ||
| MLLT7 | Xq13.1 | 0.039 | ||
| ABCB7 | Xq13.3 | 0.049 | ||
| Loss | Well > Un | D8S504 | 8p23.3 | 0.01 |
| ANGPT | 8p23.1 | 0.013 | ||
| DLC1 | 8p22 | 0.01 | ||
| N33 | 8p22 | 0.004 | ||
| NAT1(AAC1) | 8p22 | 0.00041 | ||
| NAT2 | 8p22 | 0.00041 | ||
| LPL | 8p21.3 | 0.003 | ||
| LZTS1 | 8p21.3 | 0.01 | ||
| TNFRSF10B | 8p21.2 | 0.005 | ||
| NKX3‐1(NKX3A) | 8p21.2 | 0.005 | ||
| NRG1 | 8p12 | 0.013 | ||
| Well > Un | BMI1 | 10p12.2 | 0.007 | |
| PCDH15 | 10q21.1 | 0.026 | ||
| Well > Un | SERPINB5(PI5) | 18q21.33 | 0.042 | |
| CTDP1 | 18q23 | 0.039 |
Un, undifferentiated; well, well‐differentiated.
Genes that were preferentially amplified in the undifferentiated type included KSAM, MYC, MET and CD44. Among them, high‐level amplifications of KSAM and MET had been reported as closely associated with the undifferentiated type of GC. (2) However, high‐level amplifications of ERBB2 and CCNE1 had been observed in the MKN7 cell line, which has a well‐differentiated phenotype. (26) We observed homozygous deletions of CDKN2A/p16 and MTAP more frequently in the undifferentiated type. However, no other significant differences were apparent with regard to high‐level amplifications or homozygous deletions.
Chromosome 7q, which contains the CDK6 gene, was one of the regions of significantly greater gain of DNA in the undifferentiated type of GC. Moreover, we observed remarkable amplification of CDK6, independent of MET, in one cell line (OKAJIMA; Fig. 3c). MET has already been known as an oncogene in GC. This result recommended CDK6 as a novel candidate for involvement in the pathogenesis of GC, especially the undifferentiated type. To assess that hypothesis, we performed quantitative real‐time reverse transcriptase‐PCR experiments to compare the expression level of CDK6 mRNA in GC cells with its copy‐number status and with histological subtypes (Fig. 5). Expression of CDK6 was also significantly up‐regulated in cell lines that had shown copy‐number gains or high‐level amplification at that locus in CGH‐array analyses, compared to cell lines without copy‐number gains (P = 0.0082), indicating that CDK6 might be over‐expressed in a copy‐number dependent manner. However, correlation between CDK6 mRNA levels and histological subtypes of the GC cell lines was less significant (P = 0.3132).
Figure 5.
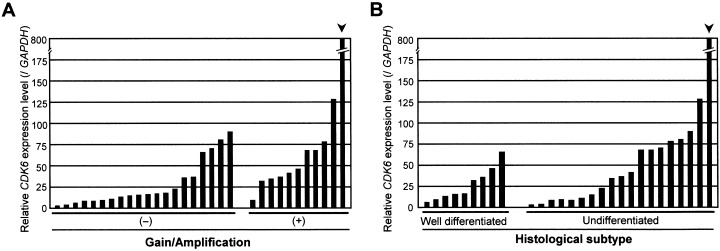
Expression levels of CDK6 messenger ribonucleic acid (mRNA) in gastric cancer (GC) cell lines, compared with (a) copy‐number changes, and (b) histological type. The level of CDK6 mRNA in each sample was normalized on the basis of the respective GAPDH content and recorded as a relative expression level. We compared the expression of CDK6 between cells without copy‐number gain/amplification (n = 20) and those with copy‐number gain/amplification (n = 11), and between cells with well‐differentiated phenotype (n = 9) and those with undifferentiated phenotype (n = 19) by a non‐parametric Mann–Whitney U‐test. CDK6 expression levels in cell lines that had shown copy‐number gain/amplification in comparative genomic hybridization‐array analyses were significantly higher than in cell lines without gains (P = 0.0082). Differences between CDK6 expression levels and histological subtypes were less significant (P = 0.3132).
Association of CDK6 protein expression with clinicopathological features or CCND1 expression among primary tumors of GC. To assess the clinical significance of CDK6 over‐expression in GC, we performed immunohistological examinations using TMA samples from primary GC, and compared expression pattern among different tumor phenotypes. 5, 6 summarize the expression status and pattern of CDK6, and relationships with clinicopathological features or CCND1 expression in primary tumors. Representative immunostaining patterns of CDK6 are shown in Figure 6a–c. Of the 292 primary GC examined, 54 (18.5%) were positive for CDK6 over‐expression; that is, 37 (23.1%) of 160 well‐differentiated GC and 17 (12.9%) of 132 undifferentiated tumors. The difference between those two groups reached statistical significance (P = 0.033, χ2 test).
Table 5.
CDK6 and CCND1 expression status in each subtype of gastric cancer according to Japanese histological classification
| Histological subtype | Expression of CDK6 | Expression of CCND1 | |||
|---|---|---|---|---|---|
| Negative (0, +1) n = 238 | Positive (>+2) † n = 54 (18.5%) | Positive (+2) n = 116 (39.7%) | |||
| Cytoplasmic (C > +2) n = 28 (9.6%) | Nuclear (N > +2) n = 44 (15.1%) | ||||
| Well‐differentiated type | n = 160 | 123 | 37 (23.1%) | 58 (36.3%) | |
| Papillary type (pap) | 20 | 17 | 1 | 2 | 5 |
| Well type (tub1) | 54 | 41 | 9 | 11 | 15 |
| Moderately type (tub2) | 86 | 65 | 13 | 16 | 38 |
| Undifferentiated type | n = 132 | 115 | 17 (12.9%) | 58 (43.9%) | |
| Poorly solid type (por1) | 15 | 14 | 1 | 0 | 9 |
| Poorly non‐solid type (por2) | 92 | 76 | 4 | 15 | 38 |
| Signet‐ring cell type (sig) | 19 | 19 | 0 | 0 | 9 |
| Mucinous type (muc) | 6 | 6 | 0 | 0 | 2 |
Expression of CDK6 was positive in either cytoplasm or nucleus.
Table 6.
Relationship between expression of CDK6 and clinicopathological features of gastric cancer
| Features | n | Expression of CDK6 | |||
|---|---|---|---|---|---|
| Positive in the cytoplasm | Positive in the nucleus | ||||
| C > +2 | P‐value* | N > +2 | P‐value** | ||
| Histological subtype | |||||
| Well‐differentiated type | 160 | 23 | 0.002 | 29 | 0.139 |
| Undiffrentiated type | 132 | 5 | 15 | ||
| Stage (depth) | |||||
| Early | 132 | 12 | 0.844 | 25 | 0.101 |
| Advanced | 160 | 16 | 19 | ||
| Stage (TNM) | |||||
| Stage I + II | 190 | 18 | 1.000 | 34 | 0.127 |
| Stage III + IV | 102 | 10 | 11 | ||
| Lymph node metastasis † | |||||
| (–) | 151 | 14 | 1.000 | 26 | 0.250 |
| (+) | 139 | 13 | 17 | ||
| Liver metastasis † | |||||
| (–) | 285 | 27 | 0.795 | 44 | 0.529 |
| (+) | 6 | 1 | 0 | ||
| Expression of CCND1 | |||||
| (–, +1) | 176 | 18 | 0.690 | 26 | 0.868 |
| (≥ +2) | 116 | 10 | 18 | ||
Compared with negative expression in cytoplasm,
**compared with negative expression in nucleus,
† gastric cancer samples without information about lymph node or liver metastasis were excluded from analysis. TNM, tumor‐node‐metastasis.
Figure 6.
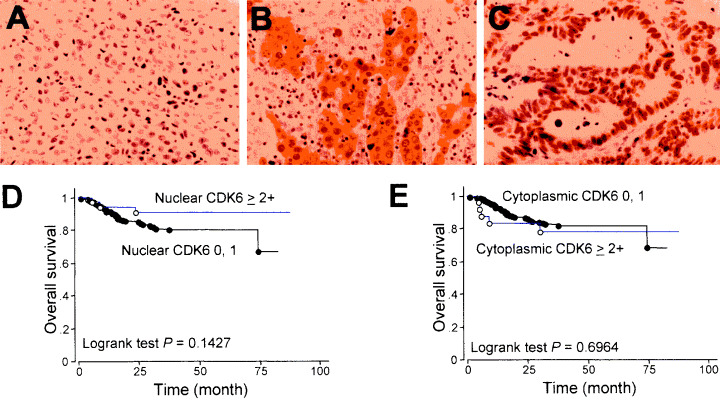
CDK6 expression in primary gastric tumors. (a–c) Representative staining patterns of CDK6 protein, from experiments using a tissue microarray (TMA) system to examine 292 cases of gastric cancer (GC). (a) 0, (b) cytoplasmic 2+, (c) nuclear 2+×200, (d,e) expression pattern of CDK6 versus overall survival in patients with GC. Nuclear CDK6 expression (d) was associated with better prognosis, although the difference was marginally significant (P = 0.1427), whereas cytoplasmic CDK6 expression (e) showed no correlation with prognosis (P = 0.6964).
Cytoplasmic localization of CDK6 was detected in 9.6% of the tumors examined (28/292); the protein was expressed in nucleus in 15.1% of them (44/292). However, immunohistochemistry revealed more frequent nuclear staining of CCND1 (116 of 292 samples, 39.7%) (Table 5). Although CCND1 is an important binding partner of CDK6 for cell‐cycle progression, the lack of significant correlation between nuclear localization or expression of CDK6 and nuclear CCND1 expression indicates that molecules other than CCND1 may determine the subcellular localization of over‐expressed CDK6. Expression of CDK6 in cytoplasm was more frequent in the well‐differentiated type of GC than in the undifferentiated type (P = 0.002). Nuclear CDK6 expression tended to be more frequent in the non‐solid type of poorly differentiated adenocarcinoma than in the solid type. No CDK6 expression was seen in signet ring‐cell carcinomas.
The frequency of nuclear CDK6 expression was higher in early stage GC than in advanced tumors, although the difference was only marginally significant (P = 0.101); it tended to be higher in GC at the early TNM stage than at the advanced TNM stage (P = 0.127). We found no significant correlation between CDK6 expression patterns and metastasis to the lymph nodes or liver. Univariate analysis of overall survival by the log‐rank test demonstrated an association of nuclear CDK6 expression with better prognosis of GC (Fig. 6d,e), although the difference did not reach statistical significance.
Discussion
The results of our CGH‐array analysis showed good concordance with those of conventional CGH. (6) Furthermore, according to association between chromosomal aberrations and histological subtypes (well‐ and undifferentiated type) of GC cell lines, our data also included the loci, which had been detected by analyses of primary GC samples, such as gain of 20q and loss of 8p in intestinal type GC and gain of 7q in diffuse tumors. 20 , 21 However, small copy‐number changes, even gain or loss of only one copy within a small region that was never detected by conventional CGH, were revealed by our custom‐made CGH‐array. We were able to discriminate independent amplifications of multiple target genes in the same region, such as CDK6 and MET at 7q, which formerly were recognized as one amplicon by conventional CGH. Although MET has been closely associated with the undifferentiated type of GC, (2) CDK6 has never been identified as a target for amplification in GC before. Since the expression level of CDK6 mRNA was significantly higher in cells with copy‐number gain than in cells without that change, CDK6 might be a novel and independent target gene that is up‐regulated in GC through an amplification mechanism in the 7q region.
CDK6 and CDK4 are serine/threonine kinases that positively regulate progression of the G1 phase in association with D‐type cyclin; over‐expressed CDK6 probably contributes to tumorigenesis by dysregulating cell proliferation. Indeed, elevated levels of CDK6 expression have been reported in some hematopoietic tumors and also in solid tumors, including squamous‐cell caricinomas, neuroblastomas, and gliomas. 27 , 28 , 29 , 30 , 31 In this study, some degree of increased expression of CDK6 was also observed in both cell lines and primary tumors of GC, suggesting that activated CDK6 might play an important role in the pathogenesis of GC. We also noted differences with respect to localization of CDK6 protein in nucleus and cytoplasm. It seemed likely that nuclear CDK6 expression was implicated in low‐grade gastric malignancies and therefore might indicate better prognosis, although the correlation did not reach statistical significance. Since nuclear CCND1 expression was not always linked to either CDK6 expression status or subcellular localization, molecules other than CCND1 might determine the localization of over‐expressed CDK6 and be involved in the pathogenesis of specific types of GC.
Conventional CGH does not provide information about sites of homozygous loss that would flag loci of tumor suppressor genes. Some tumor suppressor genes, such as DPC4/SMAD4, RB1, PTEN, INK4/p16 and RASSF1, were originally pinpointed by mapping regions of biallelic loss in cancer cells. 32 , 33 , 34 , 35 , 36 Therefore, mapping of homozygous deletions in GC, using high‐throughput methods with high resolution and sensitivity, should provide valuable clues to the identity of novel tumor suppressor genes associated with gastric carcinogenesis, although different genetic and epigenetic mechanisms apart from homozygous loss might have contributed to their functional loss as well. Using our MCG Cancer Array‐800, which mainly incorporated BAC that contained known tumor‐associated genes (http://www.cghtmd.jp/cghdatabase/index.html), we detected frequent homozygous loss of the INK4/p16 gene, which had already been known to be associated with GC. (37) We also detected homozygous deletions of RB1 and SNRPN, which had never been reported in GC before. However, others have observed that pRB expression was absent in a larger proportion of neoplastic cells of the diffuse type of GC compared to GC cells of the intestinal type, (38) suggesting that down‐regulation of RB1 might be involved in the pathogenesis of undifferentiated GC, through an unknown mechanism.
Acknowledgments
The authors are grateful to Professor Yusuke Nakamura (Human Genome Center, The Institute of Medical Science, The University of Tokyo) for his continuous encouragement throughout this work. We thank Professor Jae‐Gahb Park (Laboratory of Cell Biology, Cancer Research Institute, Seoul National University College of Medicine) and Dr Kazuyoshi Yanagihara (Central Animal Laboratory, National Cancer Center Research Institute) for providing GC cell lines, Drs Mikihiko Kimura and Daisaku Morita (Department of Surgery I, National Defense Medical College) for technical advice, and Ai Watanabe for technical assistance.
This study was supported by a Grants‐in‐Aid for Scientific Research on Priority Areas (C) from the Ministry of Education, Culture, Sports, Science, and Technology, Japan; by a Grant‐in‐Aid from Core Research for Evolutional Science and Technology (CREST) of the Japan Science and Technology Corporation (JST); and by a Center of Excellence (COE) Program for Frontier Research on Molecular Destruction and Reconstitution of Tooth and Bone.
References
- 1. Whelan SL, Parkin DM, Masuyer E. Trends in cancer incidence and mortality. Lyon: IARC Scientific, 1993. [Google Scholar]
- 2. Tahara E. Molecular biology of gastric cancer. World J Surg 1995; 19: 484–90. [DOI] [PubMed] [Google Scholar]
- 3. Sakakura C, Mori T, Sakabe T, Ariyama Y, Shinomiya T, Date K, Hagiwara A, Yamaguchi T, Takahashi T, Nakamura Y, Abe T, Inazawa J. Gains, losses, and amplifications of genomic materials in primary gastric cancers analyzed by comparative genomic hybridization. Genes Chromosomes Cancer 1999; 24: 299–305. [DOI] [PubMed] [Google Scholar]
- 4. Knuutila S, Bjorkqvist AM, Autio K, Tarkkanen M, Wolf M, Monni O, Szymanska J, Larramendy ML, Tapper J, Pere H, El‐Rifai W, Hemmer S, Wasenius VM, Vidgren V, Zhu Y. DNA copy number amplifications in human neoplasms: review of comparative genomic hybridization studies. Am J Pathol 1998; 152: 1107–23. [PMC free article] [PubMed] [Google Scholar]
- 5. Tay ST, Leong SH, Yu K, Aggarwal A, Tan SY, Lee CH, Wong K, Visvanathan J, Lim D, Wong WK, Soo KC, Kon OL, Tan P. A combined comparative genomic hybridization and expression microarray analysis of gastric cancer reveals novel molecular subtypes. Cancer Res 2003; 63: 3309–16. [PubMed] [Google Scholar]
- 6. Fukuda Y, Kurihara N, Imoto I, Yasui K, Yoshida M, Yanagihara K, Park JG, Nakamura Y, Inazawa J. CD44 is a potential target of amplification within the 11p13 amplicon detected in gastric cancer cell lines. Genes Chromosomes Cancer 2000; 29: 315–24. [DOI] [PubMed] [Google Scholar]
- 7. Sugimoto N, Imoto I, Fukuda Y, Kurihara N, Kuroda S, Tanigami A, Kaibuchi K, Kamiyama R, Inazawa J. IQGAP1, a negative regulator of cell‐cell adhesion, is upregulated by gene amplification at 15q26 in gastric cancer cell lines HSC39 and 40A. J Hum Genet 2001; 46: 21–5. [DOI] [PubMed] [Google Scholar]
- 8. Bentz M, Plesch A, Stilgenbauer S, Dohner H, Lichter P. Minimal sizes of deletions detected by comparative genomic hybridization. Genes Chromosomes Cancer 1998; 21: 172–5. [PubMed] [Google Scholar]
- 9. Kirchhoff M, Gerdes T, Maahr J, Rose H, Bentz M, Dohner H, Lundsteen C. Deletions below 10 mega base pairs are detected in comparative genomic hybridization by standard reference intervals. Genes Chromosomes Cancer 1999; 25: 410–3. [DOI] [PubMed] [Google Scholar]
- 10. Albertson DG, Pinkel D. Genomic microarrays in human genetic disease and cancer. Hum Mol Genet 2003; 12: R145–52. [DOI] [PubMed] [Google Scholar]
- 11. Inazawa J, Inoue J, Imoto I. Comparative genomic hybridization (CGH)‐arrays pave the way for identification of novel cancer‐related genes. Cancer Sci 2004; 95: 559–63. [DOI] [PMC free article] [PubMed] [Google Scholar]
- 12. Imoto I, Yang ZQ, Pimkhaokham A, Tsuda H, Shimada Y, Imamura M, Ohki M, Inazawa J. Identification of cIAP1 as a candidate target gene within an amplicon at 11q22 in esophageal squamous cell carcinomas. Cancer Res 2001; 61: 6629–34. [PubMed] [Google Scholar]
- 13. Snijders AM, Nowak N, Segraves R, Blackwood S, Brown N, Conroy J, Hamilton G, Hindle AK, Huey B, Kimura K, Law S, Myambo K, Palmer J, Ylstra B, Yue JP, Gray JW, Jain AN, Pinkel D, Albertson DG. Assembly of microarrays for genome‐wide measurement of DNA copy number. Nat Genet 2001; 29: 263–4. [DOI] [PubMed] [Google Scholar]
- 14. Massion PP, Kuo WL, Stokoe D, Olshen AB, Treseler PA, Chin K, Chen C, Polikoff D, Jain AN, Pinkel D, Albertson DG, Jablons DM, Gray JW. Genomic copy number analysis of non‐small cell lung cancer using array comparative genomic hybridization: implications of the phosphatidylinositol 3‐kinase pathway. Cancer Res 2002; 62: 3636–40. [PubMed] [Google Scholar]
- 15. Sonoda I, Imoto I, Inoue J, Shibata T, Shimada Y, Chin K, Imamura M, Amagasa T, Gray JW, Hirohashi S, Inazawa J. Frequent silencing of low density lipoprotein receptor‐related protein 1B (LRP1B) expression by genetic and epigenetic mechanisms in esophageal squamous‐cell carcinoma. Cancer Res 2004; 64: 3741–7. [DOI] [PubMed] [Google Scholar]
- 16. Inazawa J, Ariyama T, Takino T, Tanigami A, Nakamura Y, Abe T. High resolution ordering of DNA markers by multi‐colour fluorescent in situ hybridization of prophase chromosomes. Cytogenet Cell Genet 1994; 65: 130–5. [DOI] [PubMed] [Google Scholar]
- 17. Ariyama Y, Sakabe T, Shinomiya T, Mori T, Fukuda Y, Inazawa J. Identification of amplified DNA sequences on double minute chromosomes in a leukemic cell line KY821 by means of spectral karyotyping and comparative genomic hybridization. J Hum Genet 1998; 43: 187–90. [DOI] [PubMed] [Google Scholar]
- 18. Yasui K, Arii S, Zhao C, Imoto I, Ueda M, Nagai H, Emi M, Inazawa J. TFDP1, CUL4A, and CDC16 identified as targets for amplification at 13q34 in hepatocellular carcinomas. Hepatology 2002; 35: 1476–84. [DOI] [PubMed] [Google Scholar]
- 19. Lauren P. The two histological main types of gastric adenocarcinoma: diffuse and so‐called intestinal‐type carcinoma. Acta Pathol Microbiol Scand 1965; 64: 31–49. [DOI] [PubMed] [Google Scholar]
- 20. Peng DF, Sugihara H, Mukaisho K, Tsubosa Y, Hattori T. Alterations of chromosomal copy number during progression of diffuse‐type gastric carcinomas: metaphase‐ and array‐based comparative genomic hybridization analyses of multiple samples from individual tumours. J Pathol 2003; 201: 439–50. [DOI] [PubMed] [Google Scholar]
- 21. Kong G, Oga A, Park CK, Kawauchi S, Furuya T, Sasaki K. DNA sequence copy number aberrations associated with histological subtypes and DNA ploidy in gastric carcinoma. Jpn J Cancer Res 2001; 92: 740–7. [DOI] [PMC free article] [PubMed] [Google Scholar]
- 22. Becker KF, Atkinson MJ, Reich U, Becker I, Nekarda H, Siewert JR, Hofler H. E‐cadherin gene mutations provide clues to diffuse type gastric carcinomas. Cancer Res 1994; 54: 3845–52. [PubMed] [Google Scholar]
- 23. Kim KM, Kwon MS, Hong SJ, Min KO, Seo EJ, Lee KY, Choi SW, Rhyu MG. Genetic classification of intestinal‐type and diffuse‐type gastric cancers based on chromosomal loss and microsatellite instability. Virchows Arch 2003; 443: 491–500. [DOI] [PubMed] [Google Scholar]
- 24. Chen HC, Chu RY, Hsu PN, Hsu PI, Lu JY, Lai KH, Tseng HH, Chou NH, Huang MS, Tseng CJ, Hsiao M. Loss of E‐cadherin expression correlates with poor differentiation and invasion into adjacent organs in gastric adenocarcinomas. Cancer Lett 2003; 201: 97–106. [DOI] [PubMed] [Google Scholar]
- 25. Wilhelm M, Veltman JA, Olshen AB, Jain AN, Moore DH, Presti JC Jr, Kovacs G, Waldman FM. Array‐based comparative genomic hybridization for the differential diagnosis of renal cell cancer. Cancer Res 2002; 62: 957–60. [PubMed] [Google Scholar]
- 26. Akama Y, Tasui W, Yokozaki H, Kuniyasu H, Kitahara K, Ishikawa T, Tahara E. Frequent amplification of the cyclin E gene in human gastric carcinomas. Jpn J Cancer Res 1995; 86: 617–21. [DOI] [PMC free article] [PubMed] [Google Scholar]
- 27. Meyerson M, Harlow E. Identification of G1 kinase activity for cdk6, a novel cyclin D partner. Mol Cell Biol 1994; 14: 2077–86. [DOI] [PMC free article] [PubMed] [Google Scholar]
- 28. Chilosi M, Doglioni C, Yan Z, Lestani M, Menestrina F, Sorio C, Benedetti A, Vinante F, Pizzolo G, Inghirami G. Differential expression of cyclin‐dependent kinase 6 in cortical thymocytes and T‐cell lymphoblastic lymphoma/leukemia. Am J Pathol 1998; 152: 209–17. [PMC free article] [PubMed] [Google Scholar]
- 29. Timmermann S, Hinds PW, Munger K. Elevated activity of cyclin‐dependent kinase 6 in human squamous cell carcinoma lines. Cell Growth Differ 1997; 8: 361–70. [PubMed] [Google Scholar]
- 30. Costello JF, Plass C, Arap W, Chapman VM, Held WA, Berger MS, Su Huang HJ, Cavenee WK. Cyclin‐dependent kinase 6 (CDK6) amplification in human gliomas identified using two‐dimensinal separation of genomic DNA. Cancer Res 1997; 57: 1250–4. [PubMed] [Google Scholar]
- 31. Easton J, Wei T, Lahti JM, Kidd VJ. Disruption of the cyclin D/cyclin‐dependent kinase/INK4/retinoblastoma protein regulatory pathway in human neuroblastoma. Cancer Res 1998; 58: 2624–32. [PubMed] [Google Scholar]
- 32. Friend SH, Bernards R, Rogelj S, Weinberg RA, Rapaport JM, Albert DM, Dryja TP. A human DNA segment with properties of the gene that predisposes to retinoblastoma and osteosarcoma. Nature 1986; 323: 643–6. [DOI] [PubMed] [Google Scholar]
- 33. Kamb A, Gruis NA, Weaver‐Feldhaus J, Liu Q, Harshman K, Tavtigian SV, Stockert E, Day RS III, Johnson BE, Skolnick MH. A cell cycle regulator potentially involved in genesis of many tumor types. Science 1994; 264: 436–40. [DOI] [PubMed] [Google Scholar]
- 34. Hahn SA, Schutte M, Hoque AT, Moskaluk CA, Da Costa LT, Rozenblum E, Weinstein CL, Fischer A, Yeo CJ, Hruban RH, Kern SE. DPC4, a candidate tumor suppressor gene at human chromosome 18q21.1. Science 1996; 271: 350–3. [DOI] [PubMed] [Google Scholar]
- 35. Li J, Yen C, Liaw D, Podsypanina K, Bose S, Wang SI, Puc J, Miliaresis C, Rodgers L, McCombie R, Bigner SH, Giovanella BC, Ittmann M, Tycko B, Hibshoosh H, Wigler MH, Parsons R. PTEN, a putative protein tyrosine phosphatase gene mutated in human brain, breast, and prostate cancer. Science 1997; 275: 1943–7. [DOI] [PubMed] [Google Scholar]
- 36. Dammann R, Li C, Yoon JH, Chin PL, Bates S, Pfeifer GP. Epigenetic inactivation of a RAS association domain family protein from the lung tumour suppressor locus 3p21.3. Nat Genet 2000; 25: 315–9. [DOI] [PubMed] [Google Scholar]
- 37. Akama Y, Yasui W, Kuniyasu H, Yokozaki H, Akagi M, Tahara H, Ishikawa T, Tahara E. Genetic status and expression of the cyclin‐dependent kinase inhibitors in human gastric carcinoma cell lines. Jpn J Cancer Res 1996; 87: 824–30. [DOI] [PMC free article] [PubMed] [Google Scholar]
- 38. Constancia M, Seruca R, Carneiro F, Silva F, Castedo S. Retinoblastoma gene structure and product expression in human gastric carcinomas. Br J Cancer 1994; 70: 1018–24. [DOI] [PMC free article] [PubMed] [Google Scholar]