

Abstract
Limited drug penetration into tumor tissue is one of the major factors causing clinical drug resistance in human solid tumors. The multicellular layers (MCL) of human cancer cells have been successfully used to study tissue pharmacokinetics of anticancer drugs. The purpose of this study was to develop a direct and simple method to evaluate vitality changes in situ within MCL using calcein‐AM. Human colorectal (DLD‐1, HT‐29) and bladder (HT‐1376, J‐82) cancer cells were grown in Transwell inserts to form MCL and subjected to paclitaxel exposure. The drug distribution was evaluated using paclitaxel‐rhodamine. Photonic attenuation and limited penetration of calcein‐AM prevented cellular vitality evaluation on optical sections under confocal microscopy in DLD‐1 MCL. However, direct measurement of the fluorescence intensity on frozen sections of MCL allowed successful vitality assessment in more than 80% depth for HT‐29 and J‐82 MCL and in the upper 40% depth for DLD‐1 and HT‐1376 MCL. The penetration of paclitaxel‐rhodamine was greater in HT‐29 than DLD‐1 and its distribution pattern was correlated to the spatial profile of vitality deterioration in both MCL, suggesting that tissue penetration may be an important determinant of drug effect in tumors. In conclusion, a novel method for vitality evaluation in situ within MCL was developed using calcein‐AM. This method may provide clinically relevant data regarding the spatial pharmacodynamics of anticancer agents within avascular regions of solid tumors. (Cancer Sci 2008; 99: 423–431)
Recently, considerable attention has been given to the impact of low drug penetration into solid tumor tissue because it is believed to limit the efficacy of drugs.( 1 , 2 , 3 ) The drug penetration rate through multicellular layers of cancer cells, as well as intracellular accumulation, metabolism, sequestration, tissue residence time, and spatial distribution of a drug within the tumor avascular regions may represent major pharmacokinetic (PK) factors influencing the drug's antitumor efficacy against solid tumors.( 4 , 5 , 6 , 7 )
Three dimensional (3D) in vitro models of human solid tumors mimic the in vivo tumor conditions known to contribute to the multicellular resistance (MCR) of human solid tumors, including the 3D architecture, abundance of extracellular matrix (ECM), and cell–cell and cell–ECM communication.( 8 , 9 , 10 ) Conventional monolayer cultures are over‐simplified and usually produce data with minimal or low clinical relevance.( 11 ) In contrast to the monolayer system, 3D in vitro models have been successfully used to study tissue pharmacokinetics and cytotoxicity of anticancer drugs.
Multicellular spheroids (MCS) and multicellular layers (MCL) are the most common in vitro 3D tumor models used to study the pharmacodynamics and pharmacokinetics of anticancer drugs. Wilson et al. introduced the MCL as a 3D in vitro system and used it to study the extravascular pharmacokinetics of anticancer drugs such as tirapazamine and anthracyclines.( 12 , 13 , 14 ) MCL have been especially successful when used to study the pharmacokinetic–pharmacodynamic (PK‐PD) relationships of chemotherapeutic agents.( 15 , 16 )
The majority of drug efficacy studies using the MCL model have been conducted using conventional cytotoxicity assays, such as the MTS (or MTT), dye exclusion, or clonogenic assay, or cell cycle distribution, following disaggregation of the 3D structure.( 17 , 18 ) These methods produce data that represents an average of the entire cell population of the 3D structure, regardless of the differential drug exposure of each cell. Other methods, such as the outgrowth assay, produce data representing the proliferation status of only the outermost layers.( 18 , 19 ) Kyle et al. however, showed a correlation between the spatial anthracyclines distribution and the 5‐bromodeoxyuridine (BrdU) labeling index, which demonstrated the feasibility of spatial PK‐PD mapping in human solid tumors using an MCL model.( 13 )
Calcein‐AM is a fluorescent dye that penetrates into cells and fluoresces when metabolized to calcein within the viable cells. Because the fluorescence intensity of calcein is proportional to the proliferative activity of a cell, it has been used to assess vitality in the deep layers of multicellular spheroids using confocal microscopy.( 20 , 21 ) Compared to BrdU labeling, which requires embedding and immunohistochemical staining, calcein‐AM is a relatively simple procedure that requires less time.
Paclitaxel (PTX) is one of the most important chemotherapeutic agents used in the treatment of multiple human solid tumors such as ovarian, breast, lung, and head and neck cancers.( 22 ) However, PTX showed an effect‐limiting penetration barrier in human solid tumor models. This barrier has been attributed to several factors, including tissue binding (specific and nonspecific), cell density, and expression of P‐gp.( 6 , 7 , 23 , 24 ) Clinical resistance of colorectal cancers to PTX has been attributed to the overexpression of P‐gp, tubulin mutations and chromosomal instability.( 25 , 26 , 27 ) The potential contribution of limited tissue penetration has not yet been appropriately evaluated, however, due to the absence of an appropriate method to study tissue penetration and distribution and corresponding cell survival in a 3D context.
In this study, we present a novel method developed for direct assessment of drug‐induced deterioration of cell survival in the MCL using a calcein‐AM vitality probe. We used this method to evaluate the spatial antiproliferative effect of PTX in relation to its distribution within 3D cell layers, which represent the avascular tumor microregions, using human solid tumor cell lines.
Materials and Methods
Chemicals and reagents. Calcein‐AM was purchased from Molecular Probes (Eugene, OR, USA). Cell culture reagents and Transwell inserts (0.4‐µm microporous membrane) were purchased from Gibco BRL (Rockville, MD, USA) and Corning Costar (Acton, MA, USA), respectively. PTX was a gift from Hanmi Pharmaceutical (Hwaseong, Korea). The fluorescent paclitaxel, 2′‐O‐(N‐[4′‐tetramethylrhodaminecarbonyl]‐L‐alanyl) paclitaxel was synthesized from 2′‐O‐(L‐alanyl) paclitaxel and 5′‐carboxytetramethylrhodamine succinimidyl ester (C‐2211; Molecular Probes) as previously described, with minor modifications,( 28 ) and described herein as paclitaxel‐rhodamine (PTX‐Road). Other reagents were purchased from Sigma Chemical (St. Louis, MO, USA).
Cell culture. The human colorectal cancer cell lines, DLD‐1 and HT‐29, and bladder cancer cell lines, J‐82 and HT‐1376, were obtained from the Korea Cell Line Bank (Seoul, Korea). DLD‐1, HT‐29 and J‐82 cells were maintained in RPMI‐1640 and HT‐1376 cells were maintained in minimum essential media (MEM). All media were supplemented with 100 µg/mL streptomycin, 100 units/mL penicillin and 10% heat‐inactivated fetal bovine serum in a humidified, 5% (v/v) CO2 atmosphere at 37°C.
Culture of MCL. Cells were grown on collagen‐coated microporous (0.4 µm) membranes in Transwell inserts at a plating density of 3 × 10⁵ cells/100 µL for colorectal cancer cell lines and 1 × 10⁶ cells/100 µL for bladder cancer cell lines. The six inserts were placed in a culture jar supplemented with 150 mL RPMI‐1640 or MEM media with continuous stirring in the bottom chamber.( 16 ) After 6 days of culture (MCL thickness of ~310 µm for J‐82 and 190 µm for others), each Transwell insert was transferred to a six‐well plate containing 7 mL of media in each well for subsequent drug and calcein‐AM exposure. The culture jars as well as six‐well plates were maintained in an incubator with a humidified atmosphere containing 5% CO2 at 37°C during the experiment.
Confocal microscopy. The vitality of the cells in the MCL was assessed using confocal microscopy after staining with calcein‐AM. Briefly, at the end of the culture period or following drug exposure, calcein‐AM was applied to the top chamber of the MCL at a final concentration of 20 µM and the MCL were then incubated at 4°C for 45 min. After reincubation at 37°C for 15 min, the MCL were cut out of the Transwell insert, placed on a cover slip top side down and examined using a confocal laser scanning microscope (MRC 1024 MP; Bio‐Rad, Hercules, CA, USA). Optical sections were acquired at 10‐µm increments along the z‐axis of the sample.
To prepare the stacks of cells, a monolayer culture was harvested into suspension using 0.25% trypsin‐ethylenediaminetetraacetic acid (EDTA), washed twice with phosphate‐buffered saline (PBS) and a suspension exposed to 20 µM calcein‐AM (1 mL/1 × 107 cells) at 37°C for 45 min. Cells were collected and centrifuged onto a cover slip at 400 g for 20 min. The cell number was adjusted to obtain a stack of cells 100–120‐µm thick (Fig. 1a). Stacked cells were also subjected to analysis using a confocal laser scanning microscope for 10‐µm optical sections. Optical sections of the light field were used to locate the coordinates of the upper most layer of cells and the Transwell membrane or glass surface.( 20 ) Fluorescent images were obtained at λEx/Em = 488/517 nm and analyzed using Optimas ver. 6.5 (Media Cybernetics, Buckinghamshire, UK). The mean field intensity was calculated and plotted against depth along the vertical axis at six different locations per sample.
Figure 1.
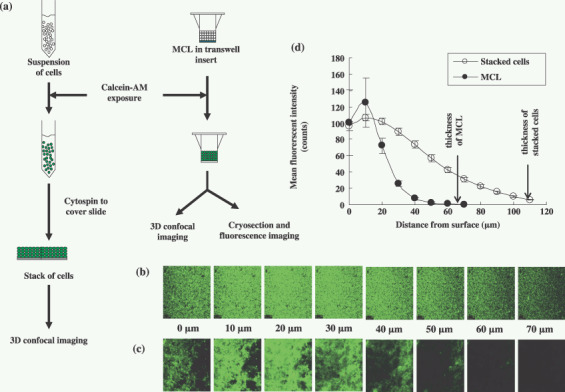
Distribution of calcein‐AM in multicellular layers (MCL) or stacked layers of DLD‐1 cells. Stacked layers of cells were prepared as illustrated in (a). MCL were incubated with calcein‐AM (20 µM) for 45 min at 4°C followed by 15 min at 37°C whereas stacks of cells were prepared with single cell suspension exposed to calcein‐AM (20 µM) for 45 min at 37°C. Images were produced by optical sectioning from top layers to bottom layers at 10‐µm increments along the z‐axis of the stacked of layers (b) or MCL (c) of DLD‐1 cells. Mean fluorescence intensities of optical sections (d) were measured and expressed as mean ± SE (n = 6) for MCL ( ) and stacked cells (
 ).
).
Determining the distribution of calcein‐AM or PTX‐Road within the MCL using cryo‐sections. MCL were exposed to calcein‐AM under the conditions described above after exposure to PTX (100 µM) for 96 h to evaluate drug‐induced vitality deterioration within the MCL. The PTX distribution within the MCL was determined by using PTX‐Road (100 µM). The MCL were cut out of the Transwells and cross‐vertical frozen sections (20 µm) were obtained. A fluorescence microscope (AX70, TR‐6A02; Olympus, Tokyo, Japan) was used to obtain fluorescent images at λEx/Em = 488/517 nm for calcein‐AM and λEx/Em = 482/505 nm for PTX‐Road. Line morphometric analysis of fluorescent intensities along the axis perpendicular to the cell layers was performed using Optimas image analysis software. Data were corrected for tissue autofluorescence by subtracting it from the corresponding measurements,( 16 ) and plotted against the relative distance from the surface of the MCL.
Cytotoxicity assays. The cytotoxicity of PTX against HT‐29 and DLD‐1 cells was determined using calcein‐AM as previously described.( 29 ) Exponentially growing cells were collected using 0.25% trypsin‐EDTA and plated in 96‐well plates at 1000–2000 cells/well. Cells were exposed to PTX for 72 h and subsequently exposed to calcein‐AM (2 µM) for 45 min at 37°C. The fluorescence intensity was measured at λEx/Em = 494/517 nm.
Data analysis. The dose–response curve of PTX was analyzed using Emax model (Eq. 1).
| (1) |
Where (R) is the residual unaffected fraction (the resistance fraction), (D) is the drug concentration used, (Kd) is the drug concentration that produces a 50% reduction of the maximum inhibition rate and (m) is a Hill‐type coefficient. IC50 was defined as the drug concentration required to reduce fluorescence to 50% of that of the control (i.e. Kd = IC50 when R = 0 and Emax = 100 – R).
The drug distribution profile (PTX‐Road) was analyzed using a nonlinear regression method to calculate the distribution half‐life, T1/2‐max or T1/2‐avg (time required for the maximum or average fluorescence intensity across the MCL to decrease to its half level) and the distribution half‐depth, D1/2 (distance required for the fluorescence intensity to drop to half its maximum level).
Statistical analysis. Data are presented as the mean ± SEM. The Student's t‐test was used to test the statistical significance of the data using SPSS for windows, ver. 8.0.0., where P < 0.05 was considered statistically significant.
Results
Distribution of calcein‐AM in multilayers of DLD‐1 cells. The MCL and stacks of DLD‐1 cells were stained with calcein and representative images of optical sections taken along the z‐axis through the layers of cells (Fig. 1b,c). Mean field intensity increased with depth, reaching the maximum intensity at 10–20 µm from the surface, and then decreasing to undetectable levels. Mean field intensity decreased with a steeper slope in the MCL than the stacked cells and could not be detected deeper than 40 µm from the surface (Fig. 1d). Stacked layers of cells stained homogenously with calcein also showed a gradual decrease in fluorescence intensity across the entire stack (~110 µm depth, Fig. 1d), indicating attenuation of fluorescence from the calcein within the layers of cells. The more radical decrease in fluorescence observed in the MCL indicated that the photonic attenuation of the fluorescence signal may be influenced by the limited penetration of the calcein‐AM.
Distribution of calcein‐AM in the MCL. To address the photonic attenuation problem, frozen sections of MCL were used to compare the distribution of calcein‐AM in the deep layers of MCL. Calcein‐AM penetrated nearly the entire HT‐29 MCL (Fig. 2b) with a gradual decrease in intensity in the bottom layers, as indicated by the fluorescence signal decreasing to half of its maximum value in the lower 20% of the MCL (Fig. 2e). A similar profile of calcein distribution was observed in the MCL of J‐82 (Fig. 2d); calcein‐AM penetrated the entire J‐82 MCL with a gradual decrease in intensity in the bottom layers (Fig. 2E). Conversely, the calcein fluorescence signal decreased to half of its maximum value in the lower 60% of the MCL of DLD‐1 and HT‐1376 cells, indicating the presence of a penetration barrier to the vital dye (Fig. 2g,i,j). The minimum fluorescent signal in the lower 20% of the HT‐29 or J‐82 MCL had a fluorescence intensity twofold greater than that of the DLD‐1 and HT‐1376 MCL, indicating greater penetration and accumulation of calcein‐AM in HT‐29 and J‐82 MCL (Fig. 2e,j).
Figure 2.
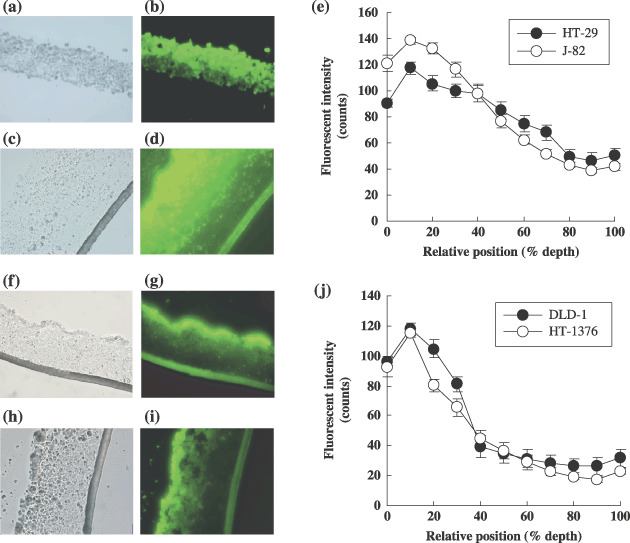
Calcein‐AM distribution in frozen section of MCL of HT‐29 (b), J‐82 (d), DLD‐1 (g) and HT‐1376 (i) with corresponding phase contrast images (a,c,f,h). Fluorescent intensity for HT‐29 and J‐82 and for DLD‐1 and HT‐1376 are shown in (e) and (j), respectively. MCL were snap‐frozen immediately after exposure to calcein‐AM (20 µM) for 45 min at 4°C followed by 15 min at 37°C. Fluorescence intensity was obtained at least four measurements per each section of three MCL. Data are expressed as mean ± SE (n = 12).
The fluorescence profiles showed a plateau at the lower 20% depth with intensity near the cut‐off value (40 counts) in HT‐29 and J‐82 MCL or the contrary significantly lower than the cut‐off value was obtained at the lower 60% depth in DLD‐1 and HT‐1376 MCL (Fig. 2e,j). Accordingly, the top 80% or 40% were set as the vitality assessable range in the MCL of HT‐29 and J‐82, or DLD‐1 and HT‐1376, respectively.
Reduced vitality in the MCL following paclitaxel exposure. The fluorescence intensity of calcein was measured in the frozen section of the MCL after PTX exposure (100 µM for 96 h) and compared with the non‐treated samples. In the HT‐29 and J‐82 MCL, a significant reduction in fluorescence (vitality) was observed across more than 80% of the depth of both MCL (Fig. 3a,b,g,h). The degree of vitality deterioration was assessable in all but the lower 20% of the MCL and was estimated to range 40–80% and 25–40% in the HT‐29 and J‐82 MCL, respectively (P < 0.05, Fig. 3c,i). Conversely, the DLD‐1 and HT‐1376 MCL showed a partial reduction in fluorescent intensity following PTX treatment (Fig. 3d,e,j,k). Only 20–40% vitality deterioration was observed in the upper 10% in DLD‐1 (P < 0.05, Fig. 3f), and a 15–25% decrease in vitality in the upper 30% (P < 0.05, Fig. 3l) in HT‐1376 MCL. These data indicate that DLD‐1 and HT‐1376 cells have significant resistance to PTX when grown as MCL compared to HT‐29 and J‐82.
Figure 3.
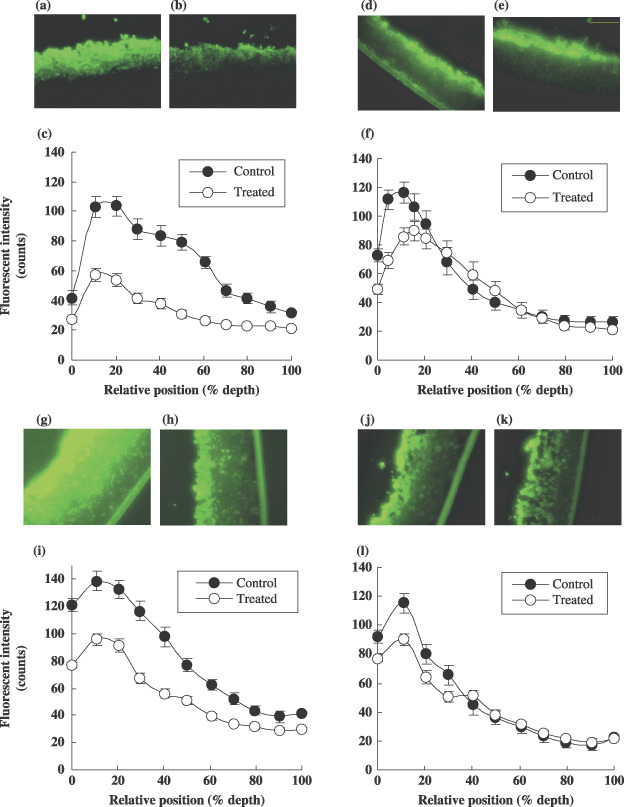
Changes in fluorescent intensity of calcein in MCL derived from HT‐29 (a,b), DLD‐1 (d,e), J‐82 (g,h) and HT‐1376 (j,k) without or with exposure to paclitaxel (PTX), respectively. After 6 days of cultures, MCL were exposed to 100 µM PTX for 96 h and then subjected to calcein‐AM staining. The fluorescent images of frozen sections were obtained and analyzed using Opimas ver. 6.5 as described in Materials and Methods. The levels of fluorescence as a function of relative depth are compared between control () and treated () in HT‐29 (c), DLD‐1 (f), J‐82 (i) and HT‐1376 (l). Data are expressed as mean ± SE (n = 12).
The inherent sensitivity of both HT‐29 and DLD‐1 cell lines to PTX was examined using the same vitality dye (calcein‐AM) in monolayer cultures (Fig. 4). The IC50 of PTX was 25‐fold lower in HT‐29 cells than DLD‐1 cells (3.7 ± 0.3 and 93.9 ± 18 nM, respectively, P < 0.05), indicating that HT‐29 had a significantly greater sensitivity to PTX than DLD‐1. Similar results were obtained using two other cytotoxicity assays (sulforhodamine B and MTS assays, data not shown).
Figure 4.
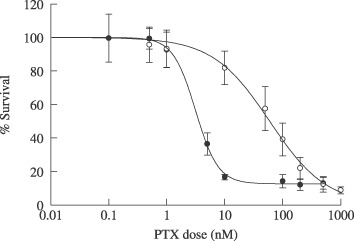
Dose–response curve of PTX in monolayer culture of HT‐29 () and DLD‐1 () cells. Cells were exposed to PTX for 72 h. Cell viability was determined using calcein‐AM and Data are expressed as mean ± SD (n = 3).
Distribution of PTX‐Road within the MCL of HT‐29 and DLD‐1 cells. Rhodamine‐labeled PTX (PTX‐Road) was used to study distribution and penetration within the MCL. Upon exposure to PTX‐Road (100 µM), the penetration pattern and distribution kinetics within the MCL was determined (Fig. 5). PTX‐Road showed gradual accumulation with time in the upper layers of the HT‐29 and DLD‐1 MCL reaching a maximum level at 6 and 24 h, respectively. After 24 h, the fluorescence intensity began to decline in both MCL. The HT‐29 MCL showed redistribution of the drug within the layers and a significant level of fluorescence was maintained even after 96 h when compared to the DLD‐1 MCL. These data indicate that HT‐29 cells grown as MCL exhibited less penetration barrier and greater binding retention of PTX.
Figure 5.
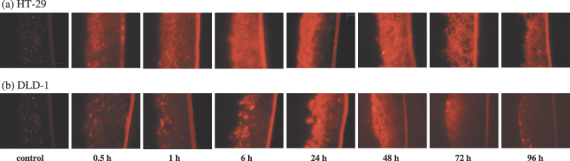
Penetration and accumulation profile of paclitaxel‐rhodamine (PTX‐Road) within the MCL of HT‐29 (a) and DLD‐1 (b) cells. MCL were exposed to 100 µM of PTX‐Road until 96 h and snap‐frozen immediately after drug exposure. Twenty µm sections were made and PTX‐Road distribution was examined by inverted fluorescent microscope.
Fluorescence intensity was analyzed as a function of percent distance from the surface across the entire depth of the MCL, and maximum intensity (F max) and average intensity (F avg) were plotted as a function of exposure time (Fig. 6a,b). The F max of PTX‐Road was observed at 6 and 24 h in the HT‐29 MCL and DLD‐1 MCL, respectively (Fig. 6a). Also, as shown in Figure 5, both the F max and F avg of PTX‐Road was 2–5‐fold greater in the HT‐29 MCL than the DLD‐1 MCL over all exposure times examined (Fig. 6a,b). The F max and F avg of PTX‐Road in the HT‐29 MCL were sustained for 96 h whereas they were sustained for only 24 h in the DLD‐1 MCL (Fig. 6a,b). The distribution half‐life (T1/2) for F avg was approximately 445 ± 56.9 and 60.8 ± 4.6 h in the HT‐29 and DLD‐1 MCL, respectively (Table 1), indicating that elimination of PTX‐Road from the DLD‐1 MCL occurred 7.3‐fold more rapidly than that of the HT‐29 MCL. Similar results were observed for F max, which showed a sixfold difference between the HT‐29 and DLD‐1 MCL. The fluorescence distribution within MCL was compared between the HT‐29 and DLD‐1 MCL after 24 h exposure to PTX‐Road. After 24 h of exposure, PTX‐Road accumulated in the upper 50% of the HT‐29 MCL (Fig. 6c). In the DLD‐1 MCL, PTX‐Road accumulated to the same level, but the accumulation was limited to the upper 10% of the MCL and it decreased rapidly with depth below this region. The distribution half‐depth (D1/2, the distance required for the PTX‐Road level to drop to half its F max) was estimated as 53.6 ± 5.5% (102 ± 10.5 µm) and 23.4 ± 2.8% (44.5 ± 5.3 µm) in the HT‐29 MCL and DLD‐1 MCL, respectively (Table 1), indicating a 2.3‐fold difference in distribution into the deep layers. These data suggest that a significant penetration barrier and poor distribution of PTX‐Road exists within the DLD‐1 MCL compared to the MCL comprised of HT‐29 cells.
Figure 6.
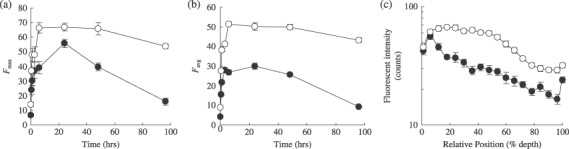
Distribution kinetics of PTX‐Road in MCL of HT‐29 () and DLD‐1 () cells. MCL were treated with 100 µM of PTX‐Road until 96 h. Maximum (a) and average (b) fluorescence intensities of PTX‐Road were obtained from several representative morphometric lines across MCL and plotted as a function of exposure time. Spatial distribution profile of PTX‐Road within MCL after 24 h exposure (c).
Table 1.
Pharmacokinetic (PK) parameters of in vitro tissue penetration and distribution of paclitaxel‐rhodamine (PTX‐Road) in multicellular layers (MCL) model
| Parameter | DLD‐1 | HT‐29 |
|---|---|---|
| T1/2‐max (h) | 67.3 ± 3.9 | 404 ± 54.8 |
| T1/2‐average (h) | 60.8 ± 4.6 | 445 ± 56.9 |
| D1/2 (%) | 23.4 ± 2.8 | 53.6 ± 5.5 |
T1/2‐max, time needed for the maximum concentration within MCL to decrease to its half level; T1/2‐average, time needed for the average concentration across the MCL to decrease to its half level; D1/2, distance required for the drug concentration to drop to its half maximum concentration.
Discussion
Poor penetration of a drug within the avascular region of solid tumors has been shown to dramatically influence its cytotoxic effect.( 1 ) Conventional PK studies to determine tissue distribution of anticancer drugs using animal models usually provide the average drug concentration in the tumor tissue. This average drug concentration includes the amount of the drug in blood within the tissue as well as the concentration of drug in the peripheral region of the tumor close to the blood vessel following extravasation. Due to limited diffusion or convectional movement of a drug in a solid tumor, the actual concentration within the tumor avascular regions, especially in regions distant from blood vessels, needs to be considered when determining antitumor effect or the PK‐PD relationship.( 30 ) The spatial mapping of extravascular distribution and drug‐induced cytotoxic effect will provide a clinically relevant PK‐PD relationship, which may explain the underlying mechanism of MCR in a 3D context of solid tumors. Mathematical modeling to determine the PK‐PD relationship can provide similar information,( 31 ) however, it is rather complex and comprehensive to limit the general understanding and broader applications. In this study, we provide a simple experimental method that can be used for PK‐PD mapping of a drug within the avascular regions represented by MCL of human cancer cell lines.
The BrdU labeling index has been used to correlate the antiproliferative effect of four different anthracyclines based on their spatial distribution within multicellular layers of HCT‐116 cells.( 13 ) We measured cellular vitality with a widely used fluorescent vitality probe, calcein‐AM, in a simple yet quantitative manner. Photonic attenuation of the fluorescence of calcein in 3D cultures may compromise its use as a quantitative vitality probe unless mathematical correction is adopted.( 20 ) In addition to the variation in fluorescence attenuation between cell lines, a significant deviation has also been observed at layers deeper than 200 µm in MCS cultures of MCF‐7 cells.( 20 ) Our data also showed that photonic attenuation within an MCL of DLD‐1 cells could be significant at layers as shallow as 60 µm; that is, 50% attenuation occurred at 60 µm in a stack of DLD‐1 cells (Fig. 1b,d). Despite the photonic attenuation, vitality changes could be monitored at depths up to 80–100 µm as long as the vital dye penetration was not limited. The vitality probe, however, showed limited penetration depending on the cell lines (Fig. 2), which indicates that optical sectioning may not be suitable for MCL of some cell lines such as DLD‐1.
The fluorescence measured in the frozen section of MCL demonstrated that vitality changes could be evaluated in MCL of all four cell lines, although the evaluable layers may be limited to the upper 40% of the MCL in the case of DLD‐1 and HT‐1376 cells, whereas the upper 80% (at least) of the HT‐29 and J‐82 MCL could be measured (Fig. 2e,j). We were able to determine the changes in fluorescence intensity in the MCL of HT‐29 and DLD‐1 cells following PTX exposure. The vitality of HT‐29 cells decreased by 40–80% over the entire assessable depth of the MCL in response to PTX treatment, whereas a less than 40% reduction was observed in the upper 20% of the MCL comprised of DLD‐1 cells after PTX treatment. The lack of changes in vitality beyond the upper 20% of the DLD‐1 MCL (Fig. 3) may have been due to the drug concentration being lower than the effective concentration in these layers. These results can be attributed to the lower PTX sensitivity of DLD‐1 cells (Fig. 4) as well as to the limited drug accumulation in the regions as subsequently examined (Fig. 6c).
The majority of chemotherapeutic agents show differential sensitivity between monolayer and 3D cultures.( 7 , 17 , 18 ) In the present study, both DLD‐1 and HT‐29 cells showed reduced sensitivity to PTX under 3D culture conditions. For example, only a 54% decrease in average vitality was observed in the MCL of HT‐29 cells when exposed to 100 µM of PTX for 96 h (Fig. 3c), whereas the IC50,72 h in the monolayer culture was 3.7 nM (Fig. 4). In order to further investigate the change in the degree of sensitivity as a result of culture conditions and other attributing factors, the drug concentration in cells grown under different culture conditions needs to be determined. Additionally, it should be determined if drug distribution/uptake can explain the difference in sensitivity, or if cellular sensitivity changes should be considered as an additional factor in the 3D context.
We also evaluated avascular transport of PTX using the fluorescent derivative PTX‐Road. PTX‐Road and other fluorescent derivatives have been reported to have physicochemical and biological properties similar to those of the parent PTX,( 32 ) indicating that these fluorescent derivatives are suitable for pharmacokinetic (penetration) studies as well as efficacy evaluation.( 24 , 33 )
The parameters of penetration and accumulation kinetics of PTX‐Road obtained using line morphometric analysis indicated rapid uptake (earlier F max) and greater accumulation (higher F max and F avg, see Fig. 6a,b) in the HT‐29 MCL than the DLD‐1 MCL. It is noted that DLD‐1 formed compact a structure compared to HT‐29. Hence, the number of cells in unit area on MCL sections was significantly higher in DLD‐1 (Fig. 7), which may have caused a barrier for penetration and accumulation of PTX.( 34 ) The time required for the maximum and average concentration to decrease to half of its level (T1/2,max and T1/2,avg) was found to be 6–7‐fold longer in HT‐29 cells than in DLD‐1 cells (Table 1), suggesting that drug retention was greater in the layers of HT‐29 cells. In addition, HT‐29 cells showed greater penetration/distribution of PTX‐Road, as indicated by the twofold higher D1/2‐value compared to that of DLD‐1 cells (Table 1). Neither significant change in the thickness nor gross structural deterioration in either MCL was observed upon PTX exposure except for HT‐29 after 96‐h exposure (Fig. 7).
Figure 7.
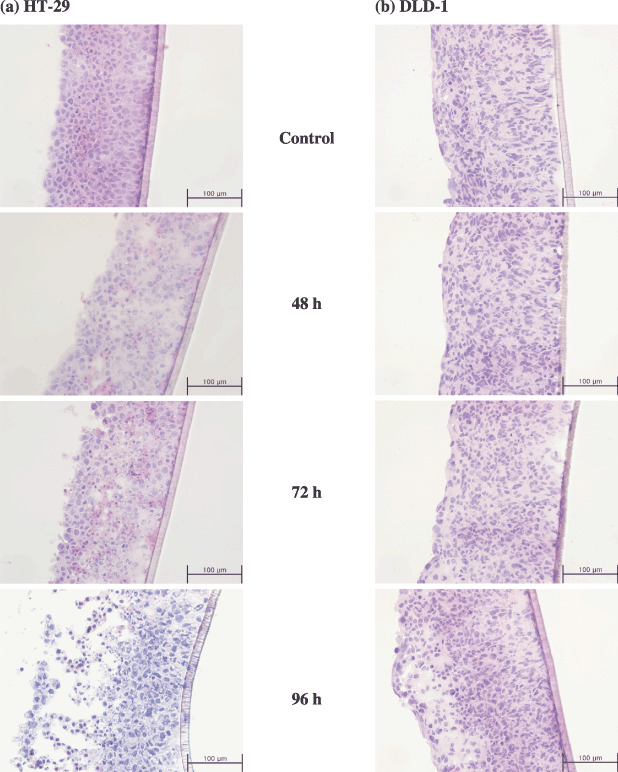
Histological section of MCL derived from HT‐29 (a) and DLD‐1 (b) when treated with 100 µM of PTX until 96 h. Routine 7‐µm frozen sections were made and stained with HE for gross structural examination.
It should be noted that DLD‐1 cells grown as MCL showed greater resistance to PTX than that of HT‐29 cells, especially in the upper 20–40% cell layers of the MCL (Fig. 3c,f). The pattern of antiproliferative activity (reduction in fluorescence intensity) across the MCL depth resembles the distribution profile of the drug at 24 h for both HT‐29 and DLD‐1 MCL (3, 6). Despite the inherent sensitivity of HT‐29 compared to DLD‐1, these results suggest that drug penetration may be one of the major factors involved in apparent chemosensitivity in the multilayer structure of human solid tumors. Greater penetration and longer drug residence may result in higher drug concentration within MCL, inducing greater cell kill or growth inhibition. Studies conducted by Grantab et al. also have shown that the apparent sensitivity of two HCT‐8 sub‐lines in MCL is determined by drug penetration, not by the inherent sensitivity of the sub‐lines in monolayer.( 34 ) As shown for HCT‐8 sub‐lines, better penetration of PTX within the MCL of HT‐29 can be attributed to the lesser cell packing density (Fig. 7).
Several studies have reported the effect‐limiting penetration of PTX in both histoculture and the MCL model.( 6 , 7 ) The presence of a significant penetration barrier to PTX has been shown in MCL of DLD‐1 cells,( 7 ) and the expression of P‐gp has been reported as a limiting factor in the penetration of BODIPY‐taxol (fluorescent labeled taxol) in MCS culture of MCF‐7 cells.( 24 ) However, the tissue penetration of agents was shown to be determined strongly by physicochemical properties of the individual compounds.( 24 ) Tissue penetration of PTX was retarded by intensive binding in outer cell layers of tissues,( 23 ) and intracellular accumulation of PTX was attributed to intensive binding to cellular proteins such as microtubules.( 25 ) Tissue penetration of calcein‐AM was significantly limited in MCL derived from DLD‐1 and HT‐1376 (Fig. 2g,i,j). A similar penetration barrier was reported in tumor spheroid derived from MCF‐7 cells, which was attributed to extensive sequestration in the peripheral layers.( 24 )
A penetration and distribution barrier has also been suggested as a potential cause of resistance in solid tumors for other drugs.( 2 , 3 ) Endosomal pH and sequestration significantly influenced the penetration of alkaline drugs such as doxorubicin.( 35 ) The acidic pH and hypoxia of the deep layers of solid tumors caused limited penetration of drugs such as methotrexate, tirapazamine and topoisomerase poisons.( 5 , 15 , 36 ) In addition, cell concentration, cellular adhesion and packing density were found to influence drug penetration, resulting in reduced therapeutic efficacy of anticancer drugs.( 34 , 37 ) It should be noted, however, that the in situ evaluation of the relationship between drug penetration/distribution and effect has not been assessed.
In this study, a distribution profile of calcein fluorescence on a frozen section of MCL was successfully used for in situ evaluation of the antiproliferative activity of PTX. The pharmacokinetics of PTX in the avascular region of tumor tissue was examined using a fluorescent‐labeled drug. We demonstrated that tissue penetration of PTX was significantly different depending on cell lines and concluded that limited penetration of PTX may be an important factor affecting differential activity against human solid tumors. Although calcein‐AM only showed partial penetration in MCL of DLD‐1 and HT‐1376 cells, calcein‐AM in conjunction with MCL cultures should provide a useful tool to study the 3D drug concentration–effect relationship in in vitro solid tumor models when drug distribution can be determined simultaneously.
Acknowledgments
This work was supported by a grant from the Ministry of Science and Technology (F104AA010007‐06A0101‐00710) and the Korea Research Foundation Grant funded by the Korean Government (MOEHRD, Basic Research Promotion Fund) (KRF‐2006‐002022), Korea.
References
- 1. Minchinton AI, Tannock IF. Drug penetration in solid tumours. Nat Rev Cancer 2006; 6: 583–92. [DOI] [PubMed] [Google Scholar]
- 2. Tannock IF, Lee CM, Tunggal JK, Cowan DS, Egorin MJ. Limited penetration of anticancer drugs through tumor tissue: a potential cause of resistance of solid tumors to chemotherapy. Clin Cancer Res 2002; 8: 878–84. [PubMed] [Google Scholar]
- 3. Tunggal JK, Cowan DS, Shaikh H, Tannock IF. Penetration of anticancer drugs through solid tissue: a factor that limits the effectiveness of chemotherapy for solid tumors. Clin Cancer Res 1999; 5: 1583–6. [PubMed] [Google Scholar]
- 4. Zheng JH, Chen CT, Au JL, Wientjes MG. Time‐ and concentration‐dependent penetration of doxorubicin in prostate tumors. AAPS Pharmsci 2001; 3: E15. [DOI] [PMC free article] [PubMed] [Google Scholar]
- 5. Hicks KO, Pruijn FB, Baguley BC, Wilson WR. Extravascular transport of the DNA intercalator and topoisomerase poison N‐[2‐(Dimethylamino) ethyl]acridine‐4‐carboxamide (DACA): diffusion and metabolism in multicellular layers of tumor cells. J Pharmacol Exp Ther 2001; 297: 1088–98. [PubMed] [Google Scholar]
- 6. Jang SH, Wientjes MG, Au JL. Determinants of paclitaxel uptake, accumulation and retention in solid tumors. Invest New Drugs 2001; 19: 113–23. [DOI] [PubMed] [Google Scholar]
- 7. Nicholson KM, Bibby MC, Phillips RM. Influence of drug exposure parameters on the activity of paclitaxel in multicellular spheroids. Eur J Cancer 1997; 33: 1291–8. [DOI] [PubMed] [Google Scholar]
- 8. Desoize B. Contribution of three‐dimensional culture to cancer research. Crit Rev Oncol Hematol 2000; 36: 59–60. [DOI] [PubMed] [Google Scholar]
- 9. Santini MT, Rainaldi G, Indovina PL. Apoptosis, cell adhesion and the extracellular matrix in the three‐dimensional growth of multicellular tumor spheroids. Crit Rev Oncol Hematol 2000; 36: 75–87. [DOI] [PubMed] [Google Scholar]
- 10. Bates RC, Edwards NS, Yates JD. Spheroids and cell survival. Crit Rev Oncol Hematol 2000; 36: 61–74. [DOI] [PubMed] [Google Scholar]
- 11. Baguley BC, Marshall ES. In vitro modelling of human tumour behaviour in drug discovery programmes. Eur J Cancer 2004; 40: 794–801. [DOI] [PubMed] [Google Scholar]
- 12. Phillips RM, Loadman PM, Cronin BP. Evaluation of a novel in vitro assay for assessing drug penetration into avascular regions of tumours. Br J Cancer 1998; 77: 2112–19. [DOI] [PMC free article] [PubMed] [Google Scholar]
- 13. Kyle AH, Huxham LA, Chiam AS, Sim DH, Minchinton AI. Direct assessment of drug penetration into tissue using a novel application of three‐dimensional cell culture. Cancer Res 2004; 64: 6304–9. [DOI] [PubMed] [Google Scholar]
- 14. Cowan DS, Hicks KO, Wilson WR. Multicellular membranes as an in vitro model for extravascular diffusion in tumours. Br J Cancer Suppl 1996; 27: S28–31. [PMC free article] [PubMed] [Google Scholar]
- 15. Hicks KO, Pruijn FB, Sturman JR, Denny WA, Wilson WR. Multicellular resistance to tirapazamine is due to restricted extravascular transport: a pharmacokinetic/pharmacodynamic study in HT29 multicellular layer cultures. Cancer Res 2003; 63: 5970–7. [PubMed] [Google Scholar]
- 16. AL‐Abd AM, Lee JH, Kuh HJ. Simultaneous evaluation of cellular vitality and drug penetration in multicellular layers of human cancer cells. J Korean Pharmaceut Sci 2006; 36: 309–14. [Google Scholar]
- 17. Lee SH, AL‐Abd AM, Park JK, Cha JH, Kuh HJ. Pharmacodynamics of CKD‐602 (Belotecan) in 3D cultures of human colorectal carcinoma cells. J Appl Pharmacol 2006; 14: 119–24. [Google Scholar]
- 18. Hall MD, Martin C, Ferguson DJ, Phillips RM, Hambley TW, Callaghan R. Comparative efficacy of novel platinum (IV) compounds with established chemotherapeutic drugs in solid tumour models. Biochem Pharmacol 2004; 67: 17–30. [DOI] [PubMed] [Google Scholar]
- 19. Frankel A, Buckman R, Kerbel RS. Abrogation of taxol‐induced G2‐M arrest and apoptosis in human ovarian cancer cells grown as multicellular tumor spheroids. Cancer Res 1997; 57: 2388–93. [PubMed] [Google Scholar]
- 20. Wartenberg M, Acker H. Quantitative recording of vitality patterns in living multicellular spheroids by confocal microscopy. Micron 1995; 26: 395–404. [DOI] [PubMed] [Google Scholar]
- 21. Wartenberg M, Hescheler J, Acker H, Diedershagen H, Sauer H. Doxorubicin distribution in multicellular prostate cancer spheroids evaluated by confocal laser scanning microscopy and the ‘optical probe technique’. Cytometry 1998; 31: 137–45. [DOI] [PubMed] [Google Scholar]
- 22. Rowinsky EK. Clinical pharmacology of Taxol. J Natl Cancer Inst Monogr 1993; 15: 25–37. [PubMed] [Google Scholar]
- 23. Kuh HJ, Jang SH, Wientjes MG, Weaver JR, Au JL. Determinants of paclitaxel penetration and accumulation in human solid tumor. J Pharmacol Exp Ther 1999; 290: 871–80. [PubMed] [Google Scholar]
- 24. Martin C, Walker J, Rothnie A, Callaghan R. The expression of P‐glycoprotein does influence the distribution of novel fluorescent compounds in solid tumour models. Br J Cancer 2003; 89: 1581–9. [DOI] [PMC free article] [PubMed] [Google Scholar]
- 25. Kuh HJ, Jang SH, Wientjes MG, Au JL. Computational model of intracellular pharmacokinetics of paclitaxel. J Pharmacol Exp Ther 2000; 293: 761–70. [PubMed] [Google Scholar]
- 26. Jang SH, Wientjes MG, Au JL. Interdependent effect of P‐glycoprotein‐mediated drug efflux and intracellular drug binding on intracellular paclitaxel pharmacokinetics: application of computational modeling. J Pharmacol Exp Ther 2003; 304: 773–80. [DOI] [PubMed] [Google Scholar]
- 27. Swanton C, Tomlinson I, Downward J. Chromosomal instability, colorectal cancer and taxane resistance. Cell Cycle 2006; 5: 818–23. [DOI] [PubMed] [Google Scholar]
- 28. Evangelio JA, Abal M, Barasoain I et al . Fluorescent taxoids as probes of the microtubule cytoskeleton. Cell Motil Cytoskeleton 1998; 39: 73–90. [DOI] [PubMed] [Google Scholar]
- 29. Yazawa K, Tsuno NH, Kitayama J et al . Selective inhibition of cyclooxygenase‐2 inhibits colon cancer cell adhesion to extracellular matrix by decreased expression of beta1 integrin. Cancer Sci 2005; 96: 93–9. [DOI] [PMC free article] [PubMed] [Google Scholar]
- 30. Lu D, Wientjes MG, Lu Z, Au JL. Tumor priming enhances delivery and efficacy of nanomedicines. J Pharmacol Exp Ther 2007; 322: 80–8. [DOI] [PubMed] [Google Scholar]
- 31. Modok S, Hyde P, Mellor HR, Roose T, Callaghan R. Diffusivity and distribution of vinblastine in three‐dimensional tumour tissue: experimental and mathematical modelling. Eur J Cancer 2006; 42: 2404–13. [DOI] [PubMed] [Google Scholar]
- 32. Guy R, Scott Z, Sloboda R, Nicolaou K. Fluorescent taxoids. Chem Biol 1996; 3: 1021–31. [DOI] [PubMed] [Google Scholar]
- 33. Baloglu E, Kingston DG, Patel P, Chatterjee SK, Bane SL. Synthesis and microtubule binding of fluorescent paclitaxel derivatives. Bioorg Med Chem Lett 2001; 11: 2249–52. [DOI] [PubMed] [Google Scholar]
- 34. Grantab R, Sivananthan S, Tannock IF. The penetration of anticancer drugs through tumor tissue as a function of cellular adhesion and packing density of tumor cells. Cancer Res 2006; 66: 1033–9. [DOI] [PubMed] [Google Scholar]
- 35. Lee CM, Tannock IF. Inhibition of endosomal sequestration of basic anticancer drugs: influence on cytotoxicity and tissue penetration. Br J Cancer 2006; 94: 863–9. [DOI] [PMC free article] [PubMed] [Google Scholar]
- 36. Cowan DS, Tannock IF. Factors that influence the penetration of methotrexate through solid tissue. Int J Cancer 2001; 91: 120–5. [DOI] [PubMed] [Google Scholar]
- 37. Tunggal JK, Ballinger JR, Tannock IF. Influence of cell concentration in limiting the therapeutic benefit of P‐glycoprotein reversal agents. Int J Cancer 1999; 81: 741–7. [DOI] [PubMed] [Google Scholar]