Abstract
Monitoring p53 transcriptional activity to identify genotoxic damages induced by drugs has been proposed and validated in vitro. However, this methodology is by design limited to the cell line tested. In this study, we have fully validated a luciferase‐based p53‐reporter system in vitro and in vivo. We generated a mouse transgenic line to monitor non‐invasively p53 activation in response to chemically induced DNA damage. Doxorubicin was used as a drug of known toxicity to validate our model. Reporter gene expression was measured using bioluminescence imaging. In females, a weak p53 luciferase activity driven by a p53‐responsive promoter was detectable in the oral cavity region after doxorubicin treatment. In males, the signal increased in the lower abdominal region. Imaging of various organs revealed that the luciferase activity was mainly generated from the testes. Immunohistology demonstrated that the cells in the seminiferous tubules were damaged by the drug and confirmed that they were luciferase and p53 positive. Therefore, these transgenic mice could provide a powerful tool to predict, map and characterize at the organ and cellular levels the toxicity of compounds and help to develop new therapeutic agents in humans. (Cancer Sci 2008; 99: 683–688)
Exposure to certain chemicals is associated with the development of specific human cancers.( 1 , 2 ) The methods used to identify human carcinogens involve in vitro tests such as mutagenesis in Salmonella, but the generally accepted definitive method of classification remains in vivo animal testing. Stimulated by a general interest in replacing these large‐scale toxicological studies on animals, new in vitro tests based on the knowledge that has been accumulated over the last decade in molecular and cell biology are emerging. A promising strategy exploits p53.
The tumor suppressor p53 is normally kept at a low cellular level through its interaction with Murine double minute protein.( 3 ) However, various cellular stresses including chemically induced DNA damage, lead to p53 stabilization and activation.( 4 , 5 ) As a result, p53 modulates the expression of numerous target genes implicated in the regulation of the cellular cycle and apoptosis, through its interaction with specific DNA binding sites located within the promoters of these genes.( 6 , 7 ) The detection of a p53 response has been proposed as a survey for genotoxins and potentially useful anticancer agents.( 8 , 9 , 10 ) A reporter system using a p53 responsive promoter has been previously developed as an indicator of genotoxic damage in vitro.( 11 ) However, in vivo, p53 action is tissue‐specific.( 12 , 13 ) Understanding its function generally requires invasive processes, the analysis relying on fixed tissue samples.( 14 , 15 , 16 ) Thus a transgenic mouse model to visualize gene expression non‐invasively on a whole body scale is of great interest.
In the current study, we have generated a new p53‐responsive transgenic line to map p53 activation in response to chemically induced DNA damage. Such a model could provide unique information on the potential toxicity of new compounds and help to characterize specific tissue(s) and/or cell‐types responding to a particular drug. Using bioluminescence imaging, we visualize p53 activation in response to doxorubicin and characterize the site of p53 activation by immunohistochemistry.
Materials and Methods
Cells, plasmids and transfection. Colon carcinoma cells HCT116 p53−/– and p53+/+ were kindly provided by Pr. B. Vogelstein (Department of Pathology, Johns Hopkins Medical Institution, Baltimore, USA). Cells were grown in Dulbecco's modified Eagle's medium supplemented with 10% Fetal Calf Serum and were transfected using Lipofectamine 2000 (Invitrogen) with a plasmid containing a p53 reporter system previously described,( 17 ) in which four copies of a p53‐responsive element (p53RE) were cloned upstream of a minimal promoter. The resulting promoter is driving the expression of the Firefly Luciferase (Luc) cDNA. The transfected cells are noted HCT116‐p53RE‐Luc thereafter. To obtain stably transfected cells, HCT116 were cotransfected with an empty vector containing a Puromycin resistance gene and grown according to manufacturer's instructions. Resistant populations were selected to perform the in vitro experiments and to establish tumor xenografts in vivo.
Biochemical assays. HCT116 were seeded at a density of 3.5 × 10⁴ cells/cm2 in Dulbecco's modified Eagle's medium supplemented with 10% fetal calf serum and incubated for 24 h in medium containing 0–0.5 µM doxorubicin (Sigma‐Aldrich). Cell viability was assessed using a tetrazolium salt (MTT) based assay as previously described,( 18 ) and total proteins were quantified using the bicinchoninic acid (BCA) method (BCA Protein Assay, Pierce, Rockford, IL, USA). For Western blot analysis, cells were harvested with a scraper after being washed with ice‐cold phosphate buffer saline (PBS) and lyzed in RIPA (1% NP40, 0.5% NaDeoxycolate, 0.1% SDS, protease inhibitor). Samples were fractioned in a Tris‐HCl buffered 4–12% gradient polyacrylamide gel (Bio‐Rad, Hercules, CA, USA) and blotted to nitrocellulose membranes as previously described.( 19 ) The membranes were probed for p53 (DO‐1, Santa Cruz Biotechnology, USA), Ser15‐phosphorylated p53 (Calbiochem, EMD Biosciences, La Jolla, CA, USA) or Ku70 (C‐19, Santa Cruz Biotechnology, USA) and then probed with secondary antibodies conjugated with horseradish peroxydase (Dako, Denmark) and visualized using chemiluminescence (ECL, GE Healthcare, UK). Finally, a luciferase assay was performed using a Promega kit following manufacturer's instruction. HCT116‐p53RE‐Luc lysates were analyzed for luciferase activity using a luminometer (Luminoskan Ascent, Thermo Labsystems).
Infections with adenoviruses. HCT116‐p53RE‐Luc cells were infected with recombinant replication incompetent adenoviruses expressing either the Green Fluorescent Protein (Ad‐GFP) or p53 (Ad5‐CMV‐p53) at a multiplicity of infection of 50. A luciferase assay was performed 24 h later.
Animal experiments. Experiments were conducted after appropriate ethical approval and licensing was obtained in accordance with the United Kingdom ‘Guidance on the operation of animals (Scientific Procedure) Act 1986’ (HMSO, London, United Kingdom, 1990).
Generation of s.c. tumor xenografts in nude mice. BALB/c nude mice were obtained from Harlan (Oxfordshire, United Kingdom) and kept in a germ‐free environment with irradiated food and acidified water ad libitum. HCT116‐p53RE‐Luc wild type and p53−/– suspension (2 × 10⁶ cells in 100 µL) in normal saline was injected subcutaneously in the left flank (p53+/+) and the right flank (p53−/–). Tumor‐bearing animals were then scanned using bioluminescence imaging 24 h prior and 24 h after receiving an intraperitoneal injection of 1.5 mg/kg doxorubicin.
Transgenic animals. All animals were kept in a germ‐free environment with irradiated food and acidified water ad libitum. The p53RE‐luciferase construct was used to generate transgenic mice at Cancer Research UK Transgenic Services (Clare Hall Laboratories, UK) on a CBA/F1 background. Transgenic animals were characterized using standard polymerase chain reaction techniques with primers specific for the luciferase transgene (luciferase forward 5′‐TGGATTCTAAAACGGATTACCAGGG‐3′ and reverse 5′‐CCAAAACAACAACGGCGGC‐3′). A total of four distinct founder transgenic lines were obtained and a single founder was selected, which showed transgene expression using bioluminescence imaging (BLI). Animals were between ages 8–12 weeks at the time of experiments.
Bioluminescent imaging. Mice were anesthetized with a 2% Halothane/O2/N2O mixture and given a single intraperitoneal injection of 150 mg/kg D‐Luciferin (Xenogen, Alameda, USA) in 0.2 mL normal saline, in a way that allows homogenous distribution of this substrate.( 20 ) BLI was initiated 10 min after D‐luciferin injection using a Xenogen Ivis Imaging Series 100 system. During image acquisition, halothane anesthesia was maintained by using a nose cone delivery system. Animal body temperature was regulated with a temperature‐controlled stage. A gray‐scale whole body image was collected (field of view: D; exposure, 0.2 second; binning: medium; and f/stop, 16) followed by acquisition and overlay of a pseudo color image representing the spatial distribution of the detected photons emitted from the animal (field of view D; exposure, 300 s; binning, large [high sensitivity] or medium [nude mice]; and f/stop, 1) with all luminescent data recorded as photons per second (total flux). Signal intensity was quantified as the sum of all detected photon counts within uniform‐sized regions of interest that were manually placed during post data acquisition image analysis. To evaluate doxorubicin toxicity, transgenic mice were imaged 24 h before and 24 h after an intraperitoneal injection of doxorubicin (1.5 mg/mL). For analysis of organ‐specific differences in bioluminescence, transgenic animals were killed by cervical dislocation 10 min after D‐luciferin injection and quickly dissected. Individual organs were assessed by BLI and samples were fixed in 4% Formaldehyde.
Immunohistology. Fixed transgenic and non‐transgenic mouse testes were embedded in paraffin. Haematoxylin and Eosin sections were obtained as previously described.( 21 ) Immunohistology analysis was conducted using the automated Ventana Discovery platform (Ventana Discovery Systems, Tuscon, AZ, USA). 4 µm sections were incubated for 30 min in Bovine serum albumin, 1% BSA, 1.5% normal goat serum (Dako, Denmark) and 3% normal donkey serum (Gene Tex, Inc., San Antonio, TX, USA), then incubated for 1 h with an antiluciferase antibody 1:50 (Promega, UK), washed three times with PBS and incubated for 45 min with the secondary antibody 1:500, AlexaFluor 488 donkey antigoat (Invitrogen). p53 was detected by immunohistochemistry using a polyclonal antibody (DO‐1, obtained from Cancer Research UK) at a 1:1000 dilution and revealed by immunoperoxydase staining.
Statistics. All statistical analysis was done using GraphPad Prism (version 3.0c for Macintosh, GraphPad Software, San Diego, CA, USA). Differences between groups with continuous variables were done using student's t‐test (two‐tailed, unequal variances) with a P < 0.05 considered statistically significant.
Results
Doxorubicin reduces cell survival and activates p53 on HCT116 cells in vitro. HCT116 cells were incubated with various doses of doxorubicin. Twenty‐four hours later, cells were subjected to a viability assay (MTT). The results demonstrate that a clear loss of viability is detectable at a concentration above 0.5 µM (data not shown). This toxicity is accompanied by an activation of p53 that shows that doxorubicin treatment significantly increases both phosphorylated p53 (Ser 15) and total p53 expression in a dose‐dependent manner. As expected, no p53 signal is observed in HCT116 p53‐negative cells after doxorubicin treatment (data not shown).
Validation of the p53‐responsive expression cassette in vitro. HCT116‐p53RE‐Luc (either p53+/+ or p53−/–) were incubated with increasing doses of doxorubicin for 24 h. Figure 1a shows a dose dependent increase in luciferase activity on HCT116‐p53RE‐Luc p53+/+, while doxorubicin treatment does not result in increased luciferase expression in HCT116‐p53RE‐Luc p53−/–. In addition, infection of HCT116‐p53RE‐Luc p53−/– with a recombinant adenovirus encoding p53 restored the p53 response (Fig. 1b). Altogether, these results demonstrate that the luciferase activity is strictly dependent on p53 presence and activation in vitro.
Figure 1.
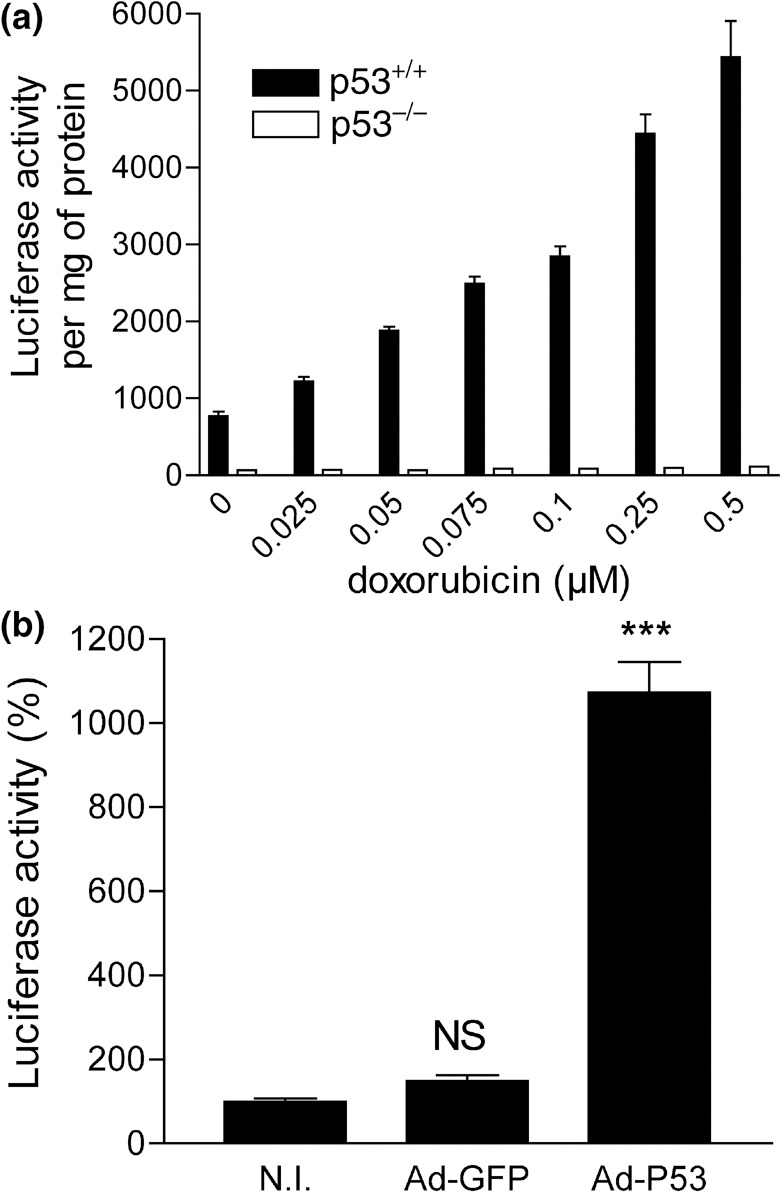
Doxorubicin induces p53‐dependant luciferase expression in HCT116‐p53RE‐Luciferase cells in a dose‐dependant manner. (a) Stably transfected p53+/+ and p53−/– cells were incubated with various doses of doxorubicin and luciferase activity was measured after 24 h. (b) HCT116‐p53RE‐Luciferase p53−/– were infected with either Ad‐CMV‐p53 or Ad‐GFP (control) at a multiplicity of infection of 50. Luciferase expression was determined 24 h later. (NI: non‐infected cells). Columns: averaged luciferase activity (4 wells per condition); bars: standard error of the mean. Luciferase activity in Ad‐CMV‐p53 is compared to the non‐infected cells (P < 0.0001). NS: non‐significant.
Imaging of p53 transcriptional activity in HCT116‐p53RE‐Luc tumor xenografts. To determine the p53‐selectivity of the p53RE‐Luc construct in vivo, HCT116‐p53RE‐Luc p53+/+ and p53−/– were injected subcutaneously in nude mice. Before treatment, both HCT116‐p53RE‐Luc p53+/+ and p53−/– tumors were producing luciferase (Fig. 2a). HCT116‐p53RE‐Luc p53+/+ tumors produced more than five times more luciferase activity than p53−/– control tumors (Fig. 2b). Imaging of the same cohort of mice following an intraperitoneal injection of doxorubicin (1.5 mg/mL) led to a two‐fold (2.136 ± 0.378) increase in luciferase activity in HCT116‐p53RE‐Luc p53+/+ tumors (773 800 ± 115 700 vs 387 200 ± 72 300, P = 0.0103), without significantly affecting the luciferase activity in p53−/– tumors (128 460 ± 35 760 vs 94 900 ± 33 100, P = 0.4207) (Fig. 2).
Figure 2.
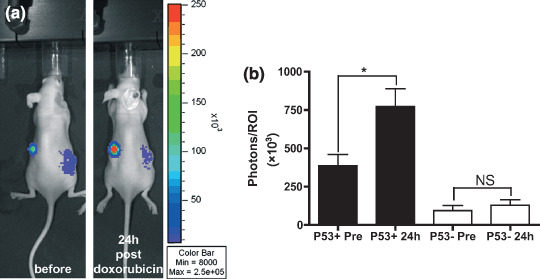
Bioluminescence imaging of p53 induction in HCT116‐p53RE‐Luc tumor‐bearing BALB/c nude mice. Mice bearing a p53+/+ tumor on the left flank and a p53−/– tumor on the right flank were imaged before and 24 h after receiving an intraperitoneal injection of doxorubicin (1.5 mg/kg). (a) Gray‐scale image of a representative mouse overlayed with a pseudo‐color image of bioluminescence. All window and level settings depict a range between 8000 and 250 000 photons/s and are consistent for all images. (b) quantification of bioluminescence on tumor regions of interest (ROI) before and after treatment with doxorubicin. Columns, averaged bioluminescence (n = 5 mice) expressed as total photons flux in the ROI; bars, standard error of the mean. *P = 0.0103; NS: non‐significant (P = 0.4207).
In vivo localization of p53 activation by doxorubicin in p53RE‐Luc transgenic mice. The p53RE‐Luc construct was used to generate transgenic animals. P53RE‐Luc male mice from the resulting line were imaged by BLI before treatment with doxorubicin and showed only a weak and diffuse signal in the lower peritoneal cavity in some animals of the cohort (Fig. 3a). The same animals were imaged 24 h after receiving an intraperitoneal injection of 1.5 mg/kg doxorubicin. The drug induced a strong increase of luciferase activity in the peritoneal region (Fig. 3a). Quantitative analysis showed a 4‐fold increase in luciferase activity in a regions of interest placed over the abdominal region after doxorubicin injection in males (146 900 ± 33 900 vs 40 220 ± 7300, P = 0.0096) (Fig. 3c). By contrast, injection of doxorubicin in females resulted in a non‐statistically significant increase (11 950 ± 4210 vs 6388 ± 1048, P = 0.3284) of luciferase activity in the oral cavity region only (Fig. 3b). These results were obtained on seven males and three female transgenic mice. Qualitatively, the results were identical in all animals.
Figure 3.
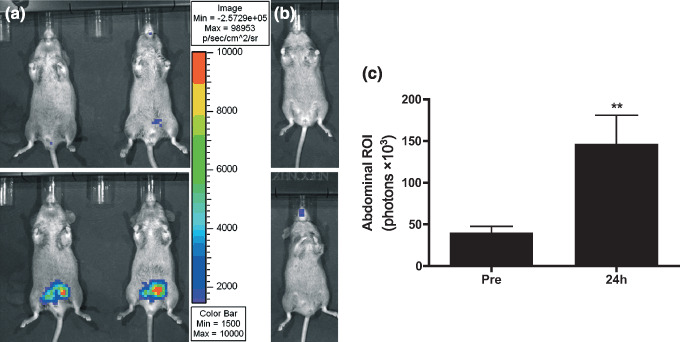
Bioluminescence imaging of p53 induction in p53RE‐Luciferase mice. Mice were imaged before (top) and 24 h after administration of a single intraperitoneal injection of doxorubicin (1.5 mg/kg) (bottom). Gray‐scale image of the mice overlayed with a pseudo‐color image of bioluminescence. All window and level settings depict a range between 1500 and 10 000 photon/s and are consistent for all images. (a) male transgenic mice (n = 7); (b) female transgenic mouse (n = 3); (c) quantification of bioluminescence on abdominal regions of interest (ROI) in males before and after treatment with doxorubicin (P = 0.0096). Columns, averaged bioluminescence expressed as total photons flux in the ROI; bars, standard error of the mean.
Anatomical and histological localization of doxorubicin‐induced p53 activation. To identify the organs responsible for the doxorubicin‐induced increase in luciferase activity, p53RE‐Luc mice were culled and quickly dissected 10 min after receiving an intraperitoneal injection of D‐luciferin. Various organs were positioned in the field of the camera and images were taken. The quantitative analysis of the luciferase activity associated with these organs clearly established that the bioluminescence was mainly generated from the testes, suggesting that doxorubicin induces p53 activation in this organ. To a lower extent, luminescence was also generated from the liver and the colon. Histological analysis of testis sections revealed that doxorubicin treatment lead to a dramatic disorganization in the structure of the seminiferous tube (Fig. 4a,b). Immunohistofluorescence for luciferase demonstrated that the cell population of the seminiferous tubules was luciferase‐positive (Fig. 4c–f). Cells with the highest activity were the spermatids and the spermatogonia. Immunohistochemistry confirmed that p53 was expressed at a high level in these tubular cells following doxorubicin treatment (Fig. 5).
Figure 4.
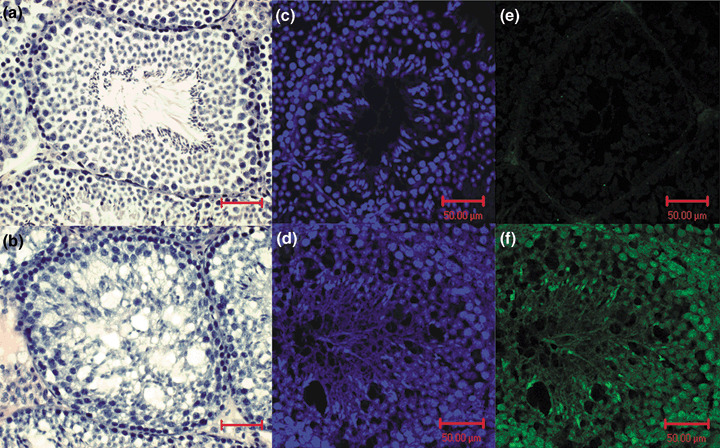
Immunohistological analysis of seminiferous tubules sections from a control (a, c, e) or a p53RE‐Luc mouse following a single intraperitoneal injection of Doxorubicin (b, d, f). (a, b) Haematoxylin and eosin staining (magnification ×20). (c–f) confocal microscopy: fluorescence visualization of 4′‐6‐Diamidino‐2‐phenylindole (c, d), immunofluorescence staining for luciferase (e, f). Bar: 50 micrometers.
Figure 5.
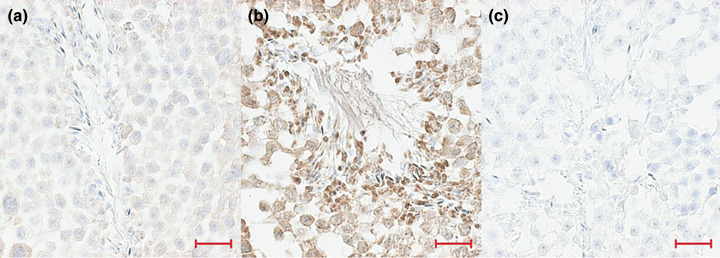
Immunohistological analysis of seminiferous tubules sections: immunoperoxidase staining of p53. (a) p53RE‐Luc mouse before doxorubicin treatment; (b) p53RE‐Luc mouse after treatment and (c) control section with no primary antibody (magnification ×40). Bar: 100 micrometers.
Discussion
The lac‐Z gene controlled by p53 responsive promoters has been used in transgenic mice to detect p53 activation in vivo.( 14 , 22 ) However, transgene expression could only be detected using invasive methods, limiting the potential of these models. In addition, induction of endogenous β‐galactosidase activity has been reported to complicate the analysis.( 23 ) More recently, rodents bearing tumor xenografts encoding a p53‐responsive promoter driving the expression of a relevant reporter gene were used to demonstrate the potential of molecular imaging technologies in the detection of p53 transcriptional activation in vivo.( 20 , 24 ) A luciferase‐based transgenic animal is an attractive strategy as it allows the whole body monitoring of gene expression in a non‐invasive way. As we were developing the present p53RE‐Luciferase mouse model, Hamstra et al. reported a transgenic line in which the MDM2 P2 minimal promoter was driving the expression of the reporter gene.( 25 ) They showed that such a model could be used to monitor p53 activation following ionizing radiation. The transgenic model described in the present study is based on a promoter derived from the PUMA (p53 up‐regulated modulator of apoptosis) gene. PUMA protein is involved in p53‐dependant apoptosis and has been shown to be tightly regulated by p53.( 17 ) In addition, Yu et al. showed that PUMA mRNA level was greatly increased in vitro following chemically induced DNA damage. p53 binding sites were extracted from the PUMA promoter and cloned in front of a minimal promoter driving the expression of the firefly luciferase gene.( 17 ) We used this p53RE‐Luc construct to generate HCT116 cell lines. Doxorubicin was able to induce luciferase expression in the p53+/+ cells in a dose‐dependant manner, but not in the p53−/– cells, thus confirming the p53 specificity of the reporter gene expression. HCT116‐p53RE‐Luc p53−/– were also infected with an adenovirus encoding the p53 protein to successfully induce luciferase expression. This was consistent with previous findings showing that endogenous expression of PUMA was induced following the infection of various p53−/– cell lines with Ad‐p53.( 17 ) In vivo, when these cells were implanted in BALB/c nu/nµ mice, a very weak signal was detected in p53−/– tumors. This signal was very significantly increased in p53+/+ tumors. This increased luciferase activity is likely to be the result of p53 activation in vivo in response to the stressful conditions present in the tumor (e.g. hypoxia, infiltrating macrophages and other leukocytes, necrotic or apoptotic cells). A single, intraperitoneal injection of doxorubicin led the induction of luciferase expression in the wild‐type tumors, with no significant effect in the p53−/– tumors, thus validating our approach in vivo.
In p53RE‐Luc transgenic mice, BLI showed a very low background luciferase activity in the lower peritoneal cavity in males and no signal in females. Doxorubicin induced in a dramatic increase in luciferase activity in the lower peritoneal cavity in males only, suggesting p53 activation in the male reproductive tract. In females, we observed an increased in the signal in the oral cavity but quantitatively, this signal was not significantly affected by the treatment with the drug. This signal is weak and is likely to be due to a very weak ‘leakiness’ of the promoter driving the reporter gene in this anatomical site. This demonstrates that transgene expression is not limited to a single tissue and that it can be detected in both males and females. Dissection of the culled transgenic male mice and imaging of the tissues collected confirmed that the major source of luciferase bioluminescence was the testes. Immunohistology revealed that doxorubicin induced severe damages to the cells in the seminiferous tubules. Cells with the highest luciferase activity were the spermatids, secondary spermatocytes and spermatogonia. Immunohistochemistry confirmed a marked p53 expression in these cells. Moderate doses of doxorubicin have been reported to exert long‐term testicular toxicity in rodents,( 26 ) and to activate p53 and induce apoptosis in male germ line cells.( 27 ) Altogether, these observations demonstrate that the luciferase activity detected in vivo is correlated to p53 activation. This toxicity in rodents is paralleled by a largely reversible sterility observed in male patients treated with doxorubicin.( 28 )
The current study is the first to demonstrate that chemically induced p53 activation can be visualized non‐invasively in vivo. Therefore, we advocate that the p53RE‐Luc mice could be a powerful tool to predict, map and characterize the toxicity of compounds in humans, and to help in the design of new therapeutic agents.
Acknowledgments
We would like to thank Pr. B. Vogelstein (Department of Pathology, Johns Hopkins Medical Institution, Baltimore, USA) for providing HCT116 p53−/– and p53+/+ cells, and Ian Rosewell and colleagues at the Cancer Research UK Transgenic Services (Clare Hall Laboratories, Cancer Research UK, Potters Bar, UK). We also thank M. Ikram and K. Caulee (Centre for Molecular Oncology, Pathology Laboratory, Queen Mary's University, London, UK). This work is supported by grants from Cancer Research UK, the Medical Research Council, INSERM and by grant 0607–3D1615–66/AO INSERM from the French National Cancer Institute (INCa).
References
- 1. Golka K, Kopps S, Myslak ZW. Carcinogenicity of azo colorants: influence of solubility and bioavailability. Toxicol Lett 2004; 151: 203–10. [DOI] [PubMed] [Google Scholar]
- 2. Mehlman MA. Dangerous and cancer‐causing properties of products and chemicals in the oil refining and petrochemical industries. Part XXX: causal relationship between chronic myelogenous leukemia and benzene‐containing solvents. Ann NY Acad Sci 2006; 1076: 110–9. [DOI] [PubMed] [Google Scholar]
- 3. Fang S, Jensen JP, Ludwig RL, Vousden KH, Weissman AM. Mdm2 is a RING finger‐dependent ubiquitin protein ligase for itself and p53. J Biol Chem 2000; 275: 8945–51. [DOI] [PubMed] [Google Scholar]
- 4. Horn HF, Vousden KH. Coping with stress: multiple ways to activate p53. Oncogene 2007; 26: 1306–16. [DOI] [PubMed] [Google Scholar]
- 5. Vogelstein B, Lane D, Levine AJ. Surfing the p53 network. Nature 2000; 408: 307–10. [DOI] [PubMed] [Google Scholar]
- 6. El‐Deiry WS. Regulation of p53 downstream genes. Semin Cancer Biol 1998; 8: 345–57. [DOI] [PubMed] [Google Scholar]
- 7. El‐Deiry WS, Kern SE, Pietenpol JA, Kinzler KW, Vogelstein B. Definition of a consensus binding site for p53. Nat Genet 1992; 1: 45–9. [DOI] [PubMed] [Google Scholar]
- 8. Duerksen‐Hughes PJ, Yang J, Ozcan O. p53 induction as a genotoxic test for twenty‐five chemicals undergoing in vivo carcinogenicity testing. Environ Health Perspect 1999; 107: 805–12. [DOI] [PMC free article] [PubMed] [Google Scholar]
- 9. Yang J, Duerksen‐Hughes P. A new approach to identifying genotoxic carcinogens: p53 induction as an indicator of genotoxic damage. Carcinogenesis 1998; 19: 1117–25. [DOI] [PubMed] [Google Scholar]
- 10. Quinones A, Rainov NG. Identification of genotoxic stress in human cells by fluorescent monitoring of p53 expression. Mutat Res 2001; 494: 73–85. [DOI] [PubMed] [Google Scholar]
- 11. Sohn TA, Bansal R, Su GH, Murphy KM, Kern SE. High‐throughput measurement of the Tp53 response to anticancer drugs and random compounds using a stably integrated Tp53‐responsive luciferase reporter. Carcinogenesis 2002; 23: 949–57. [DOI] [PubMed] [Google Scholar]
- 12. Coates PJ, Lorimore SA, Lindsay KJ, Wright EG. Tissue‐specific p53 responses to ionizing radiation and their genetic modification: the key to tissue‐specific tumour susceptibility? J Pathol 2003; 201: 377–88. [DOI] [PubMed] [Google Scholar]
- 13. Fei P, Bernhard EJ, El‐Deiry WS. Tissue‐specific induction of p53 targets in vivo. Cancer Res 2002; 62: 7316–27. [PubMed] [Google Scholar]
- 14. Komarova EA, Chernov MV, Franks R et al . Transgenic mice with p53‐responsive lacZ: p53 activity varies dramatically during normal development and determines radiation and drug sensitivity in vivo . Embo J 1997; 16: 1391–400. [DOI] [PMC free article] [PubMed] [Google Scholar]
- 15. Komarova EA, Christov K, Faerman AI, Gudkov AV. Different impact of p53 and p21 on the radiation response of mouse tissues. Oncogene 2000; 19: 3791–8. [DOI] [PubMed] [Google Scholar]
- 16. Lu X, Lane DP. Differential induction of transcriptionally active p53 following UV or ionizing radiation: defects in chromosome instability syndromes? Cell 1993; 75: 765–78. [DOI] [PubMed] [Google Scholar]
- 17. Yu J, Zhang L, Hwang PM, Kinzler KW, Vogelstein B. PUMA induces the rapid apoptosis of colorectal cancer cells. Mol Cell 2001; 7: 673–82. [DOI] [PubMed] [Google Scholar]
- 18. Critchley RJ, Jezzard S, Radford KJ et al . Potential therapeutic applications of recombinant, invasive E. coli. Gene Ther 2004; 11: 1224–33. [DOI] [PubMed] [Google Scholar]
- 19. Martinico SC, Jezzard S, Sturt NJ et al . Assessment of endostatin gene therapy for familial adenomatous polyposis‐related desmoid tumors. Cancer Res 2006; 66: 8233–40. [DOI] [PubMed] [Google Scholar]
- 20. Lee KH, Byun SS, Paik JY et al . Cell uptake and tissue distribution of radioiodine labelled d‐luciferin: implications for luciferase based gene imaging. Nucl Med Commun 2003; 24: 1003–9. [DOI] [PubMed] [Google Scholar]
- 21. Wang Y, Groot‐Wassink T, Lemoine NR, Vassaux G. Cellular characterization of the tropism of recombinant adenovirus for the adrenal glands. Eur J Clin Invest 2003; 33: 794–8. [DOI] [PubMed] [Google Scholar]
- 22. Gottlieb E, Haffner R, King A et al . Transgenic mouse model for studying the transcriptional activity of the p53 protein: age‐ and tissue‐dependent changes in radiation‐induced activation during embryogenesis. EMBO J 1997; 16: 1381–90. [DOI] [PMC free article] [PubMed] [Google Scholar]
- 23. Coates PJ, Lorimore SA, Rigat BA, Lane DP, Wright EG. Induction of endogenous beta‐galactosidase by ionizing radiation complicates the analysis of p53‐LacZ transgenic mice. Oncogene 2001; 20: 7096–7. [DOI] [PubMed] [Google Scholar]
- 24. Wang W, El‐Deiry WS. Bioluminescent molecular imaging of endogenous and exogenous p53‐mediated transcription in vitro and in vivo using an HCT116 human colon carcinoma xenograft model. Cancer Biol Ther 2003; 2: 196–202. [DOI] [PubMed] [Google Scholar]
- 25. Hamstra DA, Bhojani MS, Griffin LB, Laxman B, Ross BD, Rehemtulla A. Real‐time evaluation of p53 oscillatory behavior in vivo using bioluminescent imaging. Cancer Res 2006; 66: 7482–9. [DOI] [PubMed] [Google Scholar]
- 26. Jahnukainen K, Jahnukainen T, Salmi TT, Svechnikov K, Eksborg S, Soder O. Amifostine protects against early but not late toxic effects of doxorubicin in infant rats. Cancer Res 2001; 61: 6423–7. [PubMed] [Google Scholar]
- 27. Hou M, Chrysis D, Nurmio M et al . Doxorubicin induces apoptosis in germ line stem cells in the immature rat testis and amifostine cannot protect against this cytotoxicity. Cancer Res 2005; 65: 9999–10005. [DOI] [PubMed] [Google Scholar]
- 28. Howell SJ, Shalet SM. Spermatogenesis after cancer treatment: damage and recovery. J Natl Cancer Inst Monogr 2005; 34: 12–7. [DOI] [PubMed] [Google Scholar]


