Abstract
The wild‐type Wilms’ tumor gene WT1 is overexpressed in human primary leukemia and in a wide variety of solid cancers. All of the four WT1 isoforms are expressed in primary cancers and each is considered to have a different function. However, the functions of each of the WT1 isoforms in cancer cells remain unclear. The present study demonstrated that constitutive expression of the WT1 17AA(–)/KTS(–) isoform induces morphological changes characterized by a small‐sized cell shape in TYK‐nu.CP‐r (TYK) ovarian cancer cells. In the WT1 17AA(–)/KTS(–) isoform‐transduced TYK cells, cell–substratum adhesion was suppressed, and cell migration and in vitro invasion were enhanced compared to that in mock vector‐transduced TYK cells. Constitutive expression of the WT1 17AA(–)/KTS(–) isoform also induced morphological changes in five (one gastric, one esophageal, two breast and one fibrosarcoma) of eight cancer cell lines examined. No WT1 isoforms other than the WT1 17AA(–)/KTS(–) isoform induced the phenotypic changes. A decrease in α‐actinin 1 and cofilin expression and an increase in gelsolin expression were observed in WT1 17AA(–)/KTS(–) isoform‐transduced TYK cells. In contrast, co‐expression of α‐actinin 1 and cofilin or knockdown of gelsolin expression by small interfering RNA restored WT1 17AA(–)/KTS(–) isoform‐transduced TYK cells to a phenotype that was comparable to that of the parent TYK cells. These results indicated that the WT1 17AA(–)/KTS(–) isoform exerted its oncogenic functions through modulation of cytoskeletal dynamics. The present results may provide a novel insight into the signaling pathway of the WT1 gene for its oncogenic functions. (Cancer Sci 2006; 97: 259–270)
The WT1 gene was originally isolated as a tumor suppressor gene responsible for Wilms’ tumor, a neoplasm of childhood.( 1 ) The WT1 gene encodes a protein that has four zinc fingers and is considered to be involved in transcriptional regulation of genes such as Platelet‐derived growth factor A (PDGF‐A) chain,( 2 ) Macrophage colony stimulating factor‐1 (CSF‐1),( 3 ) Insulin‐like growth factor (IGF)‐II,( 4 ) IGF‐IR( 5 ) and Retinoic acid receptor (RAR)‐α,( 6 ) and RNA metabolism.( 7 , 8 , 9 ) Although the WT1 gene is considered a tumor suppressor gene, the wild‐type WT1 gene is overexpressed in primary human leukemia( 10 ) and in a wide variety of solid cancers such as lung,( 11 ) colon,( 12 ) esophageal,( 13 ) breast,( 14 , 15 ) thyroid( 16 ) and pancreatic ductal cancer,( 17 ) head and neck squamous cell carcinoma (HNSCC),( 18 ) bone and soft‐tissue sarcoma,( 19 ) and astrocytic tumors.( 20 ) Moreover, the following findings indicate that the wild‐type WT1 gene plays an oncogenic rather than a tumor‐suppressor role in tumorigenesis of various types of cancers:( 21 ) (i) high expression levels of WT1 mRNA correlate with poor prognosis in leukemia( 10 ) and breast cancer,( 15 ) and with high tumor stage in testicular germ‐cell tumors( 22 ) and HNSCC;( 18 ) (ii) bone marrow cells with high expression levels of WT1 tend to develop into leukemia in 7,12‐demethylbenz[a]anthracene‐induced rat leukemia;( 23 ) (iii) growth of WT1‐expressing leukemia and solid cancer cells is inhibited by treatment with WT1 antisense oligomers;( 24 , 25 , 26 ) and (iv) differentiation is blocked but proliferation is induced by constitutive expression of the WT1 17AA(+)/KTS(+) isoform in response to granulocyte‐CSF in 32D cl3 myeloid progenitor( 27 ) and normal myeloid cells.( 28 )
The WT1 gene is spliced alternatively at two sites: the 17AA site, which consists of exon 5 of the WT1 gene, and the KTS site, which exists between zinc fingers 3 and 4. Splicing at these sites yields four isoforms (17AA[+]/KTS[+], 17AA[+]/KTS[–], 17AA[–]/KTS[+] and 17AA[–]/KTS[–]), each of which is considered to have different functions. All of the four isoforms are expressed in primary human solid cancers, including lung cancer,( 11 ) HNSCC( 18 ) and sarcoma,( 19 ) and human primary leukemia.( 29 ) However, the functions of each of the four WT1 isoforms in cancer cells remain unclear.
In the present study, we examined the effects of constitutive expression of each of the four WT1 isoforms on cancer cell behavior and demonstrated that, of the four WT1 isoforms, only WT1 17AA(–)/KTS(–) induces morphological changes, allowing cancer cells to acquire more invasive phenotypes in vitro. Furthermore, we showed that the phenotypic changes were induced through modulation of expression of cytoskeletal regulatory proteins such as α‐actinin 1, cofilin and gelsolin.
Materials and Methods
Cell culture
Human ovarian (TYK‐nu.CP‐r, abbreviated to TYK),( 26 ) gastric (MKN28),( 26 ) breast (ZR‐75( 26 ) and SKBr3), esophageal (TE10), pancreatic (MiaPaCa2),( 17 ) colon (SW480)( 26 ) and cervical (HelaAG)( 26 ) cancer cell lines, and a human fibrosarcoma cell line (HT‐1080)( 26 ) were used for experiments. SKBr3 and TE10 were kindly provided by Dr Y. Miyoshi (Surgical Oncology, Osaka University Graduate School of Medicine, Osaka, Japan) and Dr H. Miyata (Surgery and Clinical Oncology, Osaka University Graduate School of Medicine), respectively. TE10 and SW480 were cultured in RPMI‐1640 medium supplemented with 10% fetal bovine serum (FBS). The remaining cell lines were cultured in Dulbecco's modified Eagle's medium (DMEM) with 10% FBS.
Vectors construction
Four pcDNA 3.1(+) vectors (Invitrogen, Carlsbad, CA, USA), each containing one of the four human WT1 isoforms (17AA[+]/KTS[+], 17AA[+]/KTS[–], 17AA[–]/KTS[+] or 17AA[–]/KTS[–]), were constructed and used for expression of the WT1 isoforms in TYK cells. The sequence of one each of these four WT1 isoforms was cloned in a pUC119 vector and amplified by polymerase chain reaction (PCR) using Pfx Taq polymerase (Invitrogen), integrated into the pEGFP vector (Clontech, Palo Alto, CA, USA) and used for transient expression of green fluorescent protein (GFP)‐tagged WT1 isoforms. All of the PCR‐amplified sequences were confirmed for the absence of mutation by direct sequencing using the BigDye Terminator V.1.1 cycle sequencing kit (Applied Biosystems, Branchberg, NJ, USA).
To prepare the expression vectors for α‐actinin 1 and cofilin, cDNA was prepared from mRNA isolated from TYK cells, and the sequences of these genes were PCR‐amplified using Pfx Taq polymerase. The sequences of α‐actinin 1 and cofilin were inserted into pcDNA 3.1/Zeo (+) vectors (Invitrogen).
To prepare the gelsolin small interfering RNA (siRNA) vector, a pair of DNA sequences targeting the sequences in gelsolin mRNA (5′‐UCC AGG AUG AAG CAG UCG CCA UUG UUG AA‐3′) were synthesized (Japan BioScience, Saitama, Japan), annealed and inserted into the tRNA–shRNA expression vector piGENE tRNA Pur (Clontech).
Stable expression of vectors
The mammalian expression vectors and the siRNA vector targeting gelsolin were linearized with PvuI and introduced into cells by electroporation using the Gene Pulsor II (Bio‐Rad, Hercules, CA, USA). The cell clones stably expressing vectors were isolated using the corresponding selective antibiotics.
Transient expression of vectors
Vector DNA (2 µg) was transfected into cells at a density of 5 × 10⁴ cells/mL using Fugene 6 (Roche, Indianapolis, IN, USA), according to the manufacturer's instructions. Transfected cells were collected at the time points indicated and used for analysis.
Reverse transcription–polymerase chain reaction
Total RNA was isolated using ISOGEN (Nippon Gene, Tokyo, Japan) and dissolved in diethylpyrocarbonate (DEPC)‐treated water. Total RNA (2 µg) was converted into cDNA using Moloney murine leukemia virus reverse transcriptase (Promega, Madison, WI, USA) as described previously.( 26 )
Polymerase chain reaction primer sequences and conditions for amplification of 11 actin binding proteins, including gelsolin, profilin, p125fak, paxillin, α‐actinin 1, Vasodilator‐stimulated phosphoprotein (VASP) and glyceraldehyde‐3‐phosphate dehydrogenase (GAPDH; used as a loading control) were described previously,( 30 ) whereas those for talin, cofilin, ezrin, radixin and moesin are shown in Table 1. PCR products were separated on a 2% agarose gel containing ethidium bromide and visualized under ultraviolet light.
Table 1.
Polymerase chain reaction primers for amplification of actin binding proteins
| Gene | Sense primer sequence | Antisense primer sequence |
|---|---|---|
| Gelsolin † | CTT TCC AGC CAT ATC GCC AAC | TTC TCT GCC TCG CTG GCT C |
| Profilin † | GGC CAG AAA TGT TCG GTG | ACG GGA GGG ATA TGG GTA |
| p125fak † | GAC TCA CCT GGG TAC TGG TAT G | ATC GCT CTT CAC CTG TTG ATA G |
| Paxillin † | CAG TCG CCA AAG GAG TCT G | GTA GTC CTT GCG ACA GTA GGC |
| α‐Actinin 1 † | GGA GCC GAA GAA ATC GTG | CTG CTC GTT CTC CTG GTT G |
| VASP † | GGA AAG TCA GCA AGC AGG | TGT GCG GAA AGG AGA AGC |
| Talin | TGG CTA CCT GGA ACT GCT GGA C | TCC AGC TCT CGT TCC TTC CGA AG |
| Cofilin | AGT CTT CAA CGC CAG AGG AGG TG | GTG CAG CGG TCC TTG ACC TCC T |
| Ezrin | AGG AGT TGA TGC TGC GGC TGC A | GTG GAT GAT GTC ATT GTG GGT CC |
| Radixin | ACC ACC AGT CAT TCC TCC AAC AG | GGC AAG GTG GGA TGC ATT CCA TC |
| Moesin | TGG TGC CTT CAA GAC CTT CAC C | GTC ACC TGA GAG GGT TGA GTA AAC |
| GAPDH | GCC AAA AGG GTC ATC ATC TC | GTA GAG GCA GGG ATG ATG TTC |
Primers reported previously.( 30 ) mRNA of actin binding proteins was amplified by reverse transcription–polymerase chain reaction (20 cycles, annealing temperature 60°C) using the pairs of primers shown above. GAPDH, glyceraldehyde‐3‐phosphate dehydrogenase; VASP, vasodilator‐stimulated phosphoprotein.
Western blot analysis
Cells were washed twice with phosphate‐buffered saline (PBS) and lysed with sodium dodecylsulfate (SDS) sample buffer (0.125 M Tris‐HCl, pH 6.8, 100 mM dithiothreitiol, 4% SDS, 10% sucrose and 0.004% bromophenol blue). Cell lysates were subjected to SDS‐polyacrylamide gel electrophoresis, and protein spots were transferred to Immobilon polyvinylidene difluoride membrane (Millipore, Bedford, MA, USA), and immunoblotted with antibodies specific for WT1 (Dakocytomation, Carpinteria, CA, USA), GAPDH, actin (Chemicon, Temecula, CA, USA), F‐actin (Abcam, Cambridge, UK), α‐tubulin, cofilin (Santa Cruz Biotechnology, Santa Cruz, CA, USA), gelsolin (Sigma, St Louis, MO, USA) and α‐actinin 1 (clone AT6/172; Upstate Cell Signaling Solutions, New York, NY, USA).
Immunocytochemistry
Subconfluent cells were collected and replated at a density of 5 × 10⁴ cells/mL in 1 mL of DMEM with 10% FBS on a sterilized 24 × 24 mm cover glass in each well of a six‐well plate. After overnight culture, cells on the cover glass were air‐dried, fixed with paraformaldehyde (0.5% for staining of actin stress fiber and 4% for that of the remaining proteins), washed twice with 0.05% Tween 20 in PBS, permeabilized with 1% Triton X‐100 in PBS for 10 min, incubated in blocking buffer (2% bovine serum albumin [BSA], 0.2% Tween 20, 6.7% glycerol and 0.1% NaN3 in PBS) for 30 min, and immunoblotted with the first antibodies against gelsolin, α‐actinin 1 or cofilin for 1 h. After washing with 0.05% Tween 20 in PBS, cells were incubated with the corresponding secondary antibodies for 1 h. Actin stress fibers and the focal adhesion protein vinculin were stained using the FAK100 staining kit (Chemicon) according to the manufacturer's instructions. Expression of these proteins was analyzed using a confocal microscope (LSM510 ver. 2.8; Carl Zeiss, Jena, Germany).
Cell attachment assay and cell detachment assay
The cell attachment assay was carried out as reported previously.( 31 ) After overnight starvation in DMEM containing 0.5% FBS, cells were plated at a density of 104 cells/well in 100 µL of serum‐free DMEM in 96‐well plates coated with 10 µg/mL of fibronectin (Sigma) and incubated in 5% CO2 at 37°C for 30 min. After two washes with PBS, attached cells were trypsinized and counted.
The cell detachment assay was carried out as reported previously.( 32 ) Cells (1 × 10⁵ cells) in 1 mL of DMEM with 10% FBS were seeded in 24‐well plates and incubated overnight for cell attachment. Cells were then treated with 0.25% trypsin (Nacalai Tesque, Kyoto, Japan) at room temperature and collected 2 min after the start of trypsin treatment.
Analysis of migration of individual cells
Migration of individual cells was analyzed using time‐lapse microscopy. In brief, cells were plated in 35‐mm dishes at 30% confluence and incubated for 48 h. Cells were then incubated in an atmosphere containing 5% O2, 5% CO2 and 90% N2 at 37°C, and cell migration was recorded at 2‐min intervals for 5 h using Meta Cam software (Universal Imaging Software, Buckinghamshire, UK). The position ([x,y] coordinates) of the traced cell at a certain time point was determined using Commotion Pro 4.0 software (Pinnacle Systems, Mountain View, CA, USA) and the distance migrated every 2 min was calculated. The velocity (µm/h) of the traced cell was determined from the total migrated distance during the recording for 5 h.
Wound healing assay
The wound healing assay was carried out as described previously.( 33 ) Briefly, cell suspensions were plated at a density of 1 × 10⁵ cells/mL in 2 mL of DMEM with 10% FBS in six‐well plates and grown to confluence. Confluent monolayer cells were scratched with 200 µl yellow pipette tip, washed twice gently with serum‐free DMEM and incubated in DMEM with 10% FBS. The scratched wound was photographed 0 and 12 h after the scratch. Cell migration was determined as a mean of the percentage of protrusive length to initial wound scratched length at three different sites in the same visual field on the photograph.
Transwell migration assay
The chemotaxis invasion assay was carried out as described previously.( 34 ) After incubation in serum‐free DMEM with 0.1% BSA for 2 h, cells (3 × 10⁴ cells) in 200 µL of serum‐free DMEM with 0.1% BSA were applied to the Transwell upper chamber (PET membrane 8‐µm pore size; BD Falcon, Franklin Lakes, NJ, USA). The lower chamber was filled with 5% serum DMEM with 0.1% BSA. After 18 h, the migrating cells on the lower side of the filter and the well bottom were fixed with 70% methanol and counted.
Statistical analysis
The statistical significance in differences between the means of test groups was assessed using the unpaired t‐test.
Results
Morphological changes are induced by constitutive expression of the WT1 17AA(–)/KTS(–) isoform in various types of cancer cells
To examine the effects of the WT1 gene on cancer cell behaviors, one each of four WT1 isoforms was stably expressed in TYK ovarian cancer cells, and TYK cell clones expressing the transduced WT1 isoform at high levels were isolated (Fig. 1a). Stable expression of the WT1 17AA(–)/KTS(–) isoform induced morphological changes characterized by small‐sized and fibroblast‐like cell shapes in TYK cells (Fig. 1b,c). In contrast, stable expression of WT1 isoforms other than WT1 17AA(–)/KTS(–) did not induce any morphological changes in TYK cells.
Figure 1.
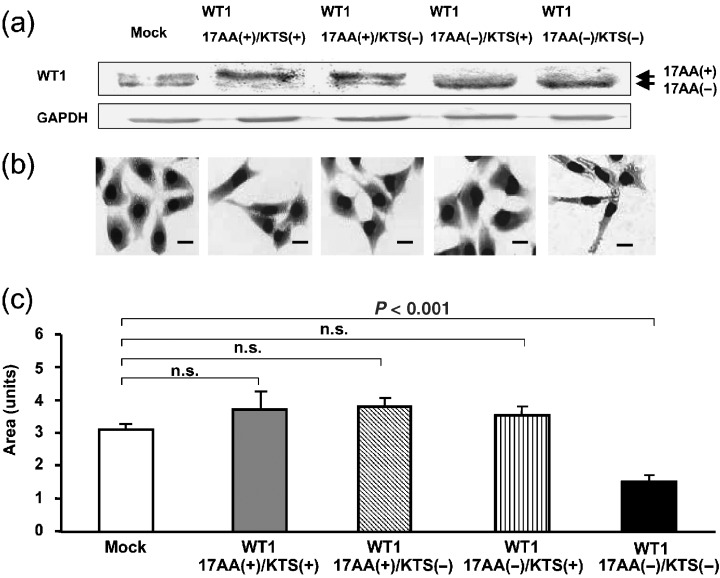
Induction of morphological changes in TYK‐nu.CP‐r (TYK) ovarian cancer cells by constitutive expression of the WT1 17AA(–)/KTS(–) isoform. (a) Representative results of western blot analysis on expression of the WT1 protein in four TYK cell clones, each transduced with a different WT1 isoform. (b) Representative results of stable expression of each of the WT1 isoforms in TYK cells. The cells were stained with MayGrünwald–Giemsa. Scale bars = 10 µm. (c) Means of relative areas of more than eight individual cells from three cell clones. Areas were calculated using NIH Image software.
Furthermore, to examine whether or not the WT1 17AA(–)/KTS(–) isoform could induce morphological changes in various types of cancer cells other than TYK cells, GFP‐tagged WT1 17AA(–)/KTS(–) was expressed transiently in gastric (MKN28), breast (ZR‐75 and SKBr3), esophageal (TE10), pancreatic (MiaPaCa2), colon (SW480) and cervical (HelaAG) cancer cell lines and a fibrosarcoma cell line (HT‐1080) (Fig. 2). Confocal microscopic analysis showed that transient expression of the GFP‐tagged WT1 17AA(–)/KTS(–) isoform induced morphological changes in cell size (smaller) and three‐dimensional cell shape in MKN28, ZR‐75, SKBr3, TE10 and HT‐1080. Expression of GFP control vector did not induce any morphological changes in these cell lines (data not shown). In the remaining three cell lines (MiaPaCa2, SW480 and HelaAG), obvious morphological changes were not observed (data not shown).
Figure 2.
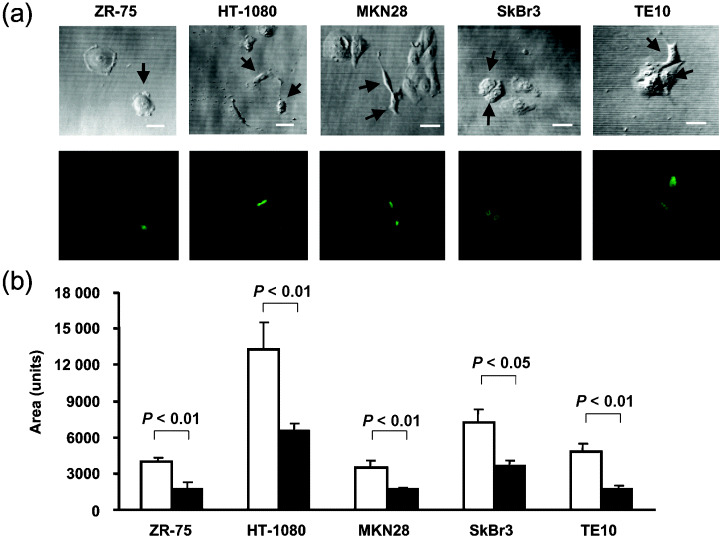
Induction of morphological changes in various types of cancer cells by constitutive expression of the WT1 17AA(–)/KTS(–) isoform. (a) Green fluorescent protein (GFP)‐tagged WT1 17AA(–)/KTS(–) isoform was expressed transiently in various types of cancer cells such as ZR‐75, HT‐1080, MKN28, SKBr3 and TE10. Cells were analyzed morphologically using confocal microscopy 48–72 h after transfection. Upper panel, transparent images; lower panel, fluorescence images. Arrows indicate the cells expressing GFP‐tagged WT1 17AA(–)/KTS(–) protein. Scale bars = 10 µm. (b) Means of relative areas of more than nine individual cells. Areas were calculated using NIH Image software.
To confirm that only the WT1 17AA(–)KTS(–) isoform could induce morphological changes in cancer cells, one each of the other three GFP‐tagged WT1 isoforms was expressed transiently in HT‐1080 and TE10 cells, in which WT1 17AA(–)KTS(–) induced morphological changes. Confocal microscopic analysis showed that none of the three GFP‐tagged WT1 isoforms induced morphological changes in these two cell lines (data not shown).
Cell–substratum adhesion is suppressed by constitutive expression of the WT1 17AA(–)/KTS(–) isoform
To examine whether the morphological changes observed in WT1 17AA(–)/KTS(–) isoform‐transduced cells resulted from changes in the spreading ability of cells, the effects of constitutive expression of the WT1 17AA(–)/KTS(–) isoform on cell–substratum adhesion were analyzed in TYK cells. The cell attachment assay showed a significant decrease in anchorage to the substratum of WT1 17AA(–)/KTS(–) isoform‐transduced cell clones (n = 4) compared to mock vector‐transduced cells (n = 4) (Fig. 3a). Moreover, the cell detachment assay showed a significant decrease in the strength of cell–substratum adhesion of WT1 17AA(–)/KTS(–) isoform‐transduced cell clones (n = 5) compared to that of mock vector‐transduced cells (n = 5) (Fig. 3b). In the cell detachment assay, 53.3% of WT1 17AA(–)/KTS(–) isoform‐transduced cells detached from the plastic substratum 2 min after the start of trypsin treatment, whereas only 9.8% of the control vector‐transduced cells detached. Thus, the strength of cell–substratum adhesion was reduced in WT1 17AA(–)/KTS(–) isoform‐transduced cells compared to control vector‐transduced cells.
Figure 3.
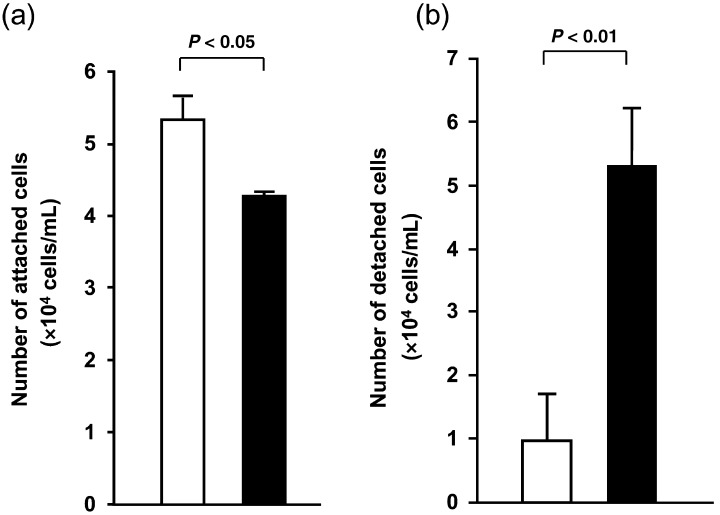
Suppression of cell–substratum adhesion by stable expression of the WT1 17AA(–)/KTS(–) isoform. WT1 17AA(–)/KTS(–) expression vector‐transduced or control vector‐transduced TYK cells were analyzed for (a) cell–substratum adhesion by cell attachment assay, and (b) strength of cell–substratum adhesion by cell detachment assay. Means of cell numbers of WT1 17AA(–)/KTS(–)‐transduced TYK cell clones (▪) and means of those of control vector‐transduced cell clones (□). Experiments were carried out independently three times for each cell line.
Cell migration is enhanced by constitutive expression of the WT1 17AA(–)/KTS(–) isoform
To examine the effects of constitutive expression of the WT1 17AA(–)/KTS(–) isoform on cell migration, individual migration, collective migration and in vitro invasion of WT1 17AA(–)/KTS(–) isoform‐transduced cells were analyzed.
Migration of individual cells was evaluated in WT1 17AA(–)/KTS(–) isoform‐transduced TYK cells using time‐lapse microscopy (Fig. 4a). Migration of individual TYK cells with (n = 19) or without (n = 19) transient GFP‐WT1 17AA(–)/KTS(–) isoform expression was recorded at 2‐min intervals for 5 h. Cell migration was then traced and the velocity of cell migration was calculated. Results from 10 independent experiments showed a 1.8‐fold increase in the velocity of random migration in TYK cells expressing the GFP‐WT1 17AA(–)/KTS(–) isoform compared to cells not expressing it. However, migration of individual TYK cells expressing GFP‐mock vector was not significantly different from that of cells not expressing GFP‐mock vector (data not shown).
Figure 4.
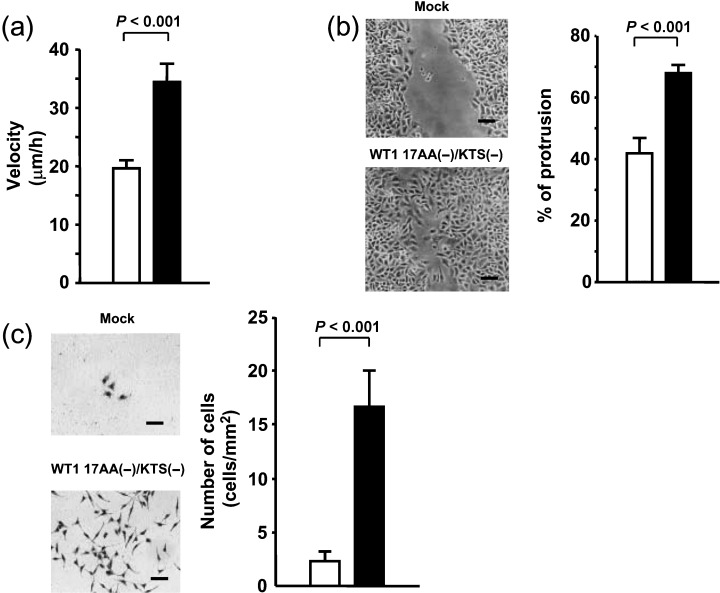
Enhancement of cell migration by constitutive expression of the WT1 17AA(–)/KTS(–) isoform. (a) Migration of individual green fluorescent protein (GFP)‐WT1 17AA(–)/KTS(–)‐expressing or ‐non‐expressing TYK cells was recorded using a time‐lapse video recorder at 2‐min intervals for 5 h. The velocity of the cells was calculated by the method described in ‘Materials and Methods’. Means of the velocity of GFP‐WT1 17AA(–)/KTS(–)‐expressing (▪) and ‐non‐expressing (□) cells. Bars indicate SE. Experiments were carried out independently ten times. (b,c) WT1 17AA(–)/KTS(–) expression vector‐ or control vector‐transduced TYK cells were analyzed for (b) collective migration by wound healing assay, and for (c) chemotaxis to 5% fetal bovine serum in Delbucco's modified Eagle's medium by transwell migration assay. (▪), WT1 17AA(–)/KTS(–) isoform‐transduced TYK cell clones; (□), control vector‐transduced TYK cell clones. Experiments were carried out independently three times for each cell clone. (b) Cell migration was determined as the mean of percentages of protrusive lengths to initial wound scratched lengths at three different sites. (c) Cells that invaded from the upper to lower chambers were stained with MayGrünwald–Giemsa and counted. (b–c) Scale bars = 50 µm.
To further characterize the enhanced migration of WT1 17AA(–)/KTS(–) isoform‐transduced cells, collective migration was analyzed using the wound healing assay (Fig. 4b). WT1 17AA(–)/KTS(–) isoform‐transduced cell clones (n = 4) showed a 1.8‐fold increase in the distance of cell migration during 12 h after wound scratching, compared to mock vector‐transduced cells (n = 5).
Furthermore, in vitro invasion of WT1 17AA(–)/KTS(–) isoform‐transduced cell clones was examined by transwell migration assay (Fig. 4c). The number of cells that invaded through the membrane was determined using chemotaxis assays after 18 h of cell plating in the upper transwell chamber. Chemotaxis to FBS of WT1 17AA(–)/KTS(–) isoform‐transduced cell clones (n = 4) was enhanced eight‐fold compared to mock vector‐transduced cells (n = 5).
Constitutive expression of the WT1 17AA(–)/KTS(–) isoform changes the expression of filamentous actin and actin binding proteins
Constitutive expression of the WT1 17AA(–)/KTS(–) isoform induced morphological changes, reduced cell–substratum adhesion and enhanced cell migration in TYK cells. As these results indicated changes in the cytoskeletal structures of these cells, immunocytochemical examination was carried out. As expected, the filamentous actin (F‐actin) meshwork was decreased and focal adhesions were reduced in these cells (Fig. 5a). Western blot analysis showed that expression levels of F‐actin were decreased in WT1 17AA(–)/KTS(–) isoform‐transduced cells compared to mock vector‐transduced cells, but that total expression levels of actin and α‐tubulin remained unchanged (Fig. 5b). Therefore, we used reverse transcription–PCR to examine the mRNA expression of 11 actin binding proteins (ABP), including α‐actinin 1, cofilin, gelsolin, Focal adhesion kinase (FAK), profilin, paxillin, VASP, talin, ezrin, moesin and radixin, in WT1 17AA(–)/KTS(–) isoform‐transduced cells. As shown in Fig. 5c, expression of α‐actinin 1 and cofilin was suppressed and that of gelsolin was increased in WT1 17AA(–)/KTS(–) isoform‐transduced cells. The decrease in α‐actinin 1 and cofilin and the increase in gelsolin were confirmed at the protein level by western blot analysis (Fig. 5d). Immunocytochemistry confirmed the suppressed expression of α‐actinin 1 and cofilin proteins and the increased expression of gelsolin protein in the cytoplasm of WT1 17AA(–)/KTS(–) isoform‐transduced cells (Fig. 5e). In terms of the mRNA expression of the remaining eight ABP, no changes were observed between WT1 17AA(–)/KTS(–) isoform‐transduced and mock vector‐transduced cells (data not shown).
Figure 5.
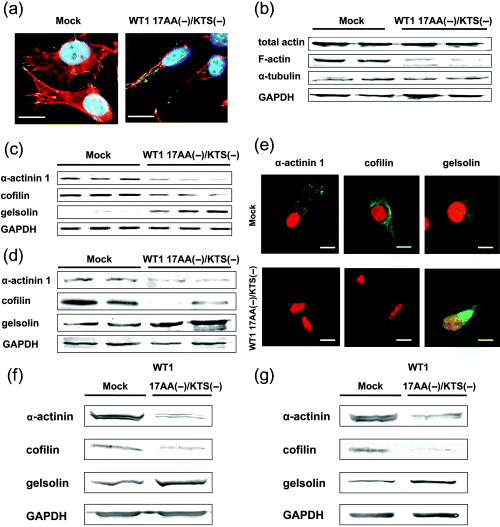
Alteration of the expression of filamentous‐actin (F‐actin) and actin binding proteins (ABP) by constitutive expression of the WT1 17AA(–)/KTS(–) isoform. (a) WT1 17AA(–)/KTS(–) isoform‐transduced or control vector‐transduced TYK cells were stained immunocytochemically for F‐actin (red), the focal adhesion protein vinculin (green) and the nucleus (blue). (b) Cell lysates of control vector‐transduced (lanes 1 and 2) or WT1 17AA(–)/KTS(–) isoform‐transduced (lanes 3 and 4) independent cell clones were immunoblotted with antibodies specific for total actin, F‐actin, α‐tubulin or glyceraldehyde‐3‐phosphate dehydrogenase (GAPDH; used as a loading control). (c) Expression of mRNA of ABP in control vector‐transduced (n = 3, lanes 1–3) or WT1 17AA(–)/KTS(–) isoform‐transduced (n = 3, lanes 4–6) TYK cell clones isolated independently was analyzed by reverse transcription–polymerase chain reaction under the conditions shown in Table 1. (d) Cell lysates of control vector‐transduced (lanes 1 and 2) or WT1 17AA(–)/KTS(–) isoform‐transduced (lanes 3 and 4) TYK cell clones were immunoblotted with antibodies specific for α‐actinin 1, cofilin and gelsolin. (e) WT1 17AA(–)/KTS(–) isoform‐transduced or control vector‐transduced TYK cells were stained immunocytochemically for α‐actinin 1, cofilin and gelsolin (green). The nucleus of cells was stained with propidium iodide (red). (a,e) Scale bars = 10 µm. (f,g) Cell lysates of control vector‐transduced or WT1 17AA(–)/KTS(–) isoform‐transduced HT‐1080 (f) or TE10 (g) cell clones were immunoblotted with antibodies specific for α‐actinin 1, cofilin and gelsolin.
Furthermore, to confirm the regulation of expression of gelsolin, α‐actinin 1 and cofilin by the WT1 17AA(–)KTS(–) isoform, it was stably expressed in HT‐1080 and TE10 cells. Western blot analysis showed that expression of α‐actinin 1 and cofilin was suppressed whereas expression of gelsolin was increased in WT1 17AA(–)/KTS(–) isoform‐transduced cells compared to control pcDNA 3.1 vector‐transduced cells (Fig. 5f,g).
Restoration of phenotypes in WT1 17AA(–)/KTS(–) isoform‐transduced TYK cells by constitutive expression of both α‐actinin 1 and cofilin or by suppression of gelsolin with gelsolin‐specific siRNA
To examine whether decreased expression of α‐actinin 1 and cofilin was involved in morphological changes, decreased adhesion and increased cell migration in WT1 17AA(–)/KTS(–) isoform‐transduced TYK cells, the α‐actinin 1/pcDNA 3.1/Zeo (+) and cofilin/pcDNA 3.1/Zeo (+) expression vectors were cotransduced into WT1 17AA(–)/KTS(–) isoform‐transduced TYK cells, and cell clones (TW/ACTN‐CFL cells) in which expression levels of α‐actinin 1 and cofilin were comparable to those in TYK parental cells were isolated (Fig. 6a). The phenotypes of TW/ACTN‐CFL cells were compared to those of WT1 17AA(–)/KTS(–) isoform‐transduced TYK cell clones (TW/Mock) that were transduced with control pcDNA 3.1/Zeo (+) vector. TW/ACTN‐CFL cells displayed morphological changes to a well‐spreading cell shape like the TYK parent cells, whereas TW/Mock cells did not (Fig. 6b,c). The cell detachment assay showed that the number of detached cells in TW/ACTN‐CFL cell clones (n = 3) 2 min after treatment with trypsin was decreased compared to TW/Mock cells (n = 3) and was comparable to that of the TYK parent cells (Fig. 6d). Moreover, the wound healing assay showed that cell motility of TW/ACTN‐CFL cell clones (n = 3) was decreased compared to TW/Mock cell clones (n = 3) and was comparable to that of the TYK parent cells (Fig. 6e). In contrast, constitutive expression of either cofilin or α‐actinin 1 could not restore WT1 17AA(–)/KTS(–) isoform‐transduced TYK cells to a phenotype that was comparable to parent TYK cells (data not shown), indicating co‐operative actions of α‐actinin 1 and cofilin in the regulation of morphology and behaviors of TYK cells.
Figure 6.
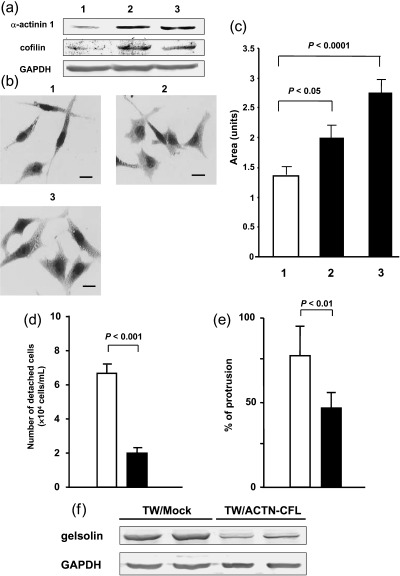
Stable expression of α‐actinin 1 and cofilin restores the phenotypes of TYK cells induced by transduction of the WT1 17AA(–)/KTS(–) isoform to those of parent TYK cells. WT1 17AA(–)/KTS(–) isoform‐transduced TYK cells were co‐transfected with α‐actinin 1 and cofilin expression vectors (TW/ACTN‐CFL) or a control vector (TW/Mock). (a) Expression levels of α‐actinin 1 and cofilin determined by western blot analysis. (b) Cells were stained with MayGrünwald–Giemsa. (c) Areas of cells calculated using NIH Image software. 1, TW/Mock cell clone; 2 and 3, different TW/ACTN‐CFL cell clones. Scale bars = 10 µm. (d) Cell–substratum adhesion determined by detachment assay. (e) Collective cell motility evaluated by wound healing assay. Cell migration was determined as the mean of percentages of protrusive lengths to initial wound scratched lengths at three different sites. (f) Expression levels of gelsolin determined by western blot analysis. (c–e) (▪), TW/ACTN‐CFL cells; (□), TW/Mock cells.
To examine whether the increase in gelsolin expression levels contributed to the morphological changes, the decreased cell–substratum adhesion and the increased migration in WT1 17AA(–)/KTS(–) isoform‐transduced TYK cells, these cells were transduced with a gelsolin‐specific siRNA or mock siRNA vector, and cell clones in which expression levels of gelsolin were comparable to those of gelsolin in parent TYK cells were isolated (TW/GSNsiRNA) (n = 3) (Fig. 7a). Suppression of gelsolin expression by gelsolin‐specific siRNA vector did not induce any morphological changes in WT1 17AA(–)/KTS(–) isoform‐transduced TYK cells compared to WT1 17AA(–)/KTS(–) isoform‐transduced TYK cells transduced with a mock siRNA vector (TW/siMock) (n = 3) (Fig. 7b,c). The detachment assay showed that there was no difference in the strength of cell–substratum adhesion between TW/GSNsiRNA cells and TW/siMock cells (Fig. 7d). However, the wound healing assay showed that cell migration of TW/GSNsiRNA cells was reduced significantly with suppressed gelsolin expression compared to that of TW/siMock cells and was comparable to that of the TYK parent cells (Fig. 7e).
Figure 7.
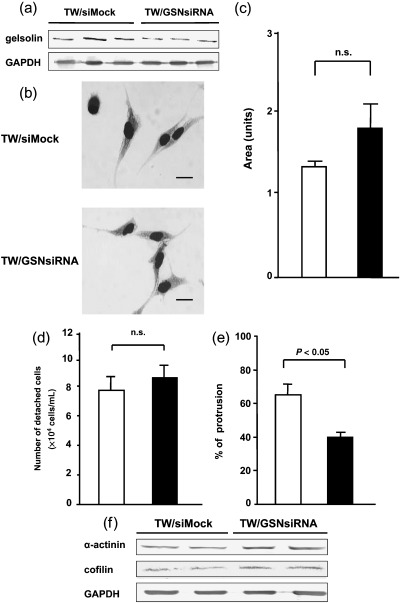
Suppression of gelsolin expression reduces cell migration but does not effect morphology or cell–substratum adhesion. WT1 17AA(–)/KTS(–) isoform‐transduced TYK cells were transduced with a gelsolin‐specific small interfering RNA (siRNA) vector (TW/GSNsiRNA) or control vector (TW/siMock). (a) Expression levels of gelsolin protein determined by western blot analysis. Three different cell clones were examined. (b) Cells were stained with MayGrünwald–Giemsa. Scale bars = 10 µm. (c) Areas of TW/Mock cell clone and TW/GSNsiRNA were calculated using NIH Image software. (d) Cell–substratum adhesion determined by detachment assay. (e) Collective cell motility evaluated by wound healing assay. (f) Expression levels of α‐actinin 1 and cofilin determined by western blot analysis. (c–e) (▪), Cell clones transduced with siRNA vector specific for gelsolin; (□), mock siRNA vector‐transduced cell clones.
Furthermore, to examine whether or not the expression of actinin/cofilin and gelsolin were correlated, we examined the gelsolin protein expression levels in TW/ACTN‐CFL and TW/Mock cells and α‐actinin 1 and cofilin protein expression levels in TW/GSNsiRNA and TW/siMock cells. Constitutive expression of α‐actinin 1 and cofilin suppressed the expression of gelsolin (Fig. 6f). In the opposite way, suppression of gelsolin increased the expression of α‐actinin 1 and cofilin (Fig. 7f).
In summary, constitutive expression of the WT1 17AA(–)/KTS(–) isoform downregulated the expression of both α‐actinin 1 and cofilin, and upregulated that of gelsolin (Fig. 8). Moreover, α‐actinin 1/cofilin and gelsolin gene expression were regulated mutually in the downstream signaling of the WT1 17AA(–)/KTS(–) isoform. Thus, all or part of the function of the WT1 17AA(–)/KTS(–) isoform to induce morphological change, to decrease cell–substratum adhesion and to enhance cell migration should operate through the regulation of α‐actinin 1/cofilin and gelsolin.
Figure 8.
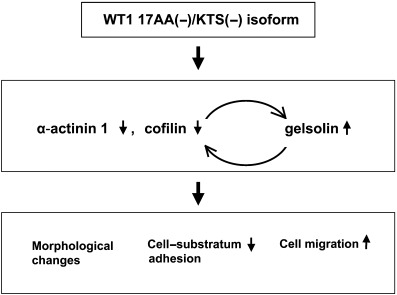
The possible roles of the WT1 17AA(–)/KTS(–) isoform in the regulation of cytoskeletal dynamics. Constitutive expression of the WT1 17AA(–)/KTS(–) isoform downregulates the expression of both α‐actinin 1 and cofilin, and upregulates that of gelsolin. Moreover, α‐actinin 1/cofilin and gelsolin are mutually regulated in the downstream signaling of the WT1 17AA(–)/KTS(–) isoform. Thus, all or part of the functions of the WT1 17AA(–)/KTS(–) isoform (to induce morphological change, to decrease cell–substratum adhesion and to enhance cell migration) should operate through the regulation of α‐actinin 1/cofilin and gelsolin.
Discussion
Accumulating evidence has indicated the possibility of the involvement of the WT1 gene in the tumorigenesis of various types of cancers. However, direct evidence for this possibility is scarce, and how the WT1 gene is involved in tumorigenesis remains unclear. In the present study, we demonstrated that of the four WT1 isoforms, only WT1 17AA(–)/KTS(–): (i) induced morphological changes associated with a decrease in actin stress fibers in human cancer cells; (ii) suppressed cell–substratum adhesion; and (iii) enhanced cell migration and in vitro invasion. Furthermore, we showed that α‐actinin 1, cofilin and gelsolin contributed to these phenotypic changes, and these three proteins were determined to be downstream targets of the WT1 17AA(–)/KTS(–) isoform.
One fundamental feature of cancer is the ability to invade into adjacent tissues and migrate to distant organs. Enhanced cell migration and decreased cell matrix adhesion play critical roles in the invasive phenotypes of cancer cells. Because actin stress fibers and focal adhesions provide basic infrastructure for the maintenance of cell morphology and function, their regulation is important to determine cell behaviors such as migration and cell matrix adhesion. In the present study, constitutive expression of the WT1 17AA(–)/KTS(–) isoform reduced focal adhesions and decreased actin stress fibers in TYK cells. WT1 17AA(–)/KTS(–) isoform‐transduced TYK cells showed suppressed cell–substratum adhesion, enhanced cell migration and increased in vitro invasion. These results indicate that the WT1 17AA(–)/KTS(–) isoform has the ability to modulate cytoskeletal dynamics, allowing cancer cells to develop more invasive phenotypes. As far as we know, these results show for the first time that the WT1 gene exerts its oncogenic functions through cytoskeletal modulation.
The mechanisms by which the WT1 17AA(–)/KTS(–) isoform regulates cytoskeletal structures of cancer cells are important for understanding its oncogenic functions in enhancing cell migration and invasion, and in suppressing cell–substratum adhesion. α‐Actinin 1 is considered to play a pivotal role in the formation and maintenance of focal adhesions,( 35 ) and both gelsolin and cofilin play important roles in the dynamics of actin filament assembly, disassembly and organization.( 36 ) In the present study, we showed that expression of α‐actinin 1 and cofilin was suppressed by constitutive expression of the WT1 17AA(–)/KTS(–) isoform, and that in opposition, stable coexpression of α‐actinin 1 and cofilin restored WT1 17AA(–)/KTS(–) isoform‐transduced cells to a phenotype comparable to that of parent TYK cells in terms of morphology, cell–substratum adhesion and cell migration and invasion. Moreover, the present study showed that gelsolin expression was increased by constitutive expression of WT1 17AA(–)/KTS(–) and that in opposition, suppression of gelsolin expression by siRNA in WT1 17AA(–)/KTS(–) isoform‐transduced cells reduced cell migration to a level comparable to that of parent TYK cells. These results indicate that α‐actinin 1, cofilin and gelsolin are located downstream of the WT1 17AA(–)/KTS(–) isoform and act as its effectors in modulating cytoskeletal dynamics (Fig. 8).
The WT1 gene is spliced alternatively at two sites, the 17AA site and the KTS site, yielding four isoforms: 17AA(+)/KTS(+), 17AA(+)/KTS(–), 17AA(–)/KTS(+) and 17AA(–)/KTS(–). It is not known why only the WT1 17AA(–)/KTS(–) isoform can modulate cytoskeletal dynamics. Cytoskeletal regulatory functions of the WT1 17AA(–)/KTS(–) isoform were exerted through regulation of the expression levels of α‐actinin 1, cofilin and gelsolin. These results indicate that the cytoskeletal regulatory functions of WT1 17AA(–)/KTS(–) may be dependent on its transcriptional regulatory abilities. The KTS(–)WT1 isoforms bind to DNA with higher affinity and appear to be more active in transcriptional regulation than the KTS(+) WT1 isoforms.( 37 , 38 ) The 17AA region at a splicing site can regulate the activity of WT1 as a transcriptional factor,( 39 ) suggesting the existence of functional regulatory mechanisms through this 17AA region. Thus, the WT1 17AA(–)/KTS(–) isoform, lacking both splicing sites, may have features such as high affinity to DNA and loss of control through the 17AA region. These features might explain the abilities of WT1 17AA(–)/KTS(–) as a transcriptional regulator to affect directly or indirectly the expression levels of α‐actinin 1, cofilin and gelsolin and to consequently modulate cytoskeletal structures.
All of the four WT1 isoforms were expressed in primary human solid cancers, including lung cancer,( 11 ) HNSCC,( 18 ) sarcoma( 19 ) and human primary leukemia.( 29 ) Although only the WT1 17AA(–)/KTS(–) isoform induced phenotypic changes in the present study, involvement of the other WT1 isoforms has been reported. Among the four WT1 isoforms, the WT1 17AA(+)/KTS(+) isoform was expressed dominantly in all of the cancers examined. Results of previous studies showing that constitutive expression of the WT1 17AA(+)/KTS(+) isoform rescues the growth inhibitory effect of WT1 antisense oligomers on cancer cells,( 26 ) and that suppression of WT1 17AA(+) isoforms by the 17AA region‐specific ribozyme inhibits the growth of cancer cells indicate the contribution of the WT1 17AA(+)/KTS(+) isoform to the growth of cancer cells.( 40 ) As for the functions of the WT1 17AA(+)/KTS(–) isoform, results showing that lck promoter‐driven WT1 17AA(+)/KTS(–)‐transgenic mice block differentiation of T‐lymphoid progenitor cells indicates involvement of the WT1 17AA(+)/KTS(–) isoform in the tumorigenesis of lymphoid malignancy.( 41 ) However, the function of the 17AA(–)/KTS(+) isoform remains unclear. These results raise the possibility that each WT1 isoform plays a different oncogenic role, depending on the cellular context of various types of cancer cells.
In conclusion, the WT1 gene 17AA(–)/KTS(–) isoform modulates cytoskeletal dynamics and may contribute to the development of various types of cancers. The present results should provide a novel insight into the signaling pathway of the WT1 gene for its oncogenic functions.
Acknowledgments
We thank Mr Y. Takagi (Imaging section, Osaka Medical Center for Cancer and Cardiovascular Diseases) for his assistance on measurement of migration of individual cells. We also thank Dr K. Yoshioka (Department of Biology, Osaka Medical Center for Cancer and Cardiovascular Diseases) and Dr T. Sotobori (Department of Orthopaedic Surgery, Osaka University Graduate School of Medicine) for their technical advice. This work was supported in part by a Grant‐in‐Aid from the Ministry of Education, Science, Sports, Culture and the Ministry of Health, Labour, and Welfare, Japan and the Charitable Trust Osaka Cancer Researcher‐Fund.
References
- 1. Call KM, Glaser T, Ito CY et al. Isolation and characterization of a zinc finger polypeptide gene at the human chromosome 11 Wilms’ tumor locus. Cell 1990; 60: 509–20. [DOI] [PubMed] [Google Scholar]
- 2. Gashler AL, Bonthron DT, Madden SL, Rauscher FJ 3rd, Colins T, Sukhatme VP. Human platelet‐derived growth factor A chain is transcriptionally repressed by the Wilms tumor suppressor WT1. Proc Natl Acad Sci USA 1992; 89: 10 984–8. [DOI] [PMC free article] [PubMed] [Google Scholar]
- 3. Harrington MA, Konicek B, Song A, Xia XL, Fredericks WJ, Rauscher FJ 3rd. Inhibition of colony‐stimulating factor‐1 promoter activity by the product of the Wilms’ tumor locus. J Biol Chem 1993; 268: 21 271–5. [PubMed] [Google Scholar]
- 4. Drummond IA, Madden SL, Rohwer‐Nutter P, Bell GI, Sukhatme VP, Rauscher FJ 3rd. Repression of the insulin‐like growth factor II gene by the Wilms tumor suppressor WT1. Science 1992; 257: 674–8. [DOI] [PubMed] [Google Scholar]
- 5. Werner H, Re GG, Drummond IA et al. Increased Expression of the insulin‐like growth factor I receptor gene, IGF1R, in Wilms tumor is correlated with modulation of IGF1R promoter activity by the WT1 Wilms tumor gene product. Proc Natl Acad Sci USA 1993; 90: 5828–32. [DOI] [PMC free article] [PubMed] [Google Scholar]
- 6. Goodyer P, Dehbi M, Torban E, Bruening W, Pelletier J. Repression of the retinoic acid receptor‐α gene by the Wilms’ tumor suppressor gene product, wt1. Oncogene 1995; 10: 1125–9. [PubMed] [Google Scholar]
- 7. Larsson SH, Charlieu JP, Miyagawa K et al. Subnuclear localization of WT1 in splicing or transcription factor domains is regulated by alternative splicing. Cell 1995; 81: 391–401. [DOI] [PubMed] [Google Scholar]
- 8. Davies RC, Calvio C, Bratt E, Larsson SH, Lamond AI, Hastie ND. WT1 interacts with the splicing factor U2AF65 in an isoform‐dependent manner and can be incorporated into spliceosomes. Genes Dev 1998; 12: 3217–25. [DOI] [PMC free article] [PubMed] [Google Scholar]
- 9. Niksic M, Slight J, Sanford JR, Caceres JF, Hastie ND. The Wilms’ tumour protein (WT1) shuttles between nucleus and cytoplasm and is present in functional polysomes. Hum Mol Genet 2004; 13: 463–71. [DOI] [PubMed] [Google Scholar]
- 10. Inoue K, Sugiyama H, Ogawa H et al. WT1 as a new prognostic factor and a new marker for the detection of minimal residual disease in acute leukemia. Blood 1994; 84: 3071–9. [PubMed] [Google Scholar]
- 11. Oji Y, Miyoshi S, Maeda H et al. Overexpression of the Wilms’ tumor gene WT1 in de novo lung cancers. Int J Cancer 2002; 100: 297–303. [DOI] [PubMed] [Google Scholar]
- 12. Oji Y, Yamamoto H, Nomura M et al. Overexpression of the Wilms’ tumor gene WT1 in colorectal adenocarcinoma. Cancer Sci 2003; 94: 712–17. [DOI] [PMC free article] [PubMed] [Google Scholar]
- 13. Oji Y, Yano M, Nakano Y et al. Overexpression of the Wilms’ tumor gene WT1 in esophageal cancer. Anticancer Res 2004; 24: 3103–8. [PubMed] [Google Scholar]
- 14. Loeb DM, Evron E, Patel CB et al. Wilms’ tumor suppressor gene (WT1) is expressed in primary breast tumors despite tumor‐specific promoter methylation. Cancer Res 2001; 61: 921–5. [PubMed] [Google Scholar]
- 15. Miyoshi Y, Ando A, Egawa C et al. High expression of Wilms’ tumor suppressor gene predicts poor prognosis in breast cancer patients. Clin Cancer Res 2002; 8: 1167–71. [PubMed] [Google Scholar]
- 16. Oji Y, Miyoshi Y, Koga S et al. Overexpression of the Wilms’ tumor gene WT1 in primary thyroid cancer. Cancer Sci 2003; 94: 606–11. [DOI] [PMC free article] [PubMed] [Google Scholar]
- 17. Oji Y, Nakamori S, Fujikawa M et al. Overexpression of the Wilms’ tumor gene WT1 in pancreatic ductal adenocarcinoma. Cancer Sci 2004; 95: 583–7. [DOI] [PMC free article] [PubMed] [Google Scholar]
- 18. Oji Y, Inohara H, Nakazawa M et al. Overexpression of the Wilms’ tumor gene WT1 in head and neck squamous cell carcinoma. Cancer Sci 2003; 94: 523–9. [DOI] [PMC free article] [PubMed] [Google Scholar]
- 19. Ueda T, Oji Y, Naka N et al. Overexpression of the Wilms’ tumor gene WT1 in human bone and soft‐tissue sarcomas. Cancer Sci 2003; 94: 271–6. [DOI] [PMC free article] [PubMed] [Google Scholar]
- 20. Oji Y, Suzuki T, Nakano Y et al. Overexpression of the Wilms’ tumor gene WT1 in primary astrocytic tumors. Cancer Sci 2004; 95: 822–7. [DOI] [PMC free article] [PubMed] [Google Scholar]
- 21. Sugiyama H. Cancer immunotherapy targeting WT1 protein. Int J Hematol 2002; 76: 127–32. [DOI] [PubMed] [Google Scholar]
- 22. Harada Y, Nonomura N, Nishimura K et al. WT1 gene expression in human testicular germ‐cell tumors. Mol Urol 1999; 3: 357–64. [PubMed] [Google Scholar]
- 23. Osaka M, Koami K, Sugiyama T. WT1 contributes to leukemogenesis: expression patterns in 7,12‐dimethylbenz[a]anthracene (DMBA)‐induced leukemia. Int J Cancer 1997; 72: 696–9. [DOI] [PubMed] [Google Scholar]
- 24. Yamagami T, Sugiyama H, Inoue K et al. Growth inhibition of human leukemic cells by WT1 (Wilms tumor gene) antisense oligodeoxynucleotides: implications for the involvement of WT1 in leukemogenesis. Blood 1996; 87: 2878–84. [PubMed] [Google Scholar]
- 25. Algar EM, Khromykh T, Smith SI, Blackburn DM, Bryson GJ, Smith PJ. A WT1 antisense oligonucleotide inhibits proliferation and induces apoptosis in myeloid leukaemia cell lines. Oncogene 1996; 12: 1005–14. [PubMed] [Google Scholar]
- 26. Oji Y, Ogawa H, Tamaki H et al. Expression of the Wilms’ tumor gene WT1 in solid tumors and its involvement in tumor cell growth. Jpn J Cancer Res 1999; 90: 194–204. [DOI] [PMC free article] [PubMed] [Google Scholar]
- 27. Inoue K, Tamaki H, Ogawa H et al. Wilms’ tumor gene (WT1) competes with differentiation‐inducing signal in hematopoietic progenitor cells. Blood 1998; 91: 2969–76. [PubMed] [Google Scholar]
- 28. Tsuboi A, Oka Y, Ogawa H et al. Constitutive expression of the Wilms’ tumor gene WT1 inhibits the differentiation of myeloid progenitor cells but promotes their proliferation in response to granulocyte‐colony stimulating factor (G‐CSF). Leuk Res 1999; 23: 499–505. [DOI] [PubMed] [Google Scholar]
- 29. Siehl JM, Reinwald M, Heufelder K, Menssen HD, Keilholz U, Thiel E. Expression of Wilms’ tumor gene 1 at different stages of acute myeloid leukemia and analysis of its major splice variants. Ann Hematol 2000; 83: 745–50. [DOI] [PubMed] [Google Scholar]
- 30. Salazar R, Bell SE, Davis GE. Coordinate induction of the actin cytoskeletal regulatory proteins gelsolin, vasodilator‐stimulated phosphoprotein, and profilin during capillary morphogenesis in vitro . Exp Cell Res 1999; 249: 22–32. [DOI] [PubMed] [Google Scholar]
- 31. Yu DH, Qu CK, Henegariu O, Lu X, Feng GS. Protein‐tyrosine phosphatase Shp‐2 regulates cell spreading, migration, and focal adhesion. J Biol Chem 1998; 273: 21 125–31. [DOI] [PubMed] [Google Scholar]
- 32. Grille SJ, Bellacosa A, Upson J et al. The protein kinase Akt induces epithelial mesenchymal transition and promotes enhanced motility and invasiveness of squamous cell carcinoma lines. Cancer Res 2003; 63: 2172–8. [PubMed] [Google Scholar]
- 33. Stahle M, Veit C, Bachfischer U et al. Mechanisms in LPA‐induced tumor cell migration: critical role of phosphorylated ERK. J Cell Sci 2003; 116: 3835–46. [DOI] [PubMed] [Google Scholar]
- 34. Yoshioka K, Foletta V, Bernard O, Itoh K. A role for LIM kinase in cancer invasion. Proc Natl Acad Sci USA 2003; 100: 7247–52. [DOI] [PMC free article] [PubMed] [Google Scholar]
- 35. Otey CA, Carpen O. α‐Actinin revisited: a fresh look at an old player. Cell Motil Cytoskeleton 2004; 58: 104–11. [DOI] [PubMed] [Google Scholar]
- 36. Southwick FS. Gelsolin and ADF/cofilin enhance the actin dynamics of motile cells. Proc Natl Acad Sci USA 2000; 97: 6936–8. [DOI] [PMC free article] [PubMed] [Google Scholar]
- 37. Rauscher FJ 3rd, Morris JF, Tournay OE, Cook DM, Curran T. Binding of the Wilms’ tumor locus zinc finger protein to the EGR‐1 consensus sequence. Science 1990; 250: 1259–62. [DOI] [PubMed] [Google Scholar]
- 38. Hastie ND. Life, sex, and WT1 isoforms − three amino acids can make all the difference. Cell 2001; 106: 391–4. [DOI] [PubMed] [Google Scholar]
- 39. Rupprecht HD, Drummond IA, Madden SL, Rauscher FJ 3rd, Sukhatme VP. The Wilms’ tumor suppressor gene WT1 is negatively autoregulated. J Biol Chem 1994; 269: 6198–206. [PubMed] [Google Scholar]
- 40. Hubinger G, Schmid M, Linortner S, Manegold A, Bergmann L, Maurer U. Ribozyme‐mediated cleavage of wt1 transcripts suppresses growth of leukemia cells. Exp Hematol 2001; 10: 1226–35. [DOI] [PubMed] [Google Scholar]
- 41. Li H, Oka Y, Tsuboi A et al. The lck promoter‐driven expression of the Wilms tumor gene WT1 blocks intrathymic differentiation of T‐lineage cells. Int J Hematol 2003; 77: 463–70. [DOI] [PubMed] [Google Scholar]


