

Abstract
Mucins are secreted or transmembrane glycoproteins that are expressed mainly in the digestive tract. This family of proteins has been the focus of much gastric cancer research as some transmembrane mucins are implicated in tumorigenesis and make attractive targets for cancer diagnosis and therapeutics. Mucins have also been utilized to classify gastric cancer by differentiating between gastric and intestinal phenotypes. Here we show that transmembrane mucin MUC13 is upregulated in gastric cancer. By quantitative real‐time reverse transcription‐polymerase chain reaction and immunoblot analysis, overexpression of MUC13 was verified in more than half of the samples examined. In immunohistochemical analysis, MUC13 staining was observed in 74 of 114 cases of gastric cancer (64.9%), predominantly in intestinal type (P < 0.001), and in 9 of 10 cases of intestinal metaplasia, precancerous lesions of intestinal‐type gastric cancer, but not observed in normal gastric mucosa. Moreover, MUC13 staining patterns characteristic of histological type were identified: staining was on the apical side of tubular glands in intestinal type and on the cytoplasm in diffuse type. These results suggest that MUC13 is a good differentiation marker for gastrointestinal mucosa and that it may have a causal role that correlates with two distinct gastric tumorigenesis pathways. (Cancer Sci 2005; 96: 265 –274)
Gastric cancer is the fourth most frequent cancer worldwide accounting for 10.4% of cancer deaths in 2000. (1) According to Laur’En's classification, gastric cancer is generally divided into two histological types, intestinal and diffuse, having different epidemiology, etiology and pathogenesis. (2) These types essentially correspond to differentiated and undifferentiated carcinoma, respectively. 2 , 3 , 4 Intestinal type‐gastric cancer develops from precursor lesions such as intestinal metaplasia and dysplasia following chronic infection of Helicobacter pylori, whereas there are no such lesions in diffuse‐type gastric cancer. 5 , 6 Intestinal and diffuse types have distinct genetic alternations, suggesting distinct tumorigenesis pathways; mutations in APC, β‐catenin and p53, and amplification of c‐erbB2, are frequently associated with intestinal type. 7 , 8 In contrast, mutation or methylation of E‐cadherin, and amplification of K‐sam are frequently observed in diffuse type. 8 , 9
Mucin is a glycoprotein that covers the apical surface of the trachea and gastrointestinal tract. Mucin family proteins, either secreted or transmembrane, generally have a tandem repeat of serine‐ and threonine‐rich residues that is highly O‐glycosylated. 10 , 11 In the molecular environment of aerodigestive epithelial‐cell surfaces, mucins are involved in maintaining homeostasis and therefore in promoting cell survival in respiratory or digestive conditions. (10) Some transmembrane mucins, including MUC1, MUC3 and MUC12, are subject to specific, intracellular, proteolytic cleavage at sea urchin sperm protein enterokinase agrin (SEA) modules, resulting in the generation of extracellular α‐subunits and transmembrane β‐subunits. 12 , 13 Portions of α‐subunits are reassociated with β‐subunits via the SEA module at the cell surface, and the remainder is released extracellularly. 12 , 13 Transmembrane mucins have long been implicated in cancer. For example, MUC16 was recently identified as the antigen of CA125, a widely used serum marker for ovarian cancer. (14) MUC4 potentiates tumor growth and suppresses apoptosis through interaction of its epidermal growth factor (EGF)‐like motif with ErbB2. (15) MUC1 is suggested to facilitate tumor metastasis in hematogenous spread by its mucin domain binding to ICAM‐1 on high endothelial venules cells. 16 , 17 Recent clinical trials using radioconjugates to anti‐MUC1 antibody demonstrated antitumor effects with low toxicity in breast and pancreatic cancer. 18 , 19 , 20
Microarray analysis has been applied widely to several aspects of cancer research including classification of cancer, elucidation of affected pathways and the identification of diagnostic and therapeutic targets. 21 , 22 , 23 Several previous reports on microarray analysis of gastric cancer have demonstrated that a subset of gastric cancers have characteristic gene expression signatures. 21 , 24 However, the results from each of these studies did not agree on common signatures that correlate with Laur’En's classification. (2) In an earlier study using microarrays that represented 7000 genes, (21) we identified overexpressed genes in gastric cancer. In a subsequent study of gastric cancer using microarrays for 40 000 transcripts, we investigated expression profiles of mucin family genes and found that MUC13 was upregulated in gastric cancer (Y. Hippo, unpublished data, 2002).
Recently, human MUC13 was isolated and shown to represent a novel gene encoding transmembrane mucin that is specifically expressed in digestive tract tissues from stomach to large intestine. (25) While expression of MUC13 is retained in colon carcinoma, its expression in other types of carcinoma is largely unknown. In the present study, we generated several antibodies to characterize MUC13 in gastric cancer and studied correlation of its expression with histological types. Using these highly specific antibodies we have defined novel features of the protein. (25)
Materials and Methods
Tissue samples and cell lines. Nineteen pairs of advanced gastric cancer tissues and adjacent normal gastric tissues (11 intestinal types and eight diffuse types) were obtained with informed consent from patients undergoing gastrectomy at Hamamatsu University Hospital (Hamamatsu, Japan), and Iwata City Hospital (Iwata, Japan). All the samples were frozen immediately after resection and stored at −80°C until further analysis. Gastric cancer cells OCUM‐1 and OCUM‐2 MD3 (26) were gifts from M. Yashiro (Osaka City University, Osaka, Japan). Pancreatic cancer cell PK1 was obtained from the Cell Resource Center for Biomedical Research, Tohoku University (Miyagi, Japan). Gastric cancer cell GT3TKB was ceded from the RIKEN Bioresearch Center (Tsukuba, Japan). Gastric cancer cells MKN7, MKN45, MKN74, NUGC3, NUGC4 and KATOΙΙΙ were donated from the Health Science Research Resource Bank (Tokyo, Japan). Colon cancer cell T84 was purchased from the European Collection Animal Cell Culture (Salisbury, UK). Colon cancer cells LoVo, LS513, lung cancer cell H1395 and pancreatic cancer cell Capan1 were purchased from the American Type Culture Collection (Manassas, VA, USA).
RNA extraction and reverse transcription‐polymerase chain reaction. Frozen resected specimens or cells were lysed directly in Isogen reagent (Nippon Gene, Osaka, Japan) and total RNA was extracted according to the manufacturer's instructions. cDNA was synthesized as described previously. 21 , 27 Quantitative real‐time reverse transcription‐polymerase chain reaction (RT–PCR) was carried out using SYBR Green I nucleic acid gel stain (BMA, Rockland, ME, USA) with an iCycler iQ Detection System (Bio‐Rad, Hercules, CA, USA). Primers were as follows: GCATGCGATTGCAAATCTGA and TTGAGACTGGAAGCAACGCAG for MUC13; AGAAGGAGATCACTGCCCTGGCACC and CCTGCTTGCTGATCCACATCTGCTG for β‐actin. PCR conditions were: 1 cycle of 94°C for 3 min, followed by 40 cycles at 94°C for 15 s, 63°C for 15 s and 72°C for 30 s. The expression level of MUC13 was calculated as relative ratio of MUC13 to β‐actin. For clinical samples, its relative ratio of cancer to normal specimen was indicated. RT–PCR primers were as follows: GAATTCATGAAAGCCATCATTCATCTTACTC and CTCGAGATAGTCAGGGCGGGGCATGCTGCTG for coding full length of MUC13. PCR conditions were: 1 cycle of 94°C for 3 min, followed by 35 cycles at 94°C for 15 s, 63°C for 15 s and 72°C for 30 s.
Generation of anti‐MUC13 antibodies. The putative extracellular domain of human MUC13 cDNA (corresponding to 1–491 amino acids) with a poly‐histidine tag added at the COOH terminus (MUC13/ECD‐His) was introduced into the pBlueBac4.5 baculovirus expression vector (Invitrogen, Carlsbad, CA, USA). Culture media of Sf9 cells infected with bacloviruses encoding MUC13/ECD‐His were harvested and purified using Ni‐NTA agarose according to the manufacture's protocol (Qiagen). The purified MUC13/ECD‐His protein was used as an imunogen. Mouse monoclonal antibodies (ppz0020 and ppz0025) were generated by a conventional method. (27) The polyclonal antibody ST0751 was raised against a peptide derived from the COOH terminus of human MUC13 in the same way as reported previously. (25)
For epitope mapping of these antibodies, immunoblotting was carried out using various glutathione‐S‐transferase‐fused MUC13 proteins corresponding to amino acids (fragment number): 25–126 (1), 109–211 (2), 203–328 (3), 293–392 (4), 383–443 (5), 444–512 (6), 326–365 (7) and 366–392 (8).
Immunoblot analysis. Coding for the full‐length cDNA of human MUC13, with a myc tag inserted immediately after a signal peptide, was introduced into pcDNA3.1 (which adds a V5 tag to the COOH terminus of the gene) and this construct was transiently transfected into COS7 cells using FuGENE 6 reagent (Roche Diagnostics, Mannheim, Germany).
Cells and tissues were lysed in 10 mM Tris, pH 7.4, 150 mM NaCl, 5 mM ethylenediamine tetraacetic acid, 1.0% Triton X‐100, 1.0% sodium deoxycholate, 0.1% sodium dodecylsulfate with protease inhibitor cocktail (Sigma, St Louis, MO, USA) and boiled for 10 min at 95°C with or without 0.1 M 2‐mercaptethanol (Nakalai Tesque, Kyoto, Japan). Proteins were separated on 12% sodium dodecyle sulfate‐polyacrylamide gel electrophoresis (SDS‐PAGE) and transferred to the poluvinuldene fluoride membrane Hybond P (Amersham Biosciences, Piscataway, NJ, USA). After blocking the membranes with 2% non‐fat milk in Tris‐buffered saline (TBS) containing 0.05% Tween‐20 for 1 h, the membranes were incubated with anti‐V5 antibody (1 : 5000) (Invitrogen), ppz0020 (1.0 µg/mL), ppz0025 (1.0 µg/mL), ST0751 (1.3 µg/mL) or anti‐β‐actin (1 : 10000) (Sigma) as a primary antibody. Horseradish peroxidase‐conjugated antimouse IgG antibody (1 : 5000) or antirabbit IgG antibody (1 : 5000) (Amersham Biosciences) was used as a secondary antibody, and the ECL‐PLUS Detection System (Amersham Biosciences) was used for chemiluminescent detection.
Immunocytochemical analysis. Cells were fixed in precooled 100% methanol and permeabilized in 0.2% Triton X‐100 followed by blocking with 2% non‐fat milk in TBS. ppz0020 (1.0 µg/mL) was applied as a primary antibody and incubated in a moist chamber at room temperature for 1 h. The secondary staining was carried out with fluorescein‐isothiocyanate‐labeled antimouse IgG antibody (Sigma) as secondary antibody at room temperature for 1 h. Subcellular localization of MUC13 was determined by confocal laser scan microscopy (TCS SP2 system, Leica, Bensheim, Germany). Nuclei were stained with propidium iodide.
Tissue array and immunohistochemical analysis. A tissue array composed of 114 gastric cancer specimens (56 for intestinal and 58 for diffuse type) was prepared from the archives at Tokyo University Hospital (Tokyo, Japan). Using a tissue microarrayer (Beercher Instruments, Silver Spring, MD, USA), the area of interest in the donor paraffin block was cored twice with a 2‐mm diameter needle and transferred to a recipient paraffin block. Sections of 4 µm were cut from each tissue microarray block, deparaffinized in xylene and washed in ethanol before being rehydrated in TBS. MUC13, MUC2, MUC5AC, MUC6 and CD10 were stained with the following monoclonal antibodies: ppz0020 (2.0 µg/mL) for MUC13; Ccp58 (1 : 200, Novocastra, Newcastle, UK) for MUC2; CLH2 (1 : 100, Novocastra) for MUC5AC; CLH5 (1 : 100, Novocastra) for MUC6; 56C6 (1 : 100, Novocastra) for CD10. Antigen retrieval was carried out in 10 mM pH 6.0 citrate buffer solution at 121°C for 10 min (ppz0020, Ccp2, CLH2 and CLH5) or 95°C for 40 min (56C6), and primary antibodies were applied for 1 h, followed by the secondary staining with DAKO Envision + Reagent (Dako, Cambridge, UK) for ppz0020 and DAKO LSAB2 Reagent (Dako) for the others. All sections were counterstained with Meyer's hematoxylin.
On immunostaining, distinct staining in more than 10% of the tumor cells was regarded as positive immunoreactivity. Tubular adenocarcinoma (tub) and poorly differentiated adenocarcinoma (por), or signet‐ring cell carcinoma (sig) under the Japanese Classification of Gastric Carcinoma, (28) were classified as the intestinal and diffuse types, respectively, of Laur’En (2) Blind analysis of immunohistochemistry was carried out independently by four pathologists (TS, JS, HT and YC). The results were compared and any discrepancies were resolved by consensus at a meeting after further histopathological review.
The data were analyzed by the χ2‐test and Fisher's exact test, and P < 0.01 were considered to be significant. Statistical analyses were carried out using the Stat View software package (version 5.0; Abacus Concepts, Berkeley, CA, USA).
Results
Overexpression of MUC13 mRNA in gastric cancer. To verify overexpression of MUC13 in gastric cancer as revealed by our previous microarray analysis, we carrie out quantitative real‐time RT–PCR on 10 pairs of cancer tissues and normal mucosa. Greater than two‐fold upregulation of of MUC13 expression was observed in both histological types in five of 10 paired samples (50%) (Fig. 1).
Figure 1.
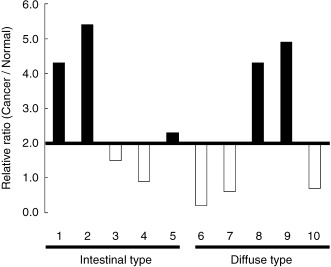
Overexpression of MUC13 in gastric cancer verified by quantitative reverse transcription‐polymerase chain reaction. Ten pairs of gastric cancer tissues and corresponding normal tissues were analyzed. Relative expression levels in cancer to normal tissue are indicated, and under 2.0 is denoted by blank and open bars, respectively. Note the expression of MUC13 was upregulated in five out of 10 pair samples, including both intestinal types and diffuse types.
Characterization of MUC13 protein. To characterize MUC13 protein in cancer, we first transfected COS7 cells with a full‐length cDNA of MUC13. Immunoblot analysis using the anti‐V5 antibody demonstrated an approximately 120 kDa protein specific for transfected cells under either reducing or non‐reducing conditions (Fig. 2a). The deduced molecular weight of the MUC13 core protein is 55 kDa, and mucin molecules generally consist of at least 50% of O‐glycosylation by weight, 11 , 29 such that O‐glycosylated matured MUC13 is predicted to have a molecular weight of more than 110 kDa, which is concordant with our results. The 120‐kDa band was also detected specifically in transfected cells with a newly generated anti‐MUC13 monoclonal antibody (ppz0020) under reducing and non‐reducing conditions, indicating the specificity of the antibody (Fig. 2a). Using this antibody, we next investigated endogenous expression of MUC13.
Figure 2.
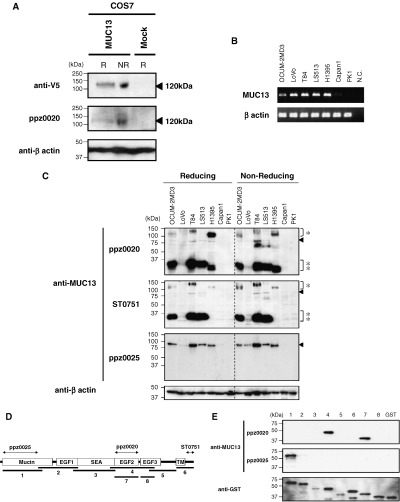
Characterization of MUC13 protein with newly generated antibodies. (a) Immunoblot analysis of transiently expressed MUC13 protein. A full‐length cDNA of MUC13 and mock vector were transiently transfected into COS7 cells, and cell lysates were subjected to immunoblot analysis by anti‐V5 (upper panel), ppz0020 (middle panel) and anti‐β‐actin (lower panel). Note that the single band migrating at 120 kDa (arrow head) was detected only in MUC13‐transfected cells under both reducing (R) and non‐reducing (NR) conditions. (b) Reverse transcription‐polymerase chain reaction (RT–PCR) analysis of MUC13 in various cell lines. Coding full length MUC13 was amplified from the cDNA of seven cell lines (OCUM‐2 MD3, LoVo, T84, LS513, H1395, Capan1 and PK1). MUC13 expression was observed in five cell lines (OCUM‐2 MD3, LoVo, T84, LS513 and H1395), but not in two cell lines (Capan1 and PK1). β‐Actin was used as an internal control. (c) Detection of endogenous MUC13 protein with various antibodies. Endogenous MUC13 proteins in the seven cell lines above were examined with ppz0020 (upper panel), ST0751 (middle panel) and ppz0025 (lower panel) under R and NR conditions. Note ppz0020‐ and ST0751‐detected bands around 120 kDa (single asterisks), 80 kDa (arrowheads) and 35 kDa (double asterisks), while ppz0025 detected only an 80‐kDa band in MUC13‐expressing cells, as revealed by RT–PCR. β‐Actin was used as a loading control. (d) Schematic diagram of the putative domain structure of MUC13. MUC13 consists of a mucin domain (Mucin), three epidermal growth factor‐like domains (EGF 1–3), sea urchin sperm protein enterokinase agrin module (SEA) and transmembrane domain (TM). The epitope of each antibody as revealed by immunoblotting below is indicated by bipolar arrows. (e) Epitope mapping of anti‐MUC13 antibodies. Eight segments of MUC13 corresponding to the diagram above were fused with glutathione‐S‐transferase (GST) and blotted with ppz0020, ppz0025 and anti‐GST. β‐Actin was used as a loading control. N.C., negative control.
We examined cell lines with high expression (OCUM‐2 MD3, LoVo, T84, LS513 and H1395) and with no or low expression (Capan1 and PK1) as revealed by RT–PCR (Fig. 2b), and detected signals solely in MUC13‐expressing cell lines (Fig. 2c). However, in addition to the expected (but faint) bands around 120 kDa, we detected additional dense bands around 35 kDa and faint bands at 80 kDa (Fig. 2c), unlike the result from ectopic expression in COS7 cells. To rule out the possibility that these additional bands were due to cross reactivity of our antibody, we examined these cell lines with two independent antibodies recognizing different epitopes. Using the polyclonal antibody ST0751, which was raised (25) against a 16‐amino acid polypeptide within a cytoplasmic domain, we obtained the same result as with the antibody ppz0020 (Fig. 2c), suggesting that these three bands were derived from MUC13.
The other monoclonal antibody (ppz0025) recognized the NH2‐terminal mucin domain, whereas ppz0020 recognized the EGF2 domain (Fig. 2e). With ppz0025, we could only detect a single 80‐kDa band in MUC13‐expressing cell lines that were more intense than with other antibodies. Because the 35‐kDa band was detected with both COOH‐terminus antibodies (ppz0020, ST0751) above but not with the NH2‐terminus antibody (ppz0025), the 35‐kDa band is likely derived from the COOH‐terminal fragment of MUC13. The 80‐kDa band, which was detected with both the NH2‐terminus and COOH‐terminus antibodies, should correspond to the full‐length form of MUC13. However, ppz0025, which did not recognize the 120‐kDa band that is supposed to be a highly O‐glycosylated form of MUC13, might have higher affinity for MUC13 without O‐glycosylation.
To investigate whether the 35‐kDa and 80‐kDa bands were derived from transcript variants, we carried out RT–PCR for full‐length MUC13 or 5′‐RACE in T84, LS513 and H1395 cells, but did not detect any variant transcripts (data not shown). Taken together, these results indicate that a major 35‐kDa protein of COOH‐terminal MUC13 (transmembrane β‐subunit) is generated through cleavage, and that the 80‐kDa protein is a core protein without O‐glycosylation.
Expression of MUC13 protein in gastric cancer. In an immunoblot analysis of clinical samples, overexpression of the 35‐kDa band in cancerous tissues was detected with ppz0020 and ST0751 in five of six pair samples (83%), and upregulation of the 80‐kDa protein was detected with ppz0025 in three of six pair samples (50%) (Fig. 3a). We observed additional 50‐kDa bands in both cancerous and non‐cancerous tissues solely with ST0751, but this band was detected regardless of MUC13 expression status as revealed by RT–PCR (Fig. 3b), strongly suggesting that it is not derived from MUC13 but is due to cross‐reactivity of the antibody.
Figure 3.
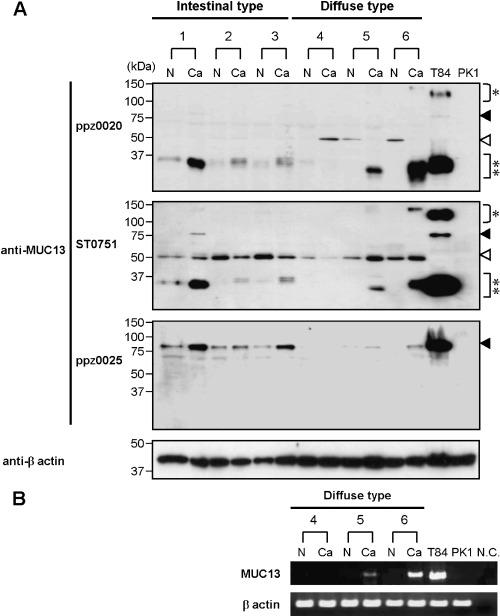
Expression of MUC13 protein in gastric cancer. (a) Detection of MUC13 protein in gastric cancer tissues. Immunoblot analysis was carried out on six pair samples of gastric cancer (Ca) and non‐cancerous (N) tissues. Two cancer cell lines, T84 and PK1, were utilized as positive and negative controls, respectively. Bands around 35 kDa (double asterisks) were detected more intensely in cancer, compared to normal, tissues in five of six pairs with ppz0020 (upper panel) and ST0751 (middle panel), and bands migrating at 80 kDa (closed arrowheads) were detected in cancer tissues in three of six pairs with ppz0025 (lower panel). 50‐kDa bands (open arrowheads) may represent cross‐reactivity associated with ppz0020 and ST0751 (see text). β‐Actin was included as a loading control. (b) Reverse transcription‐polymerase chain reaction analysis of MUC13 in gastric cancer. Three identical pairs (4–6) of gastric cancer tissues and corresponding normal tissues used in imunoblotting were analyzed. MUC13 expression was not observed in normal tissues, indicating that the 50‐kDa band detected above is due to cross‐reactivity of the antibodies. β‐Actin was included as an internal control. N.C., negative control.
Subcellular localization of MUC13 protein. To identify the subcellular localization of MUC13 protein, we first screened for gastric cancer cell lines with high expression of MUC13 by quantitative real‐time RT–PCR analysis. We observed high expression of MUC13 in OCUM‐2 MD3 and NUGC4, and moderate expression in OCUM‐1, MKN45 and KATOΙΙΙ (Fig. 4a).
Figure 4.
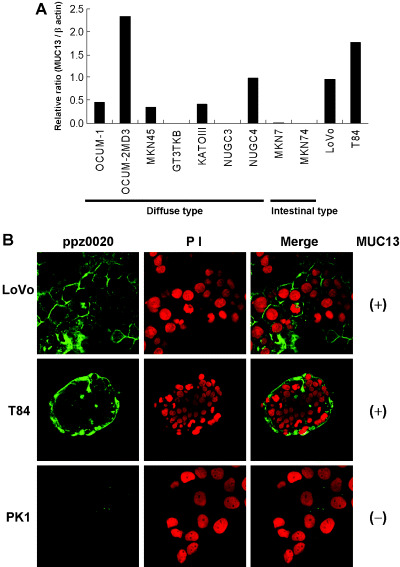
Immunocytochemical analysis of MUC13. (a) Expression of MUC13 in gastric cancer cell lines. Seven cell lines derived from diffuse‐type gastric cancer (OCUM‐1, OCUM‐2 M, MKN45, GT3TKB, KATOIII, NUGC3 and NUGC4) and two derived from intestinal‐type gastric cancer (MKN7 and MKN74) were analyzed by quantitative reverse transcription‐polymerase chain reaction. Two colon cancer cell lines (LoVo and T84) were also analyzed as references. Relative expression levels of MUC13 to β‐actin are indicated. Note the expression of MUC13 was observed in five out of nine gastric cancer cell lines, relatively high in OCUM‐2 MD3 and NUGC4, and moderate in OCUM‐1, MKN45 and KATOIII. (b) Immunocytostaining analysis of endogenous MUC13. Subcellular localization of endogenous MUC13 was observed by confocal laser scan microscopy in MUC13‐positive (+) (LoVo, T84) and MUC13‐negative (–) (PK1) cell lines. Left panel, MUC13 staining using ppz0020; middle panel, nuclei stained with propidium iodide; right panel, merged image. Note endogenous MUC13 was detected only in MUC13‐expressing cells. MUC13 was localized to the plasma membrane of each cell in LoVo (upper panel), and to that of outer layer cells in T84 (middle panel). These photomicrographs depict ×63 magnification.
We initially carried out subcellular localization analysis in five cell lines derived from diffuse‐type gastric cancer, but we could not identify the subcellular localization of MUC13 successfully despite our repeated efforts in these cells, presumably due to its low ability to attach to the glass slides. Moreover, there were no cell lines with MUC13 expression derived from intestinal‐type gastric cancer (Fig. 4a). Instead, we then carried out subcellular localization analysis of endogenous MUC13 protein in colon cancer cells LoVo and T84 in place of intestinal‐type gastric cancer that expresses MUC13, and in PK1 cells that do not. A signal detected by ppz0020 that was basically localized to the plasma membrane, as expected, was only observed in MUC13‐expressing cells (Fig. 4b). There was a slight difference in localization between LoVo and T84 cell lines: the staining was distributed evenly in the plasma membrane of each cell in LoVo, while it was enriched in the outer surface of cell islets in T84.
Immunohistochemical analysis of MUC13 protein in gastric cancer. In immunohistochemical analysis of a panel of normal gastrointestinal tissues, we observed MUC13 staining only in the small and large intestinal luminal surfaces of crypts, but not in the stomach. The luminal surfaces of intestinal metaplasia had positive staining in nine out of 10 cases (Fig. 5a–c). In contrast, the gastric foveolar epithelium had no detectable staining of MUC13.
Figure 5.
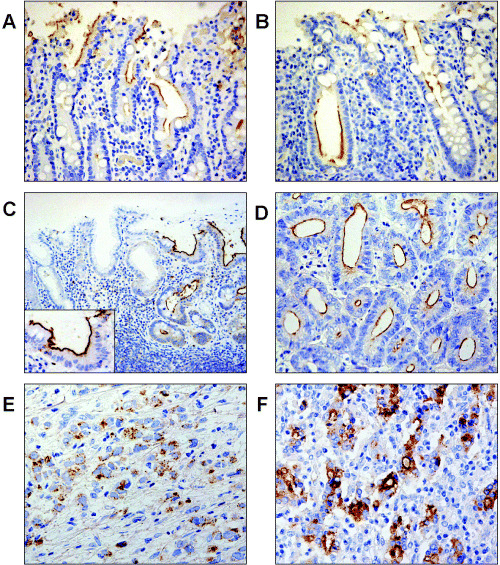
Immunohistochemical analysis of MUC13. (a–f) Immunohistochemical analysis of MUC13 in the gastrointestinal tract and in gastric cancer. Representative staining patterns are presented here. MUC13 staining was observed in the luminal surface of epithelial cells in the (a) small intestine, (b) large intestine and (c) in intestinal metaplasia of the stomach (right and inset) but not in the gastric foveolar epithelium (left). In gastric cancer, MUC13 staining was observed in (d) the apical surface of tubules of intestinal type, (e) in the cytoplasm of diffuse type and (f) in both the apical surface and cytoplasm of intestinal type with poor tubular gland formation. These photomicrographs depict (c) ×100 and (a,b,d,e) ×200 magnification.
MUC13 staining in gastric cancer tissue was positive in 74 of 114 cases (64.9%) (Table 1). MUC13 staining was not detected in any of the adjacent normal gastric mucosa from 41 cases. Interestingly, the MUC13 staining pattern was different depending on histological types: at the plasma membrane of the apical side of tubular glands in most cases of intestinal type (Fig. 5d), in the cytoplasm in diffuse type (Fig. 5e), and in both the cytoplasm and the plasma membrane at the apical side in a subset of intestinal type, where tubular gland formation is moderately irregular (Fig. 5f).
Table 1.
Correlation between MUC13 expression and clinicophathological features in gastric cancer
| Charactaristic ‡ | Feature | n | MUC13 † | χ2‐test § | |
|---|---|---|---|---|---|
| Positive | Negative | ||||
| Histology type | Intestinal | 56 | 51 | 5 | P < 0.001 |
| Diffuse | 58 | 23 | 35 | ||
| Depth of invasion | SM | 36 | 27 | 9 | NS |
| MP‐SE | 78 | 47 | 31 | ||
| LN metastasis | Negative | 48 | 32 | 16 | NS |
| Positive | 66 | 42 | 24 | ||
| pTNM stage | IA | 31 | 22 | 9 | NS |
| IB‐IV | 83 | 52 | 31 | ||
A gastric cancer tissue array composed of 114 cases was stained with ppz0020, and immunoreactivity was defined as positive when more than 10% of the cancer cells are stained.
Histology type is according to Laur’En's classification. 20
The data were analyzed by the χ2‐test and P < 0.01 were considered to be significant. LN, Lymph node. MP, muscularis propria; NS, not significant; SE, serosa; SM, submucosa.
Association of MUC13 expression with intestinal‐type gastric cancer. We next investigated the correlation between MUC13 expression and a variety of clinicopathological parameters in gastric cancer. Depths of invasion or lymph node metastasis were not correlated to MUC13 expression but, interestingly, MUC13‐positive staining was correlated significantly with intestinal types on univariate analysis (χ2‐test, P < 0.001) (Table 1).
As an alternative to Laur’En's classification, mucin expression has been used for classification of gastric cancer to distinguish between gastric and intestinal differentiation. In this mucin‐based classification, MUC2, MUC5AC, MUC6 and CD10 are used to characterize gastric cancer with differentiated mucinous phenotype: 30 , 31 , 32 MUC5AC and MUC6 are used to characterize gastric foveolar epithelium and pyloric gland, respectively, and MUC2 and CD10 for intestinal goblet cell and brush border, respectively. Notably, it was demonstrated that gastric cancer with intestinal phenotype had a better prognosis than the basic gastric phenotype. (33) In the present study, we also compared staining of MUC13 with that of four other markers. MUC5AC, MUC6, MUC2 and CD10 were stained in 58 (50.9%), 44 (38.6%), 21 (18.4%) and 21 (18.4%) cases of 114 gastric cancers on the tissue array, respectively, which was consistent with previous reports (Table 2). 33 , 34 , 35 We observed no correlation between staining of MUC13 and these four markers in gastric cancer on univariate analysis, suggesting the MUC13 is regulated differently from other mucin markers in gastric cancer.
Table 2.
Correlation between expression of MUC13 and other mucins in gastric cancer
| Mucin | Staining | n | MUC13 | χ2‐test* | |
|---|---|---|---|---|---|
| Positive | Negative | ||||
| MUC5AC | Positive | 58 | 33 | 25 | NS |
| Negative | 56 | 41 | 15 | ||
| MUC6 | Positive | 44 | 26 | 18 | NS |
| Negative | 70 | 48 | 22 | ||
| MUC2 | Positive | 21 | 14 | 7 | NS |
| Negative | 93 | 60 | 33 | ||
| CD10 | Positive | 21 | 13 | 8 | NS |
| Negative | 93 | 61 | 32 | ||
A gastric cancer tissue array composed of 114 cases was stained with each antibody. The data were analyzed by the χ2‐test and P < 0.01 was considered significant. NS, not significant.
Discussion
To study the structure and function of the MUC13 protein, we generated antibodies against MUC13: a monoclonal antibody ppz0020 raised against the extracellular domain of MUC13, and a polyclonal antibody ST0751 raised against a cytoplasmic domain of MUC13, as described in a previous report. (25) In ectopic expression of MUC13 in COS7 cells, only a single band at 120 kDa was detected with both antibodies for V5 tag and ppz0020. However, immunoblotting of MUC13‐expressing cell lines with ppz0020 and ST0751 revealed, in addition to a band around 120 kDa, bands at 80 kDa and 35 kDa, raising the possibility of post‐translational processing, rather than simple cross‐reactivity of the antibodies.
Our result was slightly, but significantly, different from that demonstrated in a previous report using virtually the same antibody and the same cell line, LS513. (25) While we detected three bands (35 kDa, 80 kDa, 120 kDa), which are essentially the same regardless of reducing or non‐reducing conditions, the earlier study by Williams et al. detected only a single band (58 kDa) under reducing conditions and two bands (47 kDa, 93 kDa) under non‐reducing conditions. (25) Because Williams et al. also obtained the same results with three antibodies against different epitopes, they claimed specificity of their antibody. However, that study did not provide any data on the immunoreactivity of their antibodies used against externally expressed MUC13, nor were any cell lines included without MUC13 expression in detecting endogenous protein. We speculate that the bands that they detected by immunoblotting might be due to cross‐reactivity. When Williams et al. carried out immunoprecipitation and subsequent lectin blotting, they detected the same 120‐kDa band, that was presumably O‐glycosylated, as we detected. Moreover, their study and the present study obtained similar results in immunohistochemical analysis of intestinal tissues, suggesting that their antibody was at least applicable for immunoblotting.
The antibody ppz0025, which recognized a different epitope from ppz0020 within the extracellular domain, unlike the above two antibodies, detected an 80‐kDa band but not a 120‐kDa band, corresponding to a putative matured O‐glycosylated form of MUC13. These results suggest that the 80‐kDa protein is an immature protein without O‐glycosylation. Considering that this is still larger than 55 kDa, the molecular weight of the MUC13 core protein deduced from its amino acid sequence, it might be subject to some post‐translational modification including N‐glycosylation. We also observed variations in the size of bands around 120 kDa, but not in that of the 80‐kDa band, suggesting variation in the extent of O‐glycosylation among cell lines.
In gastric cancer samples as well as cancer cell lines, a 35‐kDa band was the most major fragment. Because we did not detect any aberrant transcripts in MUC13‐expressing cancer cell lines, this 35‐kDa band is likely to be generated through cleavage in the extracellular domain. Many transmembrane mucins are known to be cleaved at a SEA module into NH2‐terminal α‐subunit and a membrane‐bound COOH‐terminal β‐subunit. 12 , 13 A 35‐kDa band was detected with ppz0020 and ST0751 that have epitopes in the COOH‐terminal side of the SEA module, indicating that this band represents the β‐subunit of MUC13. We were unable to detect a cleaved α‐subunit with ppz0025 in culture media of MUC13‐expressing cells. This may be due to the low affinity of ppz0025 for the highly O‐glycosylated form of the α‐subunit. As there is a chance that the α‐subunit of MUC13 can be utilized as a serum marker, we are currently trying to generate antibodies in the region where glycosylation would have little effect. In addition, considering its high activity postulated in cancer cells but not in non‐cancerous COS7 cells, exactly which protease mediates the cleavage of mucin proteins merits further investigation.
Using tissue array, we demonstrated that MUC13 was frequently overexpressed in gastric cancer and intestinal metaplasia, but not expressed in normal gastric mucosa. In immunoblot analysis, MUC13 was also detected in some non‐cancerous mucosa of intestinal‐type gastric cancer. We speculate that these non‐cancerous tissues contained some intestinal metaplasia regions given the results from tissue array. Notably, and unlike any other mucins examined, 33 , 34 , 35 MUC13 expression was highly associated with intestinal‐type gastric cancer. In intestinal metaplasia, which is a premalignant lesion for intestinal‐type gastric cancer, 5 , 6 , 36 we observed staining of MUC13, together with intestinal differentiation markers MUC2 and CD10 (data not shown), in nine out of 10 cases in this study. However, only MUC13 staining was retained in most intestinal gastric cancers, unlike the other two intestinal markers, suggesting that MUC13 is causally involved in tumorigenesis rather than just a mere marker for intestinal differentiation.
Interestingly, the staining pattern of MUC13 was different between intestinal‐ and diffuse‐type gastric cancers. In intestinal type, the apical side of the tubular gland lumen was stained. This was well mimicked by immunocytostaining of T84 cells that retain cell polarity: (37) MUC13 was enriched at the surface of cells in the outer layer of cell islets, which likely correspond to the apical side in vivo. In diffuse type, MUC13 was broadly dispersed in the cytoplasm, indicating that MUC13 corresponding to the bands at 35 kDa, 80 kDa and 120 kDa that we detected in immunoblotting of diffuse‐type gastric cancer, are mis‐located in the cytoplasm. This result suggests that some additional molecules may be required to anchor MUC13 to the plasma membrane. It is well known that another transmembrane mucin, MUC1, interacts with membrane protein β‐catenin through its cytoplasmic domain. 38 , 39 , 40 We searched for an analogous β‐catenin binding motif (SXXXXXSSL) in MUC13 and found one (corresponding to 357–365 amino acids), but in an EGF2 domain that is supposed to be located extracellularly. Furthermore, we confirmed by flow cytometry using ppz0020 that this motif was outside the cells in lung cancer cell line H1395 (data not shown). However, if MUC13 is located in the cytoplasm, there is a chance that it can interact with β‐catenin through its binding motif. Moreover, E‐cadherin, another membrane molecule that binds to β‐catenin, is frequently inactivated in diffuse‐type gastric cancer, (8) possibly affecting subcellular localization of β‐catenin. Whether this interaction is present and has some role in carcinogenesis is to be investigated further.
Currently, mucin‐based classification in gastric cancer uses MUC2 and CD10 as intestinal phenotype markers. The higher positive staining rate of MUC13 compared to these two mucins in gastric cancer may support the idea that MUC13 should be used as an intestinal phenotype marker in place of these two.
In summary, we demonstrated that MUC13 is frequently overexpressed in intestinal‐type gastric cancer and that it shows distinct expression from other mucins used previously in characterization of gastric cancer. Our study also implies that MUC13 possibly has distinct roles in diffuse‐type gastric cancer. Based on this study, further analysis of MUC13 should clarify novel aspects of gastric carcinogenesis and confirm MUC13's potential as a diagnostic and therapeutic target.
Acknowledgments
We gratefully acknowledge S. Tsutsumi and S. Yamamoto for assistance in statistical analysis, and H. Meguro, J. Yagi, K. Shiina and S. Kawanabe for their excellent technical assistance. This work was supported in part by: a Grants‐in‐Aid for Scientific Research (B 13218019, 15390125) on Priority Areas (C 12217031, 12218215) and a 21st century COE grant (Hamamatsu University School of Medicine, Medical Photonics) from the Ministry of Education, Culture, Sports, Science and Technology of Japan; a Grant‐in‐Aid for Young Scientists (B 15790339) from Japan Society for the Promotion of Science; grants from The Technology Development for Analysis of Protein Expression and Interaction in Bioconsortia on R & D of new Industrial Science and environmental Policy Bureau, Ministry of Economy, Trade and Industry and delegated to New Energy Development Organization; and grants from the Ministry of Health, Labour, and Welfare of Japan, the Smoking Research Foundation, and the Foundation for Promotion of Cancer Research.
References
- 1. Parkin DM. Global cancer statistics in the year 2000. Lancet Oncol 2001; 2: 533–43. [DOI] [PubMed] [Google Scholar]
- 2. Laur’En P. The two histological main types of gastric carcinoma: diffuse and so‐called intestinal‐type carcinoma. An attempt at a histo‐clinical classification. Acta Pathol Microbiol Scand 1965; 64: 31–49. [DOI] [PubMed] [Google Scholar]
- 3. Nakamura K, Sugano H, Takagi K, Fuchigami A. Histopathological study on early carcinoma of the stomach: some considerations on the ulcer‐cancer by analysis of 144 foci of the superficial spreading carcinomas. Gann 1967; 58: 377–87. [PubMed] [Google Scholar]
- 4. Nakamura K, Sugano H, Takagi K. Carcinoma of the stomach in incipient phase: its histogenesis and histological appearances. Gann 1968; 59: 251–8. [PubMed] [Google Scholar]
- 5. Correa P, Chen VW. Gastric cancer. Cancer Surv 1994; 19–20: 55–76. [PubMed] [Google Scholar]
- 6. Peek RM Jr, Blaser MJ. Helicobacter pylori and gastrointestinal tract adenocarcinomas. Nat Rev Cancer 2002; 2: 28–37. [DOI] [PubMed] [Google Scholar]
- 7. Park WS, Oh RR, Park JY, Lee SH, Shin MS, Kim YS. Frequent somatic mutations of the beta‐catenin gene in intestinal‐type gastric cancer. Cancer Res 1999; 59: 4257–60. [PubMed] [Google Scholar]
- 8. Yokozaki H, Yasui W, Tahara E. Genetic and epigenetic changes in stomach cancer. Int Rev Cytol 2001; 204: 49–95. [DOI] [PubMed] [Google Scholar]
- 9. Becker KF, Atkinson MJ, Reich U, Becker I, Nekarda H, Siewert JR. E‐cadherin gene mutations provide clues to diffuse type gastric carcinomas. Cancer Res 1994; 54: 3845–52. [PubMed] [Google Scholar]
- 10. Hollingsworth MA, Swanson BJ. Mucins in cancer: protection and control of the cell surface. Nat Rev Cancer 2004; 4: 45–60. [DOI] [PubMed] [Google Scholar]
- 11. Dekker J, Rossen JW, Buller HA, Einerhand AW. The MUC family: an obituary. Trends Biochem Sci 2002; 27: 126–31. [DOI] [PubMed] [Google Scholar]
- 12. Parry S, Silverman HS, McDermott K, Willis A, Hollingsworth MA, Harris A. Identification of MUC1 proteolytic cleavage sites in vivo . Biochem Biophys Res Commun 2001; 283: 715–20. [DOI] [PubMed] [Google Scholar]
- 13. Wreschner DH, McGuckin MA, Williams SJ, Baruch A, Yoeli M, Ziv R. Generation of ligand–receptor alliances by ‘SEA’ module‐mediated cleavage of membrane‐associated mucin proteins. Protein Sci 2002; 11: 698–706. [DOI] [PMC free article] [PubMed] [Google Scholar]
- 14. Yin BW, Lloyd KO. Molecular cloning of the CA125 ovarian cancer antigen: identification as a new mucin, MUC16. J Biol Chem 2001; 276: 27 371–5. [DOI] [PubMed] [Google Scholar]
- 15. Komatsu M, Jepson S, Arango ME, Carothers Carraway CA, Carraway KL. Muc4/sialomucin complex, an intramembrane modulator of ErbB2/HER2/Neu, potentiates primary tumor growth and suppresses apoptosis in a xenotransplanted tumor. Oncogene 2001; 20: 461–70. [DOI] [PubMed] [Google Scholar]
- 16. Hayashi T, Takahashi T, Motoya S, Ishida T, Itoh F, Adachi M. MUC1 mucin core protein binds to the domain 1 of ICAM‐1. Digestion 2001; 63: 87–92. [DOI] [PubMed] [Google Scholar]
- 17. Rahn JJ, Shen Q, Mah BK, Hugh JC. MUC1 initiates a calcium signal after ligation by intercellular adhesion molecule‐1. J Biol Chem 2004; 279: 29 386–90. [DOI] [PubMed] [Google Scholar]
- 18. Richman CM, DeNardo SJ. Systemic radiotherapy in metastatic breast cancer using 90Y‐linked monoclonal MUC‐1 antibodies. Crit Rev Oncol Hematol 2001; 38: 25–35. [DOI] [PubMed] [Google Scholar]
- 19. Cardillo TM, Blumenthal R, Ying Z, Gold DV. Combined gemcitabine and radioimmunotherapy for the treatment of pancreatic cancer. Int J Cancer 2002; 97: 386–92. [DOI] [PubMed] [Google Scholar]
- 20. Gold DV, Modrak DE, Schutsky K, Cardillo TM. Combined 90Yttrium‐DOTA‐labeled PAM4 antibody radioimmunotherapy and gemcitabine radiosensitization for the treatment of a human pancreatic cancer xenograft. Int J Cancer 2004; 109: 618–26. [DOI] [PubMed] [Google Scholar]
- 21. Hippo Y, Taniguchi H, Tsutsumi S, Machida N, Chong JM, Fukayama M. Global gene expression analysis of gastric cancer by oligonucleotide microarrays. Cancer Res 2002; 62: 233–40. [PubMed] [Google Scholar]
- 22. Tsutsumi S, Taketani T, Nishimura K, Ge X, Taki T, Sugita K. Two distinct gene expression signatures in pediatric acute lymphoblastic leukemia with MLL rearrangements. Cancer Res 2003; 63: 4882–7. [PubMed] [Google Scholar]
- 23. Golub TR, Slonim DK, Tamayo P, Huard C, Gaasenbeek M, Mesirov JP. Molecular classification of cancer: class discovery and class prediction by gene expression monitoring. Science 1999; 286: 531–7. [DOI] [PubMed] [Google Scholar]
- 24. Jinawath N, Furukawa Y, Hasegawa S, Li M, Tsunoda T, Satoh S. Comparison of gene‐expression profiles between diffuse‐ and intestinal‐type gastric cancers using a genome‐wide cDNA microarray. Oncogene 2004; 23: 6830–44. [DOI] [PubMed] [Google Scholar]
- 25. Williams SJ, Wreschner DH, Tran M, Eyre HJ, Sutherland GR, McGuckin MA. Muc13, a novel human cell surface mucin expressed by epithelial and hemopoietic cells. J Biol Chem 2001; 276: 18 327–36. [DOI] [PubMed] [Google Scholar]
- 26. Yashiro M, Chung YS, Nishimura S, Inoue T, Sowa M. Peritoneal metastatic model for human scirrhous gastric carcinoma in nude mice. Clin Exp Metastasis 1996; 14: 43–54. [DOI] [PubMed] [Google Scholar]
- 27. Watanabe A, Hippo Y, Taniguchi H, Iwanari H, Yashiro M, Hirakawa K. An opposing view on WWOX protein function as a tumor suppressor. Cancer Res 2003; 63: 8629–33. [PubMed] [Google Scholar]
- 28. Japanese Gastric Cancer Association. Japanese classification of gastric carcinoma, 2nd English edition. Gastric Cancer 1998; 1: 10–24. [DOI] [PubMed] [Google Scholar]
- 29. Van Klinken BJ, Einerhand AW, Buller HA, Dekker J. Strategic biochemical analysis of mucins. Anal Biochem 1998; 265: 103–16. [DOI] [PubMed] [Google Scholar]
- 30. Tatematsu M, Ichinose M, Miki K, Hasegawa R, Kato T, Ito N. Gastric and intestinal phenotypic expression of human stomach cancers as revealed by pepsinogen immunohistochemistry and mucin histochemistry. Acta Pathol Jpn 1990; 40: 494–504. [DOI] [PubMed] [Google Scholar]
- 31. Kushima R, Hattori T. Histogenesis and characteristics of gastric‐type adenocarcinomas in the stomach. J Cancer Res Clin Oncol 1993; 120: 103–11. [DOI] [PubMed] [Google Scholar]
- 32. Saito A, Shimoda T, Nakanishi Y, Ochiai A, Toda G. Histologic heterogeneity and mucin phenotypic expression in early gastric cancer. Pathol Int 2001; 51: 165–71. [DOI] [PubMed] [Google Scholar]
- 33. Tajima Y, Shimoda T, Nakanishi Y, Yokoyama N, Tanaka T, Shimizu K. Gastric and intestinal phenotypic marker expression in gastric carcinomas and its prognostic significance: immunohistochemical analysis of 136 lesions. Oncology 2001; 61: 212–20. [DOI] [PubMed] [Google Scholar]
- 34. Pinto‐de‐Sousa J, David L, Reis CA, Gomes R, Silva L, Pimenta A. Mucins MUC1, MUC2, MUC5AC and MUC6 expression in the evaluation of differentiation and clinico‐biological behaviour of gastric carcinoma. Virchows Arch 2002; 440: 304–10. [DOI] [PubMed] [Google Scholar]
- 35. Pinto‐de‐Sousa J, Reis CA, David L, Pimenta A, Cardoso‐de‐Oliveira M. MUC5B expression in gastric carcinoma. Relationship with clinico‐pathological parameters and with expression of mucins MUC1, MUC2, MUC5AC and MUC6. Virchows Arch 2004; 444: 224–30. [DOI] [PubMed] [Google Scholar]
- 36. Leung WK, Lin SR, Ching JY, To KF, Ng EK, Chan FK. Factors predicting progression of gastric intestinal metaplasia: results of a randomised trial on Helicobacter pylori eradication. Gut 2004; 53: 1244–9. [DOI] [PMC free article] [PubMed] [Google Scholar]
- 37. Madara JL, Stafford J, Dharmsathaphorn K, Carlson S. Structural analysis of a human intestinal epithelial cell line. Gastroenterology 1987; 92: 1133–45. [DOI] [PubMed] [Google Scholar]
- 38. Yamamoto M, Bharti A, Li Y, Kufe D. Interaction of the DF3/MUC1 breast carcinoma‐associated antigen and beta‐catenin in cell adhesion. J Biol Chem 1997; 272: 12 492–4. [DOI] [PubMed] [Google Scholar]
- 39. Quin RJ, McGuckin MA. Phosphorylation of the cytoplasmic domain of the MUC1 mucin correlates with changes in cell–cell adhesion. Int J Cancer 2000; 87: 499–506. [DOI] [PubMed] [Google Scholar]
- 40. Wen Y, Caffrey TC, Wheelock MJ, Johnson KR, Hollingsworth MA. Nuclear association of the cytoplasmic tail of MUC1 and beta‐catenin. J Biol Chem 2003; 278: 38 029–39. [DOI] [PubMed] [Google Scholar]