Abstract
Tumor hypoxia is associated with a malignant phenotype of cancer cells and poor patient prognosis. To investigate the role of hypoxia in tumor progression, we studied the effects of hypoxia in the A549 lung adenocarcinoma cell line. First, we showed that hypoxic treatment decreased cell–cell adhesion and induced a scattering of cancer cells. Concomitant with these morphological changes, the motility of cancer cells was increased, as demonstrated by the Boyden chamber assay. Then, we used oligonucleotide array analyses to identify the genes causally related to the hypoxia‐induced motile phenotype. The results showed that the expression of approximately 100 genes was induced more than 5‐fold by hypoxia. These included (among others) epidermal growth factor receptor (EGFR), as well as other well‐known hypoxia‐induced genes, such as vascular endothelial growth factor. Immunohistochemical analyses of primary lung adenocarcinomas confirmed the induction of EGFR in tumor cells in the vicinity of necrotic areas, a histological indicator of tumor hypoxia. Remarkably, the EGFR inhibitor AG1478 (10 M) completely blocked the increased cell motility induced by hypoxia. Thus, the present study demonstrates the importance of the EGFR pathway in the increased motility of cancer cells that occurs in a hypoxic tumor environment. (Cancer Sci 2007; 98: 506–511)
Lung cancer is the leading cause of cancer mortality in the USA, Japan and other developed countries.( 1 ) Among the four major histological subtypes, the increased incidence of lung adenocarcinoma is widely recognized.( 2 ) The prognosis for lung carcinoma patients is generally poor: even if diagnosed and treated successfully, patients with stage I lung carcinoma have a 5‐year survival rate of only 70% after surgical resection.( 3 ) Currently, the molecular mechanisms underlying the progression of lung adenocarcinomas are not well understood.( 4 , 5 ) Clearly, the understanding of these mechanisms is essential in establishing more rational therapeutic approaches for the treatment of lung adenocarcinoma patients.
Epidermal growth factor receptor (EGFR) is a receptor‐type tyrosine kinase that is frequently overexpressed in lung cancer.( 6 ) Besides this overexpression, gene mutation and amplification of EGFR also occurs in lung cancer, especially in lung adenocarcinomas.( 7 , 8 , 9 , 10 , 11 ) Although it is generally assumed that EGFR is involved in tumor cell proliferation, migration and antiapoptotic signaling,( 6 ) our knowledge concerning the roles of EGFR signaling in the development and progression of lung cancer is still incomplete.
There is now increased recognition that hypoxia plays important roles in tumor biology.( 12 , 13 , 14 , 15 ) It has been shown experimentally that hypoxia induces genetic instability, promotes the selection of hypoxia‐resistant clones, and facilitates the metastasis of cancer cells.( 12 , 13 , 14 , 15 ) Also, low oxygen tension in tumors is associated with a poor prognosis for patients.( 13 ) With regard to cell motility, studies indicate that hypoxia increases the motility of cancer cells via several pathways.( 16 , 17 , 18 )
In the present study, we first show that hypoxia decreases cell–cell adhesion, induces cell scattering and enhances the migration of A549 lung adenocarcinoma cells. We also demonstrate that this motile phenotype induced by hypoxia is mediated by the EGFR pathway. Thus, the present study reveals a new role of EGFR in hypoxia‐mediated tumor progression.
Materials and Methods
Cell lines and medium. The lung adenocarcinoma cell line A549 was obtained from the Japanese Cancer Research Resources Bank (Osaka, Japan). Cells were maintained in Dulbecco's Modified Eagle's Medium supplemented with 10% fetal bovine serum, glutamine and antibiotics in a humidified atmosphere with 5% CO2 and 95% air.
Reagents. Desferrioxamine mesylate was purchased from Sigma‐Aldrich (St Louis, MO, USA). The stock solution of desferrioxamine (100 mM) was prepared in a serum‐free medium and stored at −80°C until use. EGFR inhibitor AG1478 was from BioMol (Plymouth Meeting, PA, USA). The stock solution of AG1478 (10 mM) was prepared in dimethylsulfoxide (DMSO) and stored at −80°C until use.
Hypoxic culture. To establish hypoxic conditions, cells were placed in an airtight chamber (ThermoQuant, Tokyo, Japan) that was flushed with a gas mixture of 5% CO2, 94.5% N2 and 0.5% O2. The whole airtight chamber was then placed in a CO2 incubator and the culture was continued for the indicated periods of time.
Cell counting. The effect of desferrioxamine (100 mM) on cell growth was determined by counting the cells. Briefly, cells were plated onto 10‐cm dishes and allowed to attach and spread. Two days after plating, cells were treated with desferrioxamine (100 mM), and at 24 and 48 h cells were harvested by trypsinization and counted using a hemocytometer. Control cells were also counted and compared.
Migration assay. A cell migration assay was carried out essentially as described previously( 19 ) using Biocoat cell culture inserts with 8‐m porosity polyethylene teraphthalate filters (BD Biosciences, San Jose, CA, USA). Briefly, preconfluent tumor cells were trypsinized and 5 × 10⁴ cells were plated onto the upper chamber of each culture insert. To see the effects of desferrioxamine (100 M) and/or AG1478 (10 M) on cell migration, these reagents were added into the media in both the upper and lower chambers. Preliminary experiments had shown that no cytotoxicity occurred at these concentrations as inspected under the microscope or by the trypan blue exclusion test. A control culture for experiments using AG1478 received only a vehicle (0.1% DMSO). Cells were allowed to migrate for 24 h. Then, the upper surface of the membrane was wiped to remove any non‐migratory cells. Cells that had migrated to the undersurface of the membrane were fixed with methanol, stained with Giemsa solution, and counted. To determine the number of migrated cells for individual wells, cells in five randomly chosen fields were viewed at ×400 magnification with an eyepiece equipped with a grid square, and the number of cells within the largest square was counted, and the means were calculated. The results for each culture condition were expressed as the mean ± SD of three individual wells after taking the relative ratio to the results of the control culture.
RNA extraction. Total RNA was isolated by the acid guanidium/phenol/chloroform method using TRIzol Reagent (Invitrogen, Carlsbad, CA, USA). All samples were treated with RNase‐free DNase during the isolation according to the manufacturer's protocol (Qiagen, Valencia, CA, USA). The purity and concentration of RNA were determined by spectrometry at 260 nm and 280 nm.
Oligonucleotide microarray analysis. A comprehensive gene expression analysis was carried out using an oligonucleotide microarray as described previously( 20 ) (GeneChip Human Genome U133A array; Affymetrix, Santa Clara, CA, USA). This array contained probe sets interrogating approximately 14 000 clusters from the UniGene database (Build 133). Analysis was carried out essentially according to the instructions from the Affymetrix GeneChip Expression Analysis Technical Manual. Briefly, double‐stranded cDNA was synthesized from 10 µg of total RNA with an oligo(dT)24 T7 primer using the SuperScript II System (Invitrogen). In vitro transcription was carried out to produce biotin‐labeled cRNA using a BioArray High Yield RNA Transcript Labeling Kit (Affymetrix). The biotinylated RNA was cleaned with an RNAeasy Mini Kit (Qiagen), fragmented to 50–200 nucleotides, and hybridized to the oligonucleotide microarrays. After washing, the arrays were stained with streptavidin–phycoerythrin (Molecular Probes, Eugene, OR, USA), amplified by biotinylated streptavidin (Vector Laboratories, Burlingame, CA, USA), and analyzed on an Affymetrix GeneChip Scanner 2500 to collect the image data. GeneChip Analysis Suite software 5.0 was used to calculate the signal intensity for each gene probe set on the array (expressed as an intensity value of the gene expression). Signals on each chip were scaled to a mean intensity of 100. Annotations of all filtered transcripts were updated using Affymetrix Netaffx (http://www.affymetrix.com/analysis/index.affx), based on the October 2003 annotation update.
Antibodies. Rabbit polyclonal anti‐EGFR antibody (#2232) and antiphosphorylated EGFR (P‐EGFR) antibodies (Y845 #2231 and Y1068 #2234) were purchased from Cell Signaling Technology (Danvers, MA, USA). Mouse monoclonal anti‐EGFR antibody (clone 31G7) was from BD Bioscience (Franklin Lakes, NJ, USA) and rabbit polyclonal anti‐c‐Met antibody was from IBL (Tokyo, Japan).( 19 , 21 ) Goat polyclonal anti‐actin antibody (I‐19) was from Santa Cruz Biotechnology (Santa Cruz, CA, USA). Anti‐rabbit IgG peroxidase conjugate was purchased from Amersham (Piscataway, NJ, USA) and antirabbit IgG biotin conjugate was from Vector Laboratories.
Western blot analysis. Cells were lysed in RIPA buffer consisting of 50 mmol/L Tris‐HCl (pH 7.4), 1% sodium deoxycholate, 1% NP‐40, 0.1% sodium dodecyl sulfate and a cocktail of proteinase inhibitors. Protein concentrations were determined using the DC Protein Assay kit (Bio‐Rad). For western blotting, equal amounts of protein samples were size‐separated on 8% polyacrylamide gels and electroblotted onto a polyvinylidene difluoride membrane. Nonspecific binding was blocked by immersion of the membranes for 1 h in 5% skim milk in Tris‐buffered saline (TBS) at 4°C. The membranes were washed with TBS buffer containing 0.1% Tween, incubated for 1 h at room temperature with rabbit polyclonal anti‐EGFR antibody (diluted 1/500; Cell Signaling, #2232), rabbit polyclonal antiphosphorylated EGFR antibodies (diluted 1/500; Cell Signaling #2231 and #2234), or goat polyclonal anti‐actin antibody (diluted 1/1000; Santa Cruz, I‐19), washed again, and incubated for 1 h with appropriate secondary antibodies. The antigen was detected using ECL Western Blotting Detection Reagents (Amersham) according to the manufacturer's instructions.
Lung adenocarcinoma patients and tissues. We examined 108 primary lung adenocarcinomas resected at Tokyo University Hospital between 1999 and 2002. The patients consisted of 71 men and 37 women, ranging in age from 38 to 90 years (average 65.2 years). The cases were staged according to the tumor‐node‐metastasis system adopted by the American Joint Committee on Cancer and the International Union Against Cancer.( 22 ) The cases consisted of 78 stage I (49 stage IA, 29 stage IB), 12 stage II (four stage IIA, eight stage IIB) and 17 stage III (10 stage IIIA, three stage IIIB) adenocarcinomas. There were no stage IV cases.
Immunohistochemical staining for carcinoma specimens. Immunohistochemical staining was carried out on formalin‐fixed, paraffin‐embedded tissue sections of lung adenocarcinoma specimens. Sections (5‐µm thick) were deparaffinized in xylene and rehydrated in decreasing concentrations of ethanol. Antigen retrieval was carried out by incubating the sections with 0.1% trypsin (Sigma‐Aldrich, T0646) for 1 h at room temperature (for EGFR) or by heating for 10 min at 120°C by autoclave treatment (for phosphorylated EGFR and c‐Met). After blocking endogenous peroxidase activity with a 3% aqueous H2O2 solution for 5 min, the sections were reacted with mouse monoclonal anti‐EGFR antibody (diluted 1/20), antiphosphorylated EGFR antibody (diluted 1/50), or anti‐c‐Met antibody (diluted 1/50) for 1 h at room temperature. After washing with TBS buffer, a secondary antibody (diluted 1/500) was applied for 1 h at room temperature. Subsequently, the sections were allowed to react for 30 min with an avidin–biotin–peroxidase complex (ABC) using a Vectastain ABC kit (Vector Laboratories). The DAB (3‐,3′‐diaminobenzidine tetrahydrochloride) Liquid System (Dako, Glostrup, Denmark) was used to detect the immunostaining.
In a preliminary experiment, we screened a small panel of lung adenocarcinoma cases for EGFR and p‐EGFR immunoreactivities. We chose a case that showed moderately strong immunostaining for both EGFR and p‐EGFR and used it as a positive control in subsequent immunostaining. We confirmed that this positive control gave constant results in all of the immunostaining experiments.
Immunoreactivity was evaluated by two investigators (T. N. and T. M.) and categorized following the methods of Han et al. with slight modifications.( 23 ) In brief, the percentage of EGFR‐positive tumor cells was multiplied by the dominant staining intensity pattern (1, trace; 2, weak; 3, moderate; 4, intense), and slides were classified as having negative (0, score 0–100), low (1+, score 101–200), intermediate (2+, 201–300) or high (3+, 301–400) EGFR expression. p‐EGFR was scored as positive if more than 5% of cells had granular cytoplasmic staining.( 23 )
Statistical analysis. To analyze the effect of desferrioxamine and AG1478 on cell migration, the number of migrated cells was counted and the results for each culture condition were expressed as the mean ± SD of three individual wells after taking the relative ratio to the results of the control culture. The effect of desferrioxamine on cell growth was analyzed in a similar method. The correlation between EGFR and p‐EGFR staining was analyzed by χ2‐test. The difference of EGFR and p‐EGFR staining according to the presence or absence of tumor necrosis was also analyzed by χ2‐test. The difference was considered significant when 1.0 did not belong to the 95% confidence interval of the treated or control ratio.
Results
Hypoxia increases the motility of lung adenocarcinoma cells. To examine the effects of hypoxia in lung adenocarcinomas, we treated A549 lung adenocarcinoma cells with 100 M desferrioxamine, a hypoxia‐mimetic agent. After exposure to this agent, A549 cells gradually underwent morphological changes and showed features associated with a motile phenotype: decrease in cell–cell adhesion, scattering of cell clusters, and increased number of single cells that display cytoplasmic protrusions (Fig. 1a). Also, the cells treated with desferrioxamine took on a flattened appearance. These morphological alterations were evident at 24 h, became more prominent at 48 h, and were maintained throughout the exposure to desferrioxamine. Desferrioxamine treatment also induced growth arrest in A549 cells (Fig. 1b), a phenomenon well documented in the literature.( 24 ) The cell number remained the same at 24 h and slightly decreased at 48 h following desferrioxamine treatment, whereas control cells grew 2‐ and 4‐fold at 24 and 48 h, respectively. Exposure to a hypoxic condition (0.5% O2) induced the same morphological changes with similar kinetics. As these morphological characteristics indicated increased motility, we next examined the effect of desferrioxamine on cell migration. Indeed, treatment with desferrioxamine (100 M) increased the migration of cancer cells as shown in Fig. 2.
Figure 1.
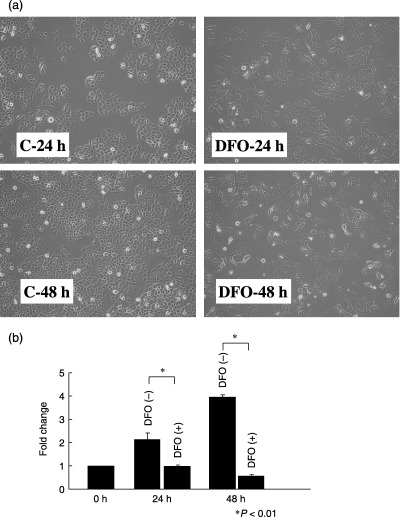
(a) The effect of the hypoxia mimetic agent desferrioxamine on the morphology of A549 cells. Control A549 cells grow in clusters, but A549 cells treated with desferrioxamine (100 M) for 24 and 48 h showed cell scattering and decreased cell–cell adhesion. (b) The effect of desferrioxamine on the growth of A549 cells. The control cells grew 2‐ and 4‐fold at 24 and 48 h, respectively. In contrast, the cell number remained the same at 24 h and slightly decreased at 48 h following desferrioxamine treatment. The data represent mean ± SD of three experiments.
Figure 2.
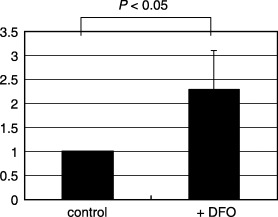
The effects of desferrioxamine on the migration of A549 cells. The migration of A549 cells was examined using the Boyden chamber assay. Treatment with desferrioxamine increased the migration of A549 cells approximately 2‐fold.
Oligonucleotide microarray analysis. To identify the genes associated with the motile phenotype induced by hypoxia, we extracted RNA from lung adenocarcinoma cells cultured either under normoxic or hypoxic conditions for 24 and 48 h, and RNA samples were subjected to a comprehensive gene expression analysis using Affymetrix Oligonucleotide Microarrays. Through this analysis we identified approximately 100 genes whose expression was induced >5‐fold and approximately 50 genes whose expression was decreased <20% by hypoxia. Among the 100 genes induced by hypoxia were well‐known hypoxia‐induced genes, such as vascular endothelial growth factor (VEGF), carbonic anhydrase IX (CA9) and tissue factor (F3), thereby validating our hypoxic culture system. The expression of genes involved in cell cycle control were also altered by hypoxia: TP53 and cyclin G2 (CCNG2) were upregulated, whereas topoisomerase IIα (TOP2A), SKP2 and polo‐like kinase (PLK) were downregulated. Alterations in the expression of these genes most likely related to the cell cycle arrest that occurs in most cells exposed to hypoxia.( 15 )
Next, we sought to identify the genes causally related to the hypoxia‐induced motile phenotype of lung adenocarcinomas. Among the 100 genes upregulated by hypoxia, EGFR caught our attention as previous studies reported frequent overexpression of EGFR in lung cancer and increased motility of cancer cells by activation of EGFR.( 6 ) Previous studies have attributed hypoxia‐induced cell motility to various molecules, such as Snail, which downregulates the cell adhesion molecule E‐cadherin,( 16 ) urokinase‐type plasminogen activator and its receptor system,( 17 ) and the tyrosine kinase c‐Met.( 18 ) Therefore, we reviewed the results of the oligonucleotide array analysis and compared the fold changes in the expressions of these genes and all of the receptor tyrosine kinase genes.( 25 ) We found no significant change in the expression of E‐cadherin (1.1‐fold change), urokinase‐type plasminogen activator (uPA) (0.52‐fold change) or the uPA receptor (2.0‐fold change). The results for receptor tyrosine kinases are shown in Fig. 3. The induction of EGFR clearly stood out among the receptor tyrosine kinases.
Figure 3.
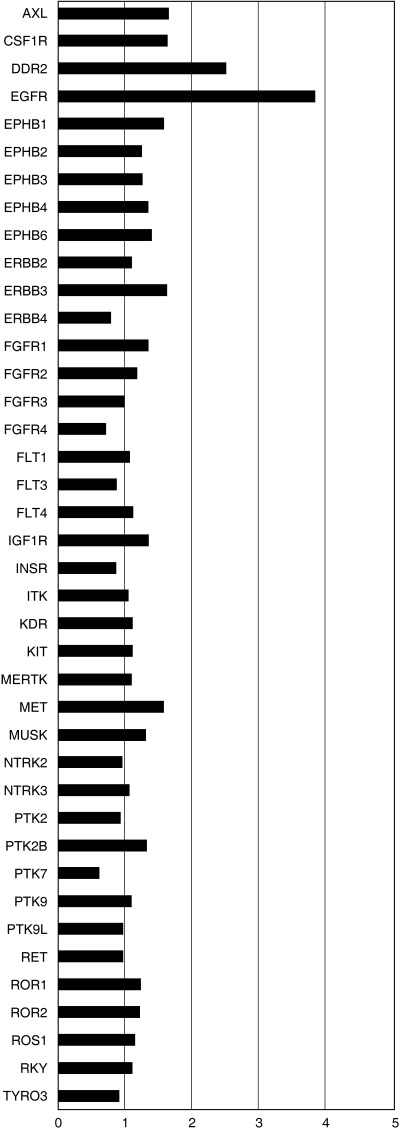
Fold changes in the mRNA levels of receptor tyrosine kinases by hypoxia. A549 cells were cultured under normoxic or hypoxic conditions for 24 and 48 h. RNA was then extracted and subjected to a comprehensive gene expression analysis using an Affymetrix U133A array. Fold changes in the expressions of all receptor tyrosine kinases (22 ) are indicated as bar graphs. Genes with minimal expression were excluded from the graph. As fold changes varied according to the probe sets for a given gene, the results represent mean values. Induction of epidermal growth factor receptor mRNA stands out among the genes shown here.
Hypoxia induces the expression of EGFR protein and its activation. To confirm the induction of EGFR by hypoxia, A549 cells were exposed to 100 M desferrioxamine for 1, 3, 8, 24 and 48 h, and the EGFR protein levels were examined by western blotting. As shown in Fig. 4, treatment with desferrioxamine induced a modest increase in the expression of the EGFR protein. The tyrosine‐phosphorylated form of EGFR was also increased in parallel with the increase in total EGFR.
Figure 4.
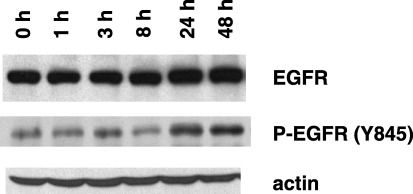
Induction of the epidermal growth factor receptor (EGFR) protein by desferrioxamine. The expression of EGFR was analyzed at the protein level by western blot analysis. Desferrioxamine induced a modest increase in the amount of EGFR protein. Increased phosphorylation of EGFR (Y845) occurred as well.
EGFR expression is enhanced in primary lung adenocarcinoma cells adjacent to necrotic areas. Tumor necrosis is associated with tumor aggressiveness and a poor patient prognosis. It is generally accepted that tumor necrosis occurs due to inadequate blood supply and lack of oxygen relative to a high oxygen demand by proliferating tumor cells. Therefore, we investigated whether EGFR expression is enhanced in primary lung adenocarcinoma cells that are adjacent to necrotic areas. To this end we immunostained sections from 108 cases of surgically resected lung adenocarcinomas using polyclonal anti‐EGFR antibody and antiphosphorylated EGFR (Y1068). Overall, positive EGFR expression (representing score 1+ to 3+) was found in 95 of the 108 cases (88.0%). Positive p‐EGFR expression (representing >5% tumor cells stained), which appeared granular in the cytoplasm,( 23 ) was found in 88 of 108 cases (81.5%). In keeping with a previous report,( 23 ) no correlation was found between EGFR and p‐EGFR expression (P = 0.355; Table 1).
Table 1.
Relationships between epidermal growth factor receptor (EGFR) and p‐EGFR staining
| p‐EGFR | n | EGFR | |||
|---|---|---|---|---|---|
| − | 1+ | 2+ | 3+ | ||
| Positive | 88 | 10 | 53 | 20 | 5 |
| Negative | 20 | 3 | 8 | 8 | 1 |
No correlation was found between the two stainings (P = 0.36). The difference between EGFR and p‐EGFR staining was analyzed by χ2‐test.
Tumor necrosis was found in 15 cases, of which 11 were positive for EGFR expression. Close examination of these 11 cases showed that in five of them, enhanced EGFR expression was observed in tumor cells adjacent to necrotic areas (Fig. 5). Of the 15 cases with tumor necrosis, nine cases were positive for p‐EGFR. Again, close examination revealed that six of nine cases showed enhanced p‐EGFR staining adjacent to necrotic areas. Although the cases with enhanced EGFR and those with enhanced p‐EGFR do not completely overlap, enhanced protein expression of EGFR was accompanied by enhanced phosphorylation of EGFR in the majorities of the cases (three of five cases).
Figure 5.
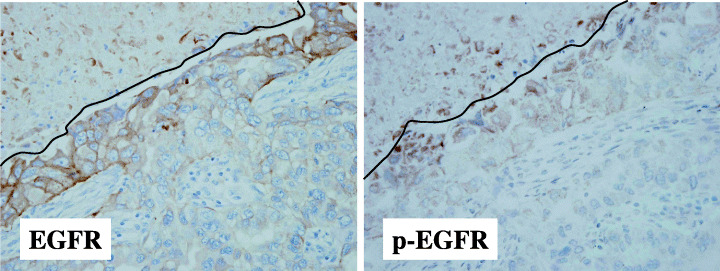
Enhanced expression of the epidermal growth factor receptor (EGFR) protein by hypoxia in primary lung adenocarcinomas. Enhanced membranous staining for EGFR was observed in tumor cells adjacent to necrotic areas, a histological indicator of tumor hypoxia. Enhanced phosphorylation of EGFR, which appeared granular in the cytoplasm, was also seen. The lines indicate the border of necrosis.
Although the positive rate of EGFR did not differ between tumors with necrosis (95/108, 88.0%) and those without necrosis (11/15, 73.3%), this was due to the fact that the scoring system for EGFR reflected the overall staining intensity and the percentage of positive cells. Because necrotic area accounted for only a minor proportion of tumors, the presence of increased staining in a narrow area adjacent to necrosis did not contribute to the scoring system in a significant way.
The expression of c‐Met was reported to be enhanced by hypoxia.( 16 ) Therefore, we also immunostained semiserial sections for c‐Met using the same set of cancer specimens, but in contrast to EGFR, no enhanced staining of c‐Met was observed in tumor cells adjacent to necrotic areas (data not shown).
EGFR inhibitor blocks hypoxia‐induced increased migration. To obtain direct evidence that enhanced EGFR is causally related to hypoxia‐induced increased motility, we examined the effects of the EGFR inhibitor AG1478. A549 cells were treated with desferrioxamine (100 M) with or without AG1478 (10 M). Cells without desferrioxamine treatment were also cultured with or without AG1478 (10 M). The results are shown in Fig. 6. Strikingly, AG1478 also completely blocked the increased migration of A549 cells treated with desferrioxamine.
Figure 6.
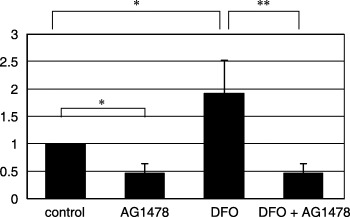
The effects of epidermal growth factor receptor inhibitor AG1478 on the desferrioxamine‐induced migration of A549 cells. Concomitant addition of AG1478 with desferrioxamine inhibited the increased migration of A549 cells by desferrioxamine. *P < 0.05, **P < 0.01.
Discussion
In the present paper we first showed that hypoxia or the hypoxia‐mimetic agent desferrioxamine induced morphological alterations that are characteristic of motile cells: cell scattering and decreased cell–cell adhesion. Increased motility was demonstrated by migration assays. Oligonucleotide microarray analysis revealed EGFR to be one of the genes upregulated by hypoxia. Because the EGFR inhibitor AG1478 strongly inhibited the increased migration of A549 cells by hypoxia, we may reasonably conclude that the EGFR pathway is essential for the hypoxia‐induced migration.
Previous studies implicated molecules other than EGFR in hypoxia‐induced motility. These molecules include Snail,( 16 ) urokinase‐type plasminogen activator and its receptor system,( 17 ) and c‐Met.( 18 ) We checked the gene expression of these molecules in our hypoxic culture model, but no significant increase was observed in the expression of these genes. Therefore, at least under our culture conditions, these molecules play only minor roles in the hypoxia‐induced motility of A549 cells. Because a given cell line may use different pathways during adaptation to a hypoxic environment, it remains unclear whether EGFR upregulation by hypoxia is a frequent phenomenon in primary lung adenocarcinomas. To answer this question, we examined the expression of EGFR protein in primary lung adenocarcinoma specimens by immunohistochemistry. Strikingly, enhanced staining of EGFR was observed in tumor cells adjacent to necrotic areas, a histological indicator of tumor hypoxia. We examined the expression of c‐Met in the same set of lung adenocarcinoma specimens, but we did not find any such staining enhancement of c‐Met.
Although we demonstrated that the EGFR pathway is essential for the hypoxia‐induced migration of A549 cells in our culture system, the mechanism for EGFR activation needs to be determined. Activation of EGFR may occur either in a ligand‐dependent or ligand‐independent manner.( 26 ) For example, a point mutation or short deletion in the kinase domain of the EGFR gene leads to constitutive activation of EGFR.( 7 , 8 ) However, this is unlikely in our present model as the A549 cells harbor no mutation of the EGFR gene.( 27 ) Instead, we speculate that EGFR activation occurs in a ligand‐dependent autocrine manner, because: (i) the addition of transforming growth factor (TGF)‐α induces cell scattering and enhanced migration of A549 cells;( 19 ) and (ii) the gene expression of TGF‐α was increased 2.5‐fold by hypoxia in A549 cells in our oligonucleotide array analysis (data not shown). Interestingly, two recent studies have indicated that autocrine activation of EGFR may confer resistance to treatment with gefitinib irrespective of gene mutations of EGFR.( 28 , 29 ) Thus, the role of hypoxia‐mediated EGFR induction in tumor progression and therapeutic resistance is an interesting issue that needs to be addressed by further investigations.
In summary, we have shown that hypoxia increases the migration of lung adenocarcinoma cells and that the EGFR pathway is essential to this hypoxia‐induced phenomenon. Further studies are warranted to elucidate the mechanisms underlying enhanced EGFR expression by hypoxia and its possible role in tumor progression and therapeutic resistance.
Acknowledgments
We thank Ms Y. Ozawa for the immunohistochemical staining of EGFR, p‐EGFR and c‐Met of lung adenocarcinoma specimens. We also thank Dr K. Uemura and Professor K. Yoshida at the Department of Forensic Medicine, University of Tokyo, for their technical advice on cell culturing under hypoxic conditions. This study was supported in part by the Vehicle Racing Commemorative Foundation, the Ministry of Health, Labor and Welfare, and a Grant‐in‐Aid for Scientific Research on Priority Areas from the Ministry of Education, Culture, Sports, Science and Technology.
References
- 1. Statistics and Information Department. Vital Statistics. Tokyo: Ministry of Health, Labor and Welfare, 2000. [Google Scholar]
- 2. Janssen‐Heijnen ML, Coebergh JW. Trends in incidence and prognosis of the histological subtypes of lung cancer in North America, Australia, New Zealand and Europe. Lung Cancer 2001; 31: 123–37. [DOI] [PubMed] [Google Scholar]
- 3. Naruke T, Tsuchiya R, Kondo H, Asamura H, Nakayama H. Implications of staging in lung cancer. Chest 1997; 112: 242S–8S. [DOI] [PubMed] [Google Scholar]
- 4. Yokota J, Kohno T. Molecular footprints of human lung cancer progression. Cancer Sci 2004; 95: 197–204. [DOI] [PMC free article] [PubMed] [Google Scholar]
- 5. Osada H, Takahashi T. Genetic alterations of multiple tumor suppressors and oncogenes in the carcinogenesis and progression of lung cancer. Oncogene 2002; 21: 7421–34. [DOI] [PubMed] [Google Scholar]
- 6. Scagliotti GV, Selvaggi G, Novello S, Hirsch FR. The biology of epidermal growth factor receptor in lung cancer. Clin Cancer Res 2004; 10: 4227S–32S. [DOI] [PubMed] [Google Scholar]
- 7. Lynch TJ, Bell DW, Sordella R et al. Activating mutations in the epidermal growth factor receptor underlying responsiveness of non‐small‐cell lung cancer to gefitinib. N Engl J Med 2004; 350: 2129–39. [DOI] [PubMed] [Google Scholar]
- 8. Paez JG, Janne PA, Lee JC et al. EGFR mutations in lung cancer: correlation with clinical response to gefitinib therapy. Science 2004; 304: 1497–500. [DOI] [PubMed] [Google Scholar]
- 9. Kosaka T, Yatabe Y, Endoh H, Kuwano H, Takahashi T, Mitsudomi T. Mutations of the epidermal growth factor receptor gene in lung cancer: biological and clinical implications. Cancer Res 2004; 64: 8919–23. [DOI] [PubMed] [Google Scholar]
- 10. Takano T, Ohe Y, Sakamoto H et al. Epidermal growth factor receptor gene mutations and increased copy numbers predict gefitinib sensitivity in patients with recurrent non‐small‐cell lung cancer. J Clin Oncol 2005; 23: 6829–37. [DOI] [PubMed] [Google Scholar]
- 11. Cappuzzo F, Hirsch FR, Rossi E et al. Epidermal growth factor receptor gene and protein and gefitinib sensitivity in non‐small‐cell lung cancer. J Natl Cancer Inst 2005; 97: 643–55. [DOI] [PubMed] [Google Scholar]
- 12. Harria AL. Hypoxia − a key regulatory factor in tumour growth. Nat Rev Cancer 2002; 2: 38–47. [DOI] [PubMed] [Google Scholar]
- 13. Le QT, Denko NC, Giaccia AJ. Hypoxic gene expression and metastasis. Cancer Metastasis Rev 2004; 23: 293–310. [DOI] [PubMed] [Google Scholar]
- 14. Vaupel P, Harrison L. Tumor hypoxia: causative factors, compensatory mechanisms, and cellular response. Oncologist 2004; 9 (Suppl 5): 4–9. [DOI] [PubMed] [Google Scholar]
- 15. Bindra RS, Glazer PM. Genetic instability and the tumor microenvironment: towards the concept of microenvironment‐induced mutagenesis. Mutat Res 2005; 569: 75–85. [DOI] [PubMed] [Google Scholar]
- 16. Pennacchietti S, Michieli P, Galluzzo M, Mazzone M, Giordano S, Comoglio PM. Hypoxia promotes invasive growth by transcriptional activation of the met protooncogene. Cancer Cell 2003; 3: 347–61. [DOI] [PubMed] [Google Scholar]
- 17. Imai T, Horiuchi A, Wang C et al. Hypoxia attenuates the expression of E‐cadherin via up‐regulation of SNAIL in ovarian carcinoma cells. Am J Pathol 2003; 163: 1437–47. [DOI] [PMC free article] [PubMed] [Google Scholar]
- 18. Mahabeleshwar GH, Kundu GC. Tyrosine kinase p56lck regulates cell motility and nuclear factor κB‐mediated secretion of urokinase type plasminogen activator through tyrosine phosphorylation of IκBα following hypoxia/reoxygenation. J Biol Chem 2003; 278: 52 598–612. [DOI] [PubMed] [Google Scholar]
- 19. Niki T, Kohno T, Iba S et al. Frequent co‐localization of cox‐2 and laminin‐5 γ2 chain at the invasive front of early‐stage lung adenocarcinomas. Am J Pathol 2002; 160: 1129–41. [DOI] [PMC free article] [PubMed] [Google Scholar]
- 20. Ishii M, Hashimoto S, Tsutsumi S et al. Direct comparison of GeneChip and SAGE on the quantitative accuracy in transcript profiling analysis. Genomics 2000; 68: 136–43. [DOI] [PubMed] [Google Scholar]
- 21. Tokunou M, Niki T, Eguchi K et al. c‐MET expression in myofibroblasts: role in autocrine activation and prognostic significance in lung adenocarcinoma. Am J Pathol 2001; 158: 1451–63. [DOI] [PMC free article] [PubMed] [Google Scholar]
- 22. Sobin L, Wittekind L. TNM Classification of Malignant Tumours. New York: John Wiley & Sons, 1997. [Google Scholar]
- 23. Han SW, Hwang PG, Chung DH et al. Epidermal growth factor receptor (EGFR) downstream molecules as response predictive markers for gefitinib (Iressa, ZD1839) in chemotherapy‐resistant non‐small cell lung cancer. Int J Cancer 2005; 113: 109–15. [DOI] [PubMed] [Google Scholar]
- 24. Green SL, Giaccia AJ. Tumor hypoxia and the cell cycle: implications for malignant progression and response to therapy. Cancer J Sci Am 1998; 4: 218–23. [PubMed] [Google Scholar]
- 25. Muller‐Tidow C, Schwable J, Steffen B et al. High‐throughput analysis of genome‐wide receptor tyrosine kinase expression in human cancers identifies potential novel drug targets. Clin Cancer Res 2004; 10: 1241–9. [DOI] [PubMed] [Google Scholar]
- 26. Cabodi S, Moro L, Bergatto E et al. Integrin regulation of epidermal growth factor (EGF) receptor and of EGF‐dependent responses. Biochem Soc Trans 2004; 32: 438–42. [DOI] [PubMed] [Google Scholar]
- 27. Shimamura T, Lowell AM, Engelman JA, Shapiro GI. Epidermal growth factor receptors harboring kinase domain mutations associate with the heat shock protein 90 chaperone and are destabilized following exposure to geldanamycins. Cancer Res 2005; 15: 6401–8. [DOI] [PubMed] [Google Scholar]
- 28. Kakiuchi S, Daigo Y, Ishikawa N et al. Prediction of sensitivity of advanced non‐small cell lung cancers to gefitinib (Iressa, ZD1839). Hum Mol Genet 2004; 13: 3029–43. [DOI] [PubMed] [Google Scholar]
- 29. Ishikawa N, Daigo Y, Takano A et al. Increases of amphiregulin and transforming growth factor‐α in serum as predictors of poor response to gefitinib among patients with advanced non‐small cell lung cancers. Cancer Res 2005; 65: 9176–84. [DOI] [PubMed] [Google Scholar]


