

Abstract
Breast cancer is the most prevalent cancer among Japanese women; however, its outcome has never been analyzed in relation to hospital volume in Japan. We utilized data from the Osaka Cancer Registry for investigating correlations between hospital volume and 10‐year survival of breast cancer patients. According to the total number of surgical procedures of breast cancer in each hospital during the period 1985–1991, we classified reporting hospitals in Osaka into four categories (high, medium, low, very low). The survival analysis was restricted to the 4333 female patients reported who were 30–64 years old, living in Osaka Prefecture (except for Osaka City), and for whom active follow up was available more than 10 years after diagnosis. In total, the relative 10‐year survival was 79.7% in the high‐volume, 80.3% in the medium‐volume, 78.2% in the low‐volume, and 68.2% in the very low‐volume hospitals. After adjustment for age at diagnosis, clinical stage and clues for detection with the Cox regression model, the patients who received care in the very low‐volume hospitals had a significantly higher risk of death than those in the high‐volume hospitals. Meanwhile, no significant differences in risk were observed for the other two categories. These findings led us to conclude that the surgical volume of the hospitals did not affect the 10‐year survival rate significantly, except for the very low‐volume hospitals in Osaka, Japan. However, the study of these relationships should be continued and expanded in future to include quality of life. (Cancer Sci 2006; 97: 618–622)
Relationships between hospital surgical volume and outcome of cancer treatments are of great concern. This is because hospital volume is often regarded as an index of technical skill for cancer treatments. In a previous study,( 1 ) we reported that the relationship between hospital surgical volume and 5‐year survival for stomach cancer diminished in the 1990s, except in very low‐volume hospitals, according to data provided by the Osaka Cancer Registry (OCR). Ioka et al. reported that ovarian cancer patients who received treatment in Japanese hospitals with higher surgery volumes showed better survival rates.( 2 ) Relationships between hospital procedure volumes and the outcome of cancer treatments are, thus, likely to differ and change according to cancer site, stage and time. It is very important to analyze and monitor these relationships regularly and extensively.
In the present paper, we assess whether hospital surgical volume is related to long‐term survival of breast cancer patients in Osaka, Japan, where breast cancer became the most prevalent cancer among women in 1996.( 3 , 4 ) Although surgery for breast cancer is neither complex nor risky, its treatment needs multidisciplinary approaches: adjuvant chemotherapy, hormonal therapy and radiotherapy after breast surgery for better quality of life and long‐term survival. We therefore focused on 10‐year survival to assess the effect of multidisciplinary treatment for breast cancer in Japan.
Subjects and Methods
Data from the OCR were used for this study. The registry work is described elsewhere.( 5 ) According to the data provided by OCR, we identified 8656 newly reported cases of breast cancer (ICD Tenth Revision, C50) that were diagnosed and treated at hospitals in Osaka Prefecture during the period 1985–1991. Of these 8656 cases, 8439 patients (97.5%) underwent surgery. Relative to the number of surgeries carried out between 1985 and 1991, each hospital was divided into four categories (high, medium, low, very low) so that each would have an approximately equal number of surgeries. In the OCR, the vital status of the registered patients was confirmed by referring to the inhabitant's registry in local municipalities, 5 and 10 years after diagnosis. However, in Osaka City active follow‐up information was not available until 1993. Survival analysis was therefore restricted to those patients who lived in Osaka Prefecture, except Osaka City where 3065 cases were identified. Furthermore, to increase the internal validity of the study, the following subjects were excluded: male breast cancers (57 cases), subsequent primary cases (223 cases) and cases aged less than 30 years (90 cases) or 65 years and over (1712 cases). Therefore in the present study, the 10‐year survival analysis was conducted for the remaining 4333 cases. The clinical stage of cancer was classified into the following three categories: (1) localized, where cancer was confined to the original organ; (2) regional, where cancer had spread to regional lymph nodes or to tissues immediately adjacent; and (3) distant, where cancer had metastasized to distant organs.
The cumulative observed survival rate was estimated using the Kaplan–Meier method relative to the hospital surgical volume. The relative 5‐year and 10‐year survival rates were calculated by the ratio of observed to expected survival, the latter being estimated with the survival probability of a Japanese population of subjects similar with respect to age, sex and calendar year at diagnosis. Here the Ederer II method was used. (6) Survival differences were analyzed by Cox's proportional hazards model adjusting for age at diagnosis and clue for detection (screening detected or not detected). The statistical software STATA (Stata Corporation, College Station, TX, USA) was used for statistical analysis. Statistical significance and 95% confidence intervals (CI) of the hazard rate ratio were obtained and judged using a two‐sided test. Use of data from the OCR was approved by the Ethical Committee of Osaka Medical Center for Cancer and Cardiovascular Diseases.
Results
Table 1 shows the number of hospitals in each surgical volume range, the number of breast cancer surgical procedures per hospital in each range and the number of patients by clinical stage. A total of 8439 cases were newly diagnosed patients who underwent surgical treatment in the 200 hospitals in Osaka Prefecture during 1985–1991. Three hospitals fell into the high‐volume range and they conducted a total of 1987 surgeries, six were categorized into the medium‐volume range with a total of 2161 surgeries, 14 were categorized into the low‐volume range with a total of 2134 surgeries, and 177 were categorized into the very low‐volume range with a total of 2157 surgeries. The average number of surgeries per hospital in the high‐volume category was 1.8 times larger than that in the medium‐volume category, 4.3 times larger than that in the low‐volume category, and 54.4 times larger than that in the very low‐volume category. The proportion of localized cases was somewhat larger in the high‐volume category than in the low‐volume category, whereas the proportion of cases in which it was unknown where the cancer was localized was minute (1–3%) in each category.
Table 1.
The number of hospitals, range of breast cancer surgical procedures per hospital and the number of patients by cancer stage
| Hospital volume | ||||
|---|---|---|---|---|
| High | Medium | Low | Very low | |
| No. hospitals | 3 | 6 | 14 | 177 |
| Total no. patients | 1987 | 2161 | 2134 | 2157 |
| Range of surgeries per hospital | 562–736 | 283–475 | 99–212 | 1–88 |
| Range of surgeries per hospital per year | 94–123 | 47–79 | 16–36 | <15 |
| Cancer stage | ||||
| Localized | 1126 (56.7%) | 1220 (56.5%) | 1139 (53.4%) | 1090 (50.5%) |
| Regional | 694 (34.9%) | 805 (37.3%) | 800 (37.5%) | 790 (36.6%) |
| Distant | 114 (5.7%) | 114 (5.3%) | 158 (7.4%) | 211 (9.8%) |
| Unknown | 53 (2.7%) | 22 (1.0%) | 37 (1.7%) | 66 (3.1%) |
Table 2 shows the mean ages of the patients analyzed for survival and the distributions of the clues for detection (screening detected or not detected) by hospital volume. The mean age was 48 years, and differences in mean age were small among the four hospital volume categories. The proportion of cases detected through screening was higher in the high‐volume and medium‐volume categories than in the lower‐volume categories.
Table 2.
Characteristics of patients analyzed by hospital volume
| Characteristics | Hospital volume | |||
|---|---|---|---|---|
| High | Medium | Low | Very low | |
| No. patients | 810 | 1281 | 1192 | 1050 |
| Mean age | ||||
| Years | 48.4 | 48.0 | 48.3 | 48.3 |
| 90% confidence interval | 47.8–48.9 | 47.5–48.4 | 47.9–48.8 | 47.8–48.8 |
| Screening detected | 58 (7.2%) | 134 (10.5%) | 28 (2.3%) | 16 (1.5%) |
| Not screening detected | 663 (81.8%) | 1079 (84.2%) | 1100 (92.3%) | 972 (92.6%) |
| Unknown | 89 (11.0%) | 68 (5.3%) | 64 (5.4%) | 62 (5.9%) |
Table 3 shows relative 5‐year and 10‐year survival rates together with hazard ratios using the high‐volume hospitals as a base with respect to clinical stage. Figure 1 shows relative survival curves of cases whose cancers were localized, according to hospital volume. Differences of relative 5‐year survival among the hospital surgical volume categories were very small: 95.3% in the high‐volume category, 95.3% in the medium‐volume category, 94.9% in the low‐volume category, and 95.1% in the very low‐volume category. However, the decrease in survival after 5 years was larger in the very low‐volume category. Although the difference was not statistically significant, relative 10‐year survival in the very low‐volume category was somewhat lower (88.7%) than that in the other categories: 90.5% for high volume, 90.2% for medium volume, and 90.4% for low volume. Figure 2 shows the relative survival curves of cases whose cancer was regional, according to hospital surgical volume. The relative survival curves were similar among the three categories high, medium and low volume, whereas relative survival in the very low category was much lower. In the very low‐volume category, 5‐year survival was lower than in the other categories, and there was a greater decrease in survival after 5 years. Patients who had undergone care in the very low‐volume hospitals had a higher risk of death than those who had received treatment in the other higher‐volume hospitals, but the risk of death in the other three categories was approximately equal.
Table 3.
Relative 10‐year survival and hazard ratio (HR) by cancer stage and hospital volume groups
| Hospital volume | ||||
|---|---|---|---|---|
| High | Medium | Low | Very low | |
| Localized | ||||
| n | 457 | 708 | 618 | 527 |
| 5‐year survival (SE) | 95.3 (1.1) | 95.3 (0.9) | 94.9 (1.0) | 95.1 (1.1) |
| 10‐year survival (SE) | 90.5 (1.6) | 90.2 (1.3) | 90.4 (1.4) | 88.7 (1.6) |
| HR † (95% CI) | 1.00 | 1.03 (0.74–1.44) | 1.00 (0.71–1.42) | 1.14 (0.80–1.62) |
| Regional | ||||
| n | 315 | 534 | 512 | 429 |
| 5‐year survival (SE) | 79.9 (2.3) | 80.6 (1.8) | 79.0 (1.9) | 68.5 (2.3) |
| 10‐year survival (SE) | 68.4 (2.7) | 71.1 (2.1) | 69.0 (2.2) | 54.7 (2.5) |
| HR † (95% CI) | 1.00 | 0.89 (0.70–1.14) | 0.99 (0.78–1.26) | 1.55 (1.22–1.96) |
| Distant | ||||
| n | 17 | 28 | 45 | 66 |
| 5‐year survival (SE) | 23.9 (10.4) | 18.8 (7.6) | 22.5 (6.3) | 15.4 (4.5) |
| 10‐year survival (SE) | 12.3 (8.2) | 7.7 (5.3) | 18.3 (5.9) | 3.1 (2.2) |
| HR † (95% CI) | 1.00 | 1.44 (0.76–2.74) | 0.98 (0.54–1.79) | 1.50 (0.85–2.64) |
| All stages | ||||
| n | 810 | 1281 | 1192 | 1050 |
| 5‐year survival (SE) | 87.4 (1.2) | 87.5 (1.0) | 85.0 (1.1) | 78.2 (1.3) |
| 10‐year survival (SE) | 79.7 (1.5) | 80.3 (1.2) | 78.2 (1.3) | 68.2 (1.5) |
| HR ‡ (95% CI) | 1.00 | 0.98 (0.82–1.18) | 1.10 (0.92–1.33) | 1.65 (1.38–1.98) |
HR adjusted for age at diagnosis and screening detected or not detected.
‡ HR adjusted for stage, age at diagnosis and screening detected or not detected. CI, confidence interval.
Figure 1.
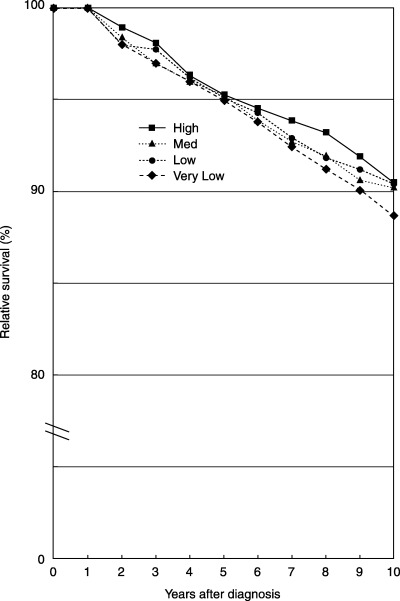
Relative survival of cases whose cancer was confined to the original organ (localized).
Figure 2.
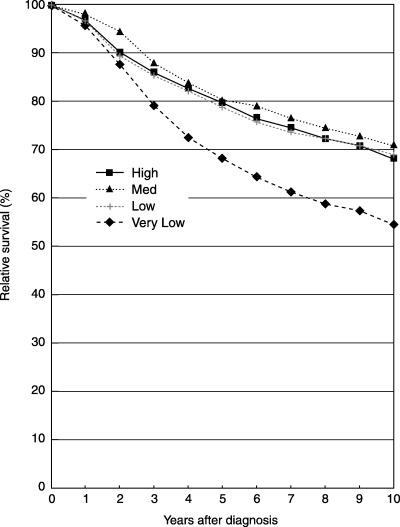
Relative survival of cases whose cancer spread to regional lymph nodes and/or immediately adjacent tissues (regional).
As shown in Table 3, multivariate analysis with Cox's proportional hazards model confirmed the above‐mentioned findings. That is, in the localized cases, hazard ratios were not significantly different among the four volume categories, whereas it was suggested that there was a slightly higher risk for the very low‐volume category. For the regional cases, hazard ratios were not different among the three higher‐volume categories; however, it was shown that there was a significantly higher risk for the very low‐volume category.
For the distant cases, the relative 5‐year survival rates were 23.9%, 18.8%, 22.5% and 15.4% for the high‐volume, medium‐volume, low‐volume and very low‐volume categories, respectively, and the relative 10‐year survival rates were 12.3%, 7.7%, 18.3% and 3.1%, respectively. The 10‐year survival rate was lower in the very low‐volume category than in the other categories, but the difference was not significant because of the relatively few number of patients analyzed. For all stages, relative 5‐year and 10‐year survival rates were higher in the three higher‐volume categories than in the very low‐volume category. After adjustment for age at diagnosis, clinical stage and clues for detection with the Cox regression model, patients receiving care in the very low‐volume hospitals had a significantly higher risk of death than those in the high‐volume hospitals.
Discussion
The findings of the present study suggest that there is no relationship between relative 10‐year survival for breast cancer and hospital volume, although lower survival was observed for the very low‐volume category. A significantly higher risk was found only in cases whose cancer had spread to the regional lymph nodes or adjacent tissues and in all stages of cancer.
Several studies from the USA have reported on the survival of breast cancer in relation to hospital volume. Roohan et al. reported that breast cancer patients treated in very low‐volume hospitals (less than 10 surgeries per year) had a greater risk of mortality than patients in high‐volume hospitals (more than 150 surgeries per year), based on the New York State hospital discharge database between 1984 and 1989.( 7 ) Their risk ratio of very low volume against high volume (1.60) was comparable to our study (1.65). However, they also found that patients treated in hospitals with low (11–50) and moderate (51–150) volumes had a higher risk of dying (30% and 19%, respectively) than patients in high‐volume hospitals. Skinner et al. evaluated 5‐year survival by annual hospital volume using the Cancer Surveillance Program database for Los Angeles County, which shows 84% in high‐volume (>125), 82% in medium‐volume (71–125), 78% in small‐volume (36–70) and 75% in very small‐volume hospitals (<35).( 8 ) They calculated the hazard ratio for each hospital category compared to the very small‐volume category: 0.77 in high‐volume hospitals, 0.78 in medium‐volume hospitals and 0.92 in small‐volume hospitals. They also reported that patients who had undergone surgery at hospitals where >125 breast cancer surgeries were carried out each year were more likely to achieve long‐term survival. In contrast, Harcourt and Hicks reported that survival for breast cancer between 1980 and 1994 did not correlate with hospital case volume (P = 0.40), based on the Blue Mountain Regional Tumor Registry.( 9 )
In our previous study on stomach cancer, there were no clear relationships between hospital volume and 5‐year survival except for in very low‐volume hospitals, after adjusting for age at diagnosis, sex and the extent of disease. These studies were carried out in Osaka Prefecture where the population density was high (4569 people/km) and the population was 8.7 million for 537 hospitals, including five university hospitals, as of the year 2000. Stomach and breast cancers are the most common forms of cancer in Japan, and surgeries for these cancers are not considered risky. Under these conditions there would be many opportunities for surgeons to carry out these operations, and medical technology and equipment is improving, in general. Standard treatments for these cancers might have been widely adopted across hospitals in Osaka Prefecture, so that hospital volume had no great influence on patient survival.
Several limitations inherent in this study should be considered before accepting any of our conclusions. First, survival differences were not analyzed with consideration of comorbidity. Satariano and Ragland reported that comorbidity in patients with breast cancer appeared to be a strong predictor of 3‐year survival.( 10 ) We restricted study patients aged less than 65 years in order to minimize the influence of comorbidity. Furthermore, the patients analyzed were young (mean age 48 years) and differences in patient age were small among the four hospital volumes. Differences in comorbid conditions among hospital volume groups therefore seemed to be small. Second, we must consider the possibility of stage migration. High‐volume hospitals might have carried out more detailed inspections and found minute infiltrations or metastases. In this case, however, survival according to the extent of disease should be higher in the high‐volume category than in the other categories. Third, the data quality of the OCR should be considered. Hospitals with poor notification completeness might have under‐reported patients who were still alive, thus underestimating survival. In this study period, the proportion of death certificate only cases was 3% for female breast cancer in the OCR, which might not have affected the result seriously. Finally, our study period fell during a time when the surgical procedure for breast cancer was changing from broad dissection to reduced dissection. In 1985 the proportions of radical mastectomy of Halsted, extended mastectomy, total mastectomy and breast‐conserving surgery were 41.1%, 23.6%, 33.2% and 0.4%, respectively, in Japan. In 1991, the proportions of the former two were reduced to 16.0% and 6.5%, whereas the latter two were increased to 64.2% and 12.7%, respectively.( 11 ) It was also reported that differences in surgical procedures did not affect survival significantly.( 12 , 13 , 14 ) Thus, our study might not reflect the level of treatment for breast cancer in terms of quality of life.
In conclusion, our study results suggest that hospital surgical volume did not affect 10‐year survival, except in very low‐volume hospitals in Osaka, Japan. However, we should continue to study these relationships and expand their scope in the future to include quality of life.
References
- 1. Nomura E, Tsukuma H, Ajiki W, Oshima A. Population‐based study of relationship between hospital surgical volume and 5‐year survival of stomach cancer patients in Osaka, Japan. Cancer Sci 2003; 94: 998–1002. [DOI] [PMC free article] [PubMed] [Google Scholar]
- 2. Ioka A, Tsukuma H, Ajiki W, Oshima A. Influence of hospital procedure volume on ovarian cancer survival in Japan, a country with low incidence of ovarian cancer. Cancer Sci 2004; 95: 233–7. [DOI] [PMC free article] [PubMed] [Google Scholar]
- 3. Research Group for Population‐Based Cancer Registration in Japan. Cancer incidence and incidence rates in Japan in 1999: Estimates based on data from 11 population‐based cancer registries. Jpn J Clin Oncol 2004; 34: 352–6. [DOI] [PubMed] [Google Scholar]
- 4. Parkin DM, Whelan SL, Ferlay J, Teppo L, Thomas DB. Cancer Incidence in Five Continents, Volume VIII. IARC Scientific Publications No. 155. Lyon, France: International Agency for Research on Cancer, 2002. [Google Scholar]
- 5. Ajiki W, Tsukuma H, Oshima A. Trends in cancer incidence and survival in Osaka. In: Tajima K, Kuroishi T, Oshima A, eds. Cancer Mortality and Morbidity Statistics: Japan and the World, 2004. Gann Monograph on Cancer Research no. 51. Tokyo: Japan Science Society Press, 2004; 137–63. [Google Scholar]
- 6. Ederer F, Axtell LM, Cutler SJ. The relative survival rate: a statistical methodology. In: National Cancer Institute Monograph no. 6, Cancer: End Results and Mortality Trends. Washington: National Cancer Institute, 1961; 121. [PubMed] [Google Scholar]
- 7. Roohan PJ, Bickll NA, Baptiste MS, Therriault GD, Ferrara EP, Siu AL. Hospital volume differences and five‐year survival from breast cancer. Am J Public Health 1998; 88: 454–7. [DOI] [PMC free article] [PubMed] [Google Scholar]
- 8. Skinner KA, Helsper JT, Deapen D, Ye Y, Sporst R. Breast cancer: Do specialists make a difference? Ann Surg Oncol 2003; 10: 606–15. [DOI] [PubMed] [Google Scholar]
- 9. Harcourt KF, Hicks KL. Is there a relationship between case volume and survival in breast cancer? Am J Surg 2003; 185: 407–10. [DOI] [PubMed] [Google Scholar]
- 10. Satariano WA, Ragland DR. The effect of comorbidity on 3‐year survival of women with primary breast cancer. Ann Intern Med 1994; 120: 104–10. [DOI] [PubMed] [Google Scholar]
- 11. Japanese Breast Cancer Society. Results of questionnaires concerning breast cancer surgery in Japan: An update in 2000. Breast Cancer 2002; 9: 1–2. [PubMed] [Google Scholar]
- 12. Lacour J, Bucalossi P, Cacers E et al. Radical mastectomy plus internal mammary dissection. Five‐year results of an internal cooperative study. Cancer 1976; 37: 206–14. [DOI] [PubMed] [Google Scholar]
- 13. Fisher B, Redmond C, Fisher ER et al. Ten‐year results of a randomized clinical trial comparing radical mastectomy and total mastectomy with or without radiation. N Engl J Med 1985; 312: 674–81. [DOI] [PubMed] [Google Scholar]
- 14. Fisher B, Anderson S, Redmond C, Wolmark N, Wickerham DL, Cronin WM. Reanalysis and results after 12 years of follow‐up in a randomized clinical trial comparing total mastectomy with lumpectomy with or without irradiation in the treatment of breast cancer. N Engl J Med 1995; 333: 1456–61. [DOI] [PubMed] [Google Scholar]