

Abstract
The human multidrug resistance gene 1 (MDR1) encodes the plasma membrane P‐glycoprotein (P‐gp/ABCB1) that functions as an efflux pump for various anticancer agents. We recently reported that estrogens down‐regulate the expression of breast cancer resistance protein (BCRP/ABCG2). In our present study we demonstrate that estrogens also down‐regulate P‐gp expression in the MDR1‐transduced, estrogen receptor α (ER‐α)‐positive human breast cancer cells, MCF‐7/MDR and T‐47D/MDR. The P‐gp expression levels in MCF‐7/MDR cells treated with 100 pM estradiol were found to be 10–20‐fold lower than the levels in these same cells that were cultured without estradiol. In contrast, estradiol did not affect the P‐gp expression levels in the ER‐α‐negative cancer cells, MDA‐MB‐231/MDR and NCI/ADR‐RES. Estrone and diethylstilbestrol were also found to down‐regulate P‐gp in MCF‐7/MDR cells, but progesterone treatment did not produce this effect. Tamoxifen reversed the estradiol‐mediated down‐regulation of P‐gp in MCF‐7/MDR cells, suggesting that ER‐α activity is necessary for the effects of estradiol upon P‐gp. However, estradiol was found not to alter the MDR1 transcript levels in either MCF‐7/MDR and T‐47D/MDR cells, suggesting that post‐transcriptional mechanisms underlie its effects upon P‐gp down‐regulation. MCF‐7/MDR cells also showed eight‐fold higher sensitivity to vincristine when treated with 100 pM estradiol, than when treated with 1 pM estradiol. These results may serve to provide a better understanding of the expression control of ABC transporters, and possibly allow for the establishment of new cancer chemotherapy strategies that would control P‐gp expression in breast cancer cells and thereby increase their sensitivity to MDR1‐related anticancer agents. (Cancer Sci 2006; 97: 1198–1204)
P‐glycoprotein (P‐gp), also known as ABCB1, is a 170–180 kDa transmembrane glycoprotein encoded by the human multidrug resistance gene 1 (MDR1). P‐gp is also a member of the ATP‐binding cassette (ABC) transporter family and functions as an efflux pump for various structurally unrelated anticancer agents such as the vinca alkaloids, anthracyclines and taxans.( 1 , 2 , 3 , 4 ) Cancer cells transfected with MDR1 cDNA have been shown to have significantly higher resistance to vinblastine and doxorubicin than their parental cell controls.( 5 ) Moreover, the MDR1 gene expression levels in acute myelogenous leukemic cells have been correlated with a poor response to induction chemotherapy.( 6 ) MDR1 transcript levels have been shown to be generally high in untreated, intrinsically drug‐resistant tumors of the colon, kidney, liver and pancreas, and are elevated in some cancers following a relapse after chemotherapy.( 7 ) Hence, P‐gp expression is one of the most important determinants of the effectiveness of chemotherapeutic agents in the treatment of cancer.
To circumvent P‐gp‐mediated drug resistance in human malignancies, various inhibitors that competitively inhibit the P‐gp‐mediated efflux of anticancer agents have been studied.( 8 , 9 ) Another possible strategy for circumventing P‐gp‐mediated multidrug resistance would be the use of compounds that reduce its expression in cancer cells. However such compounds have not yet been reported. P‐gp is also widely expressed in normal cells and tissues, such as the liver, kidney, adrenal, intestine, placenta, and the endothelial cells at both blood–brain and blood–testis barriers.( 10 , 11 ) This suggests that P‐gp functions in the protection of these tissues from cytotoxic agents and xenobiotics. Therefore, the expression levels and activity of P‐gp in these tissues would be expected to have an impact on the blood and tissue levels of such compounds. Indeed, clinical studies of P‐gp inhibitors have now shown that they increase the plasma concentrations of P‐gp substrate anticancer agents.( 12 , 13 ) Hence, the suppression of P‐gp may also affect the pharmacokinetics of its chemotherapeutic substrates.
We previously reported that both estrogens( 14 ) and antiestrogens( 15 ) inhibit breast cancer resistance protein (BCRP)‐mediated drug resistance and subsequently showed that sulfated estrogens are physiological substrates of BCRP.( 16 , 17 ) In the course of analyzing the interaction of estrogens with BCRP, we also found that the physiological levels of estradiol (E2) down‐regulate both endogenous and exogenous BCRP expression in estrogen receptor α (ER‐α)‐positive cells by post‐transcriptional mechanisms.( 18 ) Therefore, the two effects of estrogens on BCRP, i.e. the inhibition of drug efflux and the down‐regulation of protein expression, occur by different mechanisms.( 18 , 19 ) In this study, we examined the effect of estrogens in MDR1‐transduced, ER‐α‐positive human breast cancer cells and found that they down‐regulate P‐gp expression in these cells.
Materials and Methods
Antibodies. The anti‐P‐gp antibody C219,( 20 ) anti‐glyceraldehyde‐3‐phosphate dehydrogenase (GAPDH) antibody and anti‐ER‐α antibody (NCL‐ER‐‐6F11) were obtained from Cencor (Malvern, PA), Chemicon (Temecula, CA) and Novocastra (Newcastle, UK), respectively. The peroxidase‐conjugated sheep antimouse secondary antibody was purchased from Amersham (Buckinghamshire, UK). The biotinylated F(ab′)2 fragment of the anti‐P‐gp antibody, MRK16, was prepared in our laboratory as described previously.( 21 )
Cell cultures. The estrogen‐free basal medium used in this study consists of phenol red free‐DMEM (Dulbecco's modified Eagle medium) and 7% charcoal/dextran‐treated fetal bovine serum (HyClone, Logan, UT). The human cancer cell lines MCF‐7, T‐47D, MDA‐MB‐231 and NCI/ADR‐RES were obtained from the 60 cell line panel of the National Cancer Institute (NCI, Bethesda, MD) and maintained in basal medium supplemented with 10 pM E2 at 37°C in a humidified incubator with 5% CO2. NCI/ADR‐RES was used as a control cell line that overexpresses endogenous P‐gp in the NCI cell line panel, but lacks the expression of ER‐α.( 22 ) The MCF‐7, T‐47D and MDA‐MB‐231 cell lines were transduced with HaMDR retrovirus( 23 , 24 , 25 ) and selected in 4 ng/mL vincristine for seven days. The resulting mixed populations of the transduced cells that stably expressed P‐gp were designated MCF‐7/MDR, T‐47D/MDR and MDA‐MB‐231/MDR, respectively.
Western blot analyzes of P‐gp and ER‐α. Cells were cultured in basal medium in the absence or presence of various concentrations of E2 for four days. For the Western blot analysis of P‐gp, the cells were harvested and the resulting cell pellets were resuspended in lysis buffer (10 mM Tris‐HCl [pH 8.0], 0.1% Triton X‐100, 10 mM MgSO4, 2 mM CaCl2, 1 mM 4‐[2‐aminoethyl]‐benzenesulfonylfluoride, 1% aprotinin, 1 mM dithiothreitol [DTT]). The cell lysates were obtained after freeze‐thawing and brief centrifugation, and then solubilized in sample buffer A (2% SDS, 50 mM Tris‐HCl [pH 8.0], 0.2% bromophenol blue, 5% 2‐mercaptoethanol). The solubilized proteins were separated by SDS‐PAGE, and then transferred onto nitrocellulose membranes. The membranes were incubated with the anti‐P‐gp antibody C219 (1 µg/mL) and anti‐GAPDH antibody (0.44 µg/mL), followed by a treatment with the peroxidase‐conjugated sheep antimouse secondary antibody. Membranes were subsequently developed with an Enhanced Chemiluminescence Plus detection kit (Amersham).
For the Western blot analysis of ER‐α, cell pellets were directly solubilized in sample buffer B (2% SDS, 62 mM Tris‐HCl, 10% glycerol). The solubilized proteins from 1.5 × 10⁵ cells were separated by SDS‐PAGE and then transferred onto nitrocellulose membranes. The membranes were incubated with the anti‐ER‐α antibody NCL‐ER‐‐6F11 (1:30 dilution) and anti‐GAPDH antibody (0.44 µg/mL). The membranes were then processed as described above.
Fluorescence‐activated cell sorting (FACS) analysis of P‐gp expression levels. To determine the expression levels of P‐gp on the surface of E2‐treated cells, the human‐specific monoclonal antibody, MRK16, that reacts with a cell surface epitope of P‐gp was employed. Cells were incubated in basal medium in the absence or presence of various concentrations of E2 for four days. The cells (5 × 10⁵ per test) were then incubated with or without the biotinylated F(ab′)2 fragment of MRK16 (100 µg/mL) and then washed and incubated with R‐phycoerythrin‐conjugated streptavidin (400 µg/mL; BD Biosciences, Franklin Lakes, NJ).( 25 ) The fluorescence staining levels were detected using FACS Calibur (BD Biosciences).
Reverse transcription polymerase chain reaction analysis of MDR1 mRNA. MDR1 mRNA levels were examined by reverse transcription polymerase chain reaction (RT‐PCR) analysis. Cells were incubated in basal medium in the absence or presence of various concentrations of E2 for four days. The extraction of total RNA and subsequent RT‐PCR reactions were performed using an RNeasy kit (Qiagen, Valencia, CA) and an RNA LA PCR kit (Takara, Ohtsu, Japan), respectively, according to the manufacturer's instructions. First‐strand MDR1 cDNA was synthesized with 0.3 µg of total RNA, and a 702 bp fragment of MDR1 cDNA was subsequently amplified with the following primers; forward 5′‐GATATCAATGATACAGGGTT‐3′ and reverse 5′‐TGTCCAATAGAATATTCCCC‐3′. As an internal control, amplification of GAPDH cDNA (551 bp fragment) was carried out with the following primers; forward 5′‐ATCACCATCTTCCAGGAGCGA‐3′ and reverse 5′‐GCTTCACCACCTTCTTGATGT‐3′. The PCR conditions were as follows: 95°C for 5 min; the indicated cycles of 95°C for 30 s, 55°C for 30 s, and 72°C for 1 min; and a final extension step for 7 min at 72°C.
Intracellular accumulation of rhodamine 123 and vincristine. To examine rhodamine 123 accumulation, MCF‐7 and MCF‐7/MDR cells were treated with either 1 or 100 pM E2 for four days and then trypsinized, harvested and resuspended in basal medium. These cells (1 × 10⁶ per test) were then incubated with 100 nM rhodamine 123 in basal medium supplemented with the same concentrations of E2 for 20 min at 37°C, washed twice with ice‐cold PBS, and subjected to FACS analysis using FACS Calibur.( 26 )
To examine vincristine accumulation, MCF‐7 and MCF‐7/MDR cells were seeded on 12‐well plates and cultured in basal medium in the presence of either 1 or 100 pM E2 for four days. The cells were then washed and incubated with 50 nM [3H]vincristine (5.4 Ci/mmol, Amersham) for 0.5, 10, and 30 min at 37°C in basal medium supplemented with the same concentration of E2. At specified times the cells were washed three times with ice‐cold PBS and then solubilized by the addition of 1 N NaOH. The cell extract was neutralized and the radioactivity levels were determined in a liquid scintillation counter (Aloka, Tokyo, Japan).
Drug sensitivity assay. The sensitivity of MCF‐7/MDR cells to anticancer agents was evaluated by cell growth inhibition assays. MCF‐7/MDR cells were pretreated with the indicated concentrations of E2 for two days and then treated with various concentrations of vincristine in the presence of the same concentrations of E2. After four days of vincristine treatment, the cell numbers were determined with a cell counter (Sysmex, Kobe, Japan). Data are represented as the mean ± SD from triplicate determinations. In instances where a horizontal bar is not shown, the SD is low and is contained within the symbol.
Results
Establishment of MDR1 transduced cells. In a previous study we demonstrated that estrogens down‐regulate both endogenous and exogenous BCRP expression in human breast cancer cells. In this study we initially screened the 60 cell line panel of the NCI for ER‐α and P‐gp expression. However, most of these established human breast cancer cells are estrogen‐independent and do not express ER‐α. Two estrogen‐dependent human breast cancer cell lines, MCF‐7 and T‐47D cells, expressed ER‐α (Fig. 1b) but were found not to express appreciable amounts of P‐gp (Fig. 1a). We therefore established stable MDR1‐transduced human breast cancer cell lines to examine the effects of estrogens upon the expression levels of P‐gp. In addition, we used two ER‐α‐negative cancer cells as controls. MDA‐MB‐231, which does not express P‐gp, and NCI/ADR‐RES, a doxorubicin‐selected MDR cell line( 22 , 27 ) that expresses endogenous P‐gp (Fig. 1).
Figure 1.
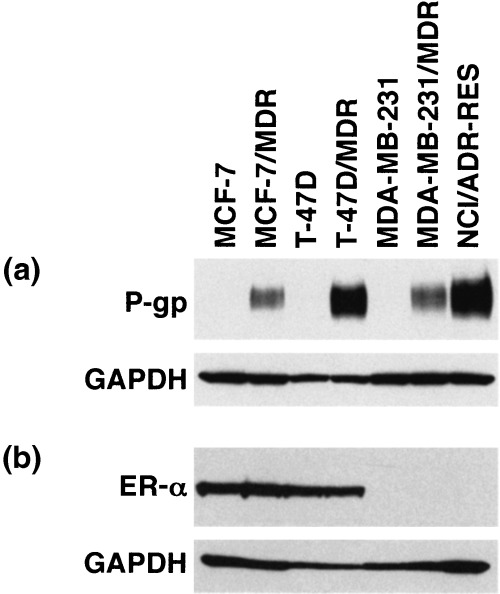
P‐glycoprotein (P‐gp) and estrogen receptor α (ER‐α) expression levels in cancer cell lines. For the detection of P‐gp, cell lysates (40 µg) were subjected to western blot analysis with the anti‐P‐gp monoclonal antibody, C219. Glyceraldehyde‐3‐phosphate dehydrogenase (GAPDH) levels were assessed as a loading control using the anti‐GAPDH monoclonal antibody. For the detection of ER‐α, whole cell lysates were subjected to western blot analysis with the anti‐ER‐α monoclonal antibody, NCL‐ER‐‐6F11, and anti‐GAPDH monoclonal antibody.
The MCF‐7/MDR, T‐47D/MDR and MDA‐MB‐231/MDR cell lines were established after transduction of the corresponding parental cells with a HaMDR retrovirus and subsequent selection of the transduced cells with vincristine. Mixed populations of the transduced cells were found to express P‐gp (Fig. 1a). In addition, the P‐gp expression levels in the transduced cells were found to be stable for at least several months.
MCF‐7, MCF‐7/MDR, T‐47D and T‐47D/MDR cells express ER‐α (Fig. 1b), indicating that MDR1 transduction did not affect the expression levels of this gene in these cells. In contrast, MDA‐MB‐231, MDA‐MB‐231/MDR and NCI/ADR‐RES cells do not express ER‐α (Fig. 1b). Furthermore, MCF‐7/MDR, T‐47D/MDR and MDA‐MB‐231/MDR cells showed significantly higher resistance to vincristine and doxorubicin than their parental cells (Table 1).
Table 1.
Drug resistance levels in MDR1‐transduced cells
| Cell line | Degree of resistance† | Estrogen receptor α expression | |
|---|---|---|---|
| Vincristine | Doxorubicin | ||
| MCF‐7/MDR | 149 ± 2.1 | 18 ± 1.8 | + |
| T‐47D/MDR | 87 ± 2.1 | 26 ± 2.4 | + |
| MDA‐MB‐231/MDR | 220 ± 1.8 | 24 ± 0.58 | – |
The degree of drug resistance is calculated as the IC50 value of the resistant cells, divided by this measurement in the parental cells. The data shown are the mean values ± SD from tripricate determinations.
Estradiol down‐regulates P‐gp expression in MDR1‐transduced cells. We next examined whether estrogens would down‐regulate P‐gp in the MCF‐7/MDR, T‐47D/MDR, MDA‐MB‐231/MDR and NCI/ADR‐RES cells. As shown in Fig. 2, exogenous P‐gp expression was predictably decreased in MCF‐7/MDR and T‐47D/MDR cells in a dose‐dependent manner, following treatment with 10 pM‐10 nM E2. MCF‐7/MDR or T‐47D/MDR cells that had been cultured in the absence of E2, and those treated with 1 pM E2, show similar levels of P‐gp expression, suggesting that this very low dose of E2 does not affect the expression levels of P‐gp. The P‐gp expression levels in MCF‐7/MDR cells treated with 100 pM E2 were between 10‐ and 20‐fold less than those in the same cells that were cultured without E2. In contrast, E2 did not alter the expression levels of P‐gp in either the MDA‐MB‐231/MDR or NCI/ADR‐RES cells (Fig. 2). These results suggest that ER‐α expression may be required for the E2‐mediated down‐regulation of P‐gp. Furthermore, since it is exogenous P‐gp that is suppressed by E2, this down‐regulation is likely to be independent of the suppression of the endogenous MDR1 promoter.
Figure 2.
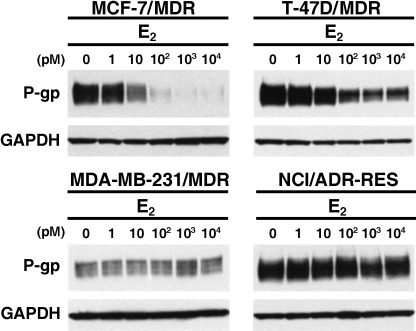
The effects of E2 on P‐glycoprotein (P‐gp) expression. The indicated cells were cultured in basal medium in the absence or presence of the indicated concentrations of E2 for 4 days. Cell lysates (40 µg) were then subjected to western blot analysis with the anti‐P‐gp monoclonal antibody, C219. Glyceraldehyde‐3‐phosphate dehydrogenase (GAPDH) levels were assessed as a loading control using the anti‐GAPDH monoclonal antibody.
The effects of estradiol on the cell surface expression of P‐gp. Because Western blot analysis revealed that E2 suppresses the expression of P‐gp in a dose‐dependent manner (Fig. 2), we further examined its effects on the cell surface expression levels of P‐gp, also by FACS analysis. Our subsequent findings demonstrated that the expression levels of P‐gp on the cell surface were considerably decreased in MCF‐7/MDR cells in a dose‐dependent manner following treatment with 10 pM‐10 nM E2 (Fig. 3). It is noteworthy that the cells treated with 100 pM‐10 nM E2 in this experiment still expressed significant amounts of P‐gp but we speculate that this may be due to the high sensitivity of the fluorescence signals when using a biotin‐streptavidin amplification system.
Figure 3.
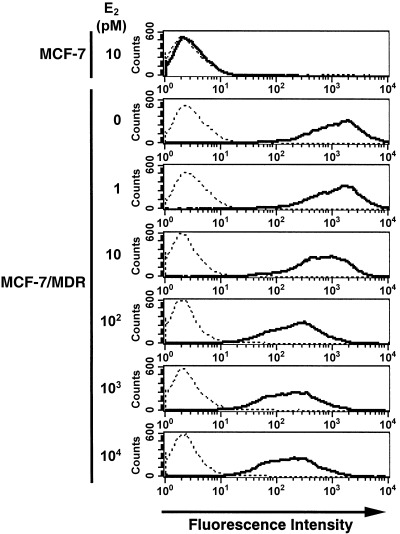
Analysis of the cell surface expression of P‐glycoprotein (P‐gp) using fluorescence‐activated cell sorting (FACS) analysis. MCF‐7/MDR cells were cultured in basal medium in the absence or presence of the indicated concentrations of E2 for 4 days. MCF‐7/MDR cells were then harvested, incubated with or without the biotinylated F(ab′)2 fragment of the anti‐P‐gp monoclonal antibody, MRK16, and then incubated with R‐phycoerythrin‐conjugated streptavidin. After washing the cells, the fluorescence intensities were determined using FACSCalibur. The bold and dotted lines indicate that the cells were incubated with and without MRK16, respectively.
The effects of estrogen and antiestrogen on P‐gp expression. We examined the effects of other estrogenic compounds, and of progesterone, upon P‐gp expression in MCF‐7/MDR cells. The expression levels of P‐gp in these cells were observed to have decreased in a dose‐dependent manner following treatment with either estrone or diethylstilbestrol (Fig. 4a). However, slightly higher concentrations of estrone or diethylstilbestrol were required to achieve similar levels of P‐gp down‐regulation, compared to E2 (2, 4). On the other hand, progesterone did not show any suppressive effects on P‐gp expression in MCF‐7/MDR cells (Fig. 4b).
Figure 4.
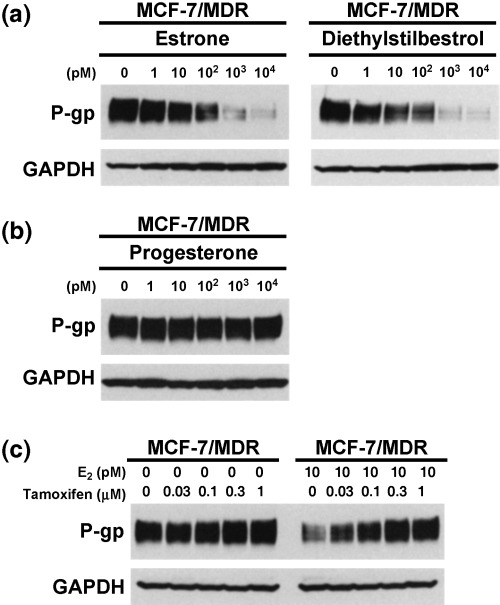
The effects of estrogens, progesterone and tamoxifen on P‐glycoprotein (P‐gp) expression levels. MCF‐7/MDR cells were cultured in basal medium in the absence or presence of the indicated concentrations of each agent for 4 days. Cell lysates (40 µg) were then subjected to western blot analysis with the anti‐P‐gp monoclonal antibody, C219, and anti‐glyceraldehyde‐3‐phosphate dehydrogenase (GAPDH) monoclonal antibody to normalize for protein loading control. (a) Effects of estrogens on P‐gp expression. (b) Effects of progesterone on P‐gp expression. (c) Effects of tamoxifen on P‐gp expression in the absence of E2 (left panel) and the reversal effects of tamoxifen on the E2‐mediated down‐regulation of P‐gp (right panel).
We next examined whether tamoxifen, an antiestrogen, could reverse the estrogen‐mediated down‐regulation of P‐gp in MCF‐7/MDR cells. In the absence of E2, tamoxifen slightly increased P‐gp expression. Significantly, in the presence of 10 pM E2, tamoxifen was found to reverse the E2‐mediated down‐regulation of P‐gp in a dose‐dependent manner (Fig. 4c). These data further suggest that estrogenic activity is required for the down‐regulation of P‐gp expression.
Estradiol does not alter MDR1 mRNA levels. We next examined the effects of E2 on MDR1 mRNA levels. RT‐PCR analyzes were carried out following the incubation of both MCF‐7/MDR and T‐47D/MDR cells in the absence or presence of various concentrations of E2 for four days. Our subsequent results revealed that the MDR1 mRNA levels were not affected by E2‐treatment in either cell type (Fig. 5). This indicates that the E2‐mediated down‐regulation of P‐gp may depend on either translational or post‐translational processes.
Figure 5.
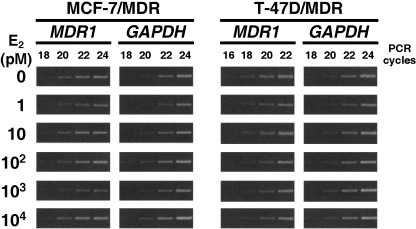
Reverse transcription polymerase chain reaction (RT‐PCR) analysis of the MDR1 mRNA expression levels in both MCF‐7/MDR and T‐47D/MDR cells. Cells were cultured in basal medium in the absence or presence of the indicated concentrations of E2 for 4 days. Exponentially growing cells were harvested and total RNA was extracted. First‐strand cDNAs were synthesized with 0.3 µg of total RNA, and an MDR1 cDNA fragment (702 bp) was subsequently amplified by PCR using the indicated cycles. The amplification of GAPDH mRNA (551 bp fragment) was performed as an internal control.
The effects of estradiol on P‐gp‐mediated transport and resistance. We examined the effects of either 1 or 100 pM E2 treatment on the cellular accumulation of rhodamine 123 and vincristine in the MCF‐7 and MCF‐7/MDR cells. MCF‐7/MDR cells treated with 100 pM E2 showed higher rhodamine 123 uptake, compared with 1 pM E2 treatment (Fig. 6a). In contrast, MCF‐7 cells treated with either 1 or 100 pM E2 showed similar levels of rhodamine 123 uptake (Fig. 6a). MCF‐7 cells showed higher rhodamine 123 uptake than MCF‐7/MDR cells for both E2 treatments.
Figure 6.
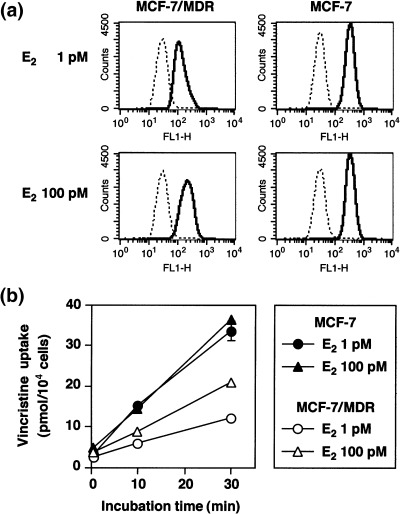
Analysis of rhodamine 123 and [3H]vincristine uptake in E2‐treated MCF‐7/MDR cells. (a) Rhodamine 123 uptake. MCF‐7 and MCF‐7/MDR cells were cultured in basal medium in the presence of either 1 or 100 pM E2 for 4 days. After trypsinization, the cells were incubated with (––) or without (‐‐‐) 100 nM rhodamine 123 in basal medium supplemented with the same concentrations of E2 for 20 min. After washing of the cells, the cellular uptake of rhodamine 123 was measured by FACSCalibur. (b) [3H]Vincristine uptake. MCF‐7 (▴•) and MCF‐7/MDR (▵○) cells were cultured in basal medium in the presence of either 1 pM (•○) or 100 pM (▴▵) E2 for 4 days. The cells were then washed and incubated with 50 nM [3H]vincristine for 0.5, 10, and 30 min in basal medium supplemented with the same concentration of E2. After washing of the cells, the cells were lyzed, and [3H]vincristine uptake was measured by liquid scintillation. Data are the mean ± SD values from triplicate determinations. Where a horizontal bar is not shown, the SD is low and contained within the symbol.
We additionally examined vincristine uptake in E2‐treated cells. MCF‐7/MDR cells treated with 100 pM E2 showed higher [3H]vincristine uptake compared to the 1 pM E2 treatment (Fig. 6b). In contrast, MCF‐7 cells treated with either 1 or 100 pM E2 showed similar levels of [3H]vincristine uptake, which was at higher levels than MCF‐7/MDR cells in both cases (Fig. 6b). These results therefore suggest that the down‐regulation of P‐gp by E2 results in an increase of the cellular uptake of P‐gp substrates.
We then examined the effects of E2 on cellular drug resistance. As shown in Figure 7a, MCF‐7/MDR cells treated with 100 pM E2 show a higher sensitivity to vincristine than the same cells treated with 1 pM E2. The IC50 values for vincristine in MCF‐7 cells in the presence of 1 and 100 pM E2 were determined to be 0.35 ± 0.04 and 0.34 ± 0.01 nM, respectively (Fig. 7a). In contrast, the IC50 values for vincristine in MCF‐7/MDR cells in the presence of 1 and 100 pM E2 were measured at 68.7 ± 2.9 and 8.4 ± 0.2 nM, respectively (Fig. 7a). Hence, MCF‐7/MDR cells treated with 100 pM E2 showed an eight‐fold higher sensitivity to vincristine than the same cells treated with 1 pM E2. The timecourse of the P‐gp expression profile in the E2‐treated MCF‐7/MDR cells further supports our hypothesis that the suppression of P‐gp expression by E2 leads to the sensitization of cells to anticancer agents (Fig. 7b).
Figure 7.
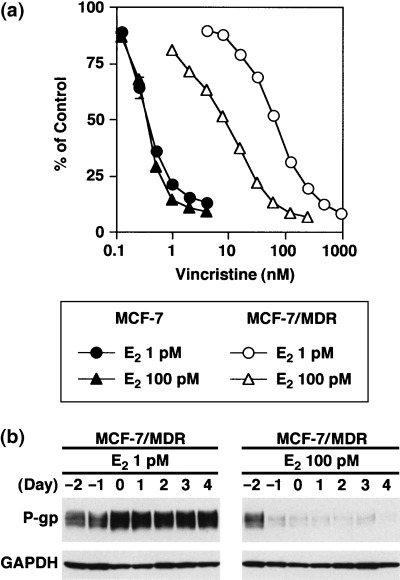
Drug sensitivity levels of E2‐treated MCF‐7/MDR cells. (a) Drug sensitivity to vincristine. MCF‐7 cells (•▴) and MCF‐7/MDR cells (○▵) were cultured in basal medium in the presence of either 1 pM (•○) or 100 pM (▴▵) E2 for 2 days. Vincristine was then added to the cultures and the cells were incubated for an additional 4 days. Cell numbers were determined using a cell counter. Data are the mean ± SD values from triplicate determinations. Where a horizontal bar is not shown, the SD is low and contained within the symbol. (b) Timecourse analysis of the P‐gp expression levels in E2‐treated MCF‐7/MDR cells. MCF‐7/MDR cells were cultured in basal medium in the presence of either 1 or 100 pM E2 for up to 6 days. Cell pellets were obtained each day and cell lysates were subjected to western blot analysis with the anti‐P‐glycoprotein (P‐gp) monoclonal antibody, C219.
Discussion
In our previous study, we reported for the first time that the physiological levels of estrogens (10–100 pM) down‐regulate BCRP expression by post‐transcriptional processes without affecting the BCRP transcript levels.( 18 ) Because P‐gp also belongs to the ABC transporter superfamily, in addition to BCRP, we examined the effects of estrogens on P‐gp expression in our current study and demonstrate that E2‐mediated down‐regulation of P‐gp expression occurs in ER‐α‐positive human breast cancer cells.
It is significant that E2 down‐regulates P‐gp expression only in the ER‐α‐positive cells, MCF‐7/MDR and T‐47D/MDR, but not in the ER‐α‐negative cells, MDA‐MB‐231/MDR and NCI/ADR‐RES (Fig. 2). Estrone and diethylstilbestrol were also found to down‐regulate P‐gp expression in MCF‐7/MDR cells (Fig. 4a), but progesterone did not cause such effects (Fig. 4b). Moreover, the antiestrogen drug, tamoxifen, strongly reverses the E2‐mediated down‐regulation of P‐gp in MCF‐7/MDR cells (Fig. 4c). These results suggest that a functional ER‐α and its downstream pathways are important for estrogen‐mediated P‐gp down‐regulation.
In a previous study we demonstrated that estrogens down‐regulate BCRP expression without affecting its gene promoter activity.( 18 ) In this study we also screened the 60 cell line panel of the NCI for ER‐α‐ and P‐gp‐positive cells. However, the ER‐α‐positive MCF‐7 and T‐47D cells that we used in our present experiments do not express endogenous P‐gp. Moreover, NCI/ADR‐RES, a cell line in the NCI panel that does overexpress P‐gp, is likely to be of ovarian origin, and thus lacks any expression of ER‐α.( 22 ) We therefore established MDR1‐transduced cells, MCF‐7/MDR and T‐47D/MDR, to enable us to examine the effects of estrogens on P‐gp expression in ER‐α‐positive cells. We show herein that estrogens down‐regulate P‐gp expression in MDR1‐transduced cells, but there remains a possibility that estrogens may not exert such an effect in ER‐α‐positive human breast cancer cells, if they were to activate the MDR1 promoter. To clarify this point, the effects of estrogen on P‐gp expression in ER‐α‐positive human breast cancer cells that express endogenous P‐gp will need to be assessed in the near future, when such cell lines become available.
It has been reported that murine mdr mRNA is expressed at high levels in the gravid uterus and that these levels dramatically increase during pregnancy, compared with the relatively low levels of expression observed in the non‐gravid uterus.( 28 ) In addition, it was previously shown that mdr mRNA and murine P‐gp are induced at high levels in the uterine secretory epithelium by a combination of estrogen and progesterone treatments.( 29 ) In humans, the high expression levels of P‐gp in the syncytiotrophoblast of the placenta has been reported during the early phase of pregnancy.( 30 ) However, although these reports suggest a possible role for estrogen/progesterone in the control of P‐gp expression, most studies have focused only on the regulation of MDR1/mdr mRNA expression. In our present study, we have shown that estrogens down‐regulate P‐gp expression in ER‐α‐positive human breast cancer cells, without affecting MDR1 transcription levels. It is not clear at present whether our observations are in any way linked with the findings of previous studies of MDR1 regulation in the uterus, but our present data do suggest the possibility of a role for estrogens in the control of P‐gp expression in breast cancer cells and possibly also in normal breast tissues.
Clinical trials of P‐gp inhibitors have now been conducted against various malignancies, including advanced breast cancers.( 31 , 32 , 33 , 34 ) Tidefelt et al. examined the effects of the cyclosporinee derivative, PSC 833, on the concentration of daunorubicin in leukemic blast cells in vivo during treatment.( 35 ) They have shown that PSC 833 treatment results in a higher increase of cellular daunorubicin concentrations in P‐gp‐positive leukemic cells than in P‐gp‐negative leukemic cells. These results suggest that PSC 833, by interacting with P‐gp, can increase the cellular uptake of daunorubicin in leukemic blasts in vivo.( 35 ) However, the results of clinical trials using verapamil or other P‐gp inhibitors, in combination with either doxorubicin, vincristine, paclitaxel or epirubicin, against breast cancers have resulted in only minor responses, with PR rates of 10–20%. The evidence provided so far is therefore not entirely sufficient to evaluate the possible effectiveness of P‐gp inhibition during chemotherapies against breast cancer.
Tamoxifen has also been reported to overcome P‐gp‐mediated drug resistance( 36 ) and clinical trials of high oral doses of tamoxifen have been conducted to examine for possible MDR‐reversing effects.( 37 , 38 , 39 , 40 , 41 ) The earliest studies were conducted using tamoxifen alone, and subsequent studies used tamoxifen in combination with other MDR modulators. Unfortunately, these trials proved to be only moderately successful. The patients enrolled in these studies had presented with either colorectal or renal carcinomas, and it may thus be difficult to discuss the results of these studies in the context of our present analyzes. Human breast cancer cells grow in the presence of estrogens, which are supplied from the ovary and placenta. In the presence of estrogens, tamoxifen may increase the P‐gp expression of ER‐α‐positive cells. Hence, the possible effects of tamoxifen on the P‐gp expression levels in human breast cancer cells in vivo is an important area for future studies.
In conclusion, we find that estrogen decreases P‐gp expression in MDR1‐transduced, ER‐α‐positive human breast cancer cells in vitro via post‐transcriptional processes. Furthermore, E2‐mediated P‐gp down‐regulation induces a reduction in the cellular resistance to anticancer agents. These results may therefore serve to provide a better understanding of the expression control of ABC transporters. In addition, the modulation of P‐gp expression in breast cancer cells by small molecules may be a useful strategy for sensitizing such cells to anticancer agents.
Acknowledgments
This work was supported in part by grants from the Ministry of Education, Culture, Sports, Science and Technology, and the Ministry of Health, Labor and Welfare, Japan.
References
- 1. Riordan JR, Deuchars K, Kartner N, Alon N, Trent J, Ling V. Amplification of P‐glycoprotein genes in multidrug‐resistant mammalian cell lines. Nature 1985; 316: 817–19. [DOI] [PubMed] [Google Scholar]
- 2. Chen CJ, Chin JE, Ueda K et al. Internal duplication and homology with bacterial transport proteins in the mdr1 (P‐glycoprotein) gene from multidrug‐resistant human cells. Cell 1986; 47: 381–9. [DOI] [PubMed] [Google Scholar]
- 3. Shen DW, Fojo A, Chin JE et al. Human multidrug‐resistant cell lines: increased MDR1 expression can precede gene amplification. Science 1986; 232: 643–5. [DOI] [PubMed] [Google Scholar]
- 4. Gottesman MM, Hrycyna CA, Schoenlein PV, Germamm UA, Pastan I. Genetic analysis of the multidrug transporter. Annu Rev Genet 1995; 29: 607–49. [DOI] [PubMed] [Google Scholar]
- 5. Ueda K, Cardarelli C, Gottesman MM, Pastan I. Expression of full‐length cDNA for the human ‘MDR1’ gene confers resistance to colchicines, doxorubicin, and vinblastine. Proc Natl Acad Sci USA 1987; 84: 3004–8. [DOI] [PMC free article] [PubMed] [Google Scholar]
- 6. Pirker R, Wallnar J, Geissler K et al. MDR1 gene expression and treatment outcome in acute myeloid leukemia. J Natl Cancer Inst 1991; 83: 708–12. [DOI] [PubMed] [Google Scholar]
- 7. Goldstein LJ, Galski H, Fojo A et al. Expression of a multidrug resistance gene in human cancers. J Natl Cancer Inst 1989; 81: 116–24. [DOI] [PubMed] [Google Scholar]
- 8. Tsuruo T, Iida H, Tsukagoshi S, Sakurai Y. Overcoming of vincristine resistance in P388 leukemia in vivo and in vitro through enhanced cytotoxicity of vincristine and vinblastine by verapamil. Cancer Res 1981; 41: 1967–72. [PubMed] [Google Scholar]
- 9. Chambers SK, Hait WN, Kacinski BM, Keyes SR, Handschumacher RE. Enhancement of anthracycline growth inhibition in parent and multidrug‐resistant Chinese hamster ovary cells by cyclosporine A and its analogues. Cancer Res 1989; 49: 6275–9. [PubMed] [Google Scholar]
- 10. Fojo AT, Ueda K, Slamon DJ, Poplack DG, Gottesman MM, Pastan I. Expression of a multidrug‐resistance gene in human tumors and tissues. Proc Natl Acad Sci USA 1987; 84: 265–9. [DOI] [PMC free article] [PubMed] [Google Scholar]
- 11. Cordon‐Cardo C, O’Brien JP, Casals D et al. Multidrug‐resistance gene (P‐glycoprotein) is expressed by endothelial cells at blood–brain barrier sites. Proc Natl Acad Sci USA 1989; 86: 695–8. [DOI] [PMC free article] [PubMed] [Google Scholar]
- 12. Wilson WH, Jamis‐Dow C, Bryant G et al. Phase I and pharmacokinetic study of the multidrug resistance modulator dexverapamil with EPOCH chemotherapy. J Clin Oncol 1995; 13: 1985–94. [DOI] [PubMed] [Google Scholar]
- 13. Lum BL, Kaubisch S, Yahanda AM et al. Alteration of etoposide pharmacokinetics and pharmacodynamics by cyclosporine in a phase I trial to modulate multidrug resistance. J Clin Oncol 1992; 10: 1635–42. [DOI] [PubMed] [Google Scholar]
- 14. Imai Y, Tsukahara S, Ishikawa E, Tsuruo T, Sugimoto Y. Estrone and 17β‐estradiol reverse breast cancer resistance protein‐mediated multidrug resistance. Jpn J Cancer Res 2002; 93: 231–5. [DOI] [PMC free article] [PubMed] [Google Scholar]
- 15. Sugimoto Y, Tsukahara S, Imai Y, Sugimoto Y, Ueda K, Tsuruo T. Reversal of breast cancer resistance protein‐mediated drug resistance by estrogen antagonists and agonists. Mol Cancer Ther 2003; 2: 105–12. [PubMed] [Google Scholar]
- 16. Suzuki M, Suzuki H, Sugimoto Y, Sugiyama Y. ABCG2 transports sulfated conjugates of steroids and xenobiotics. J Biol Chem 2003; 278: 22644–9. [DOI] [PubMed] [Google Scholar]
- 17. Imai Y, Asada S, Tsukahara S, Ishikawa E, Tsuruo T, Sugimoto Y. Breast cancer resistance protein exports sulfated estrogens but not free estrogens. Mol Pharmacol 2003; 64: 610–8. [DOI] [PubMed] [Google Scholar]
- 18. Imai Y, Ishikawa E, Asada S, Sugimoto Y. Estrogen‐mediated post transcriptional down‐regulation of breast cancer resistance protein/ABCG2. Cancer Res 2005; 65: 596–604. [PubMed] [Google Scholar]
- 19. Sugimoto Y, Tsukahara S, Ishikawa E, Mitsuhashi J. Breast cancer resistance protein: molecular target for anticancer drug resistance and pharmacokinetics/pharmacodynamics. Cancer Sci 2005; 96: 457–65. [DOI] [PMC free article] [PubMed] [Google Scholar]
- 20. Kartner N, Evernden‐Porelle D, Bradley G, Ling V. Detection of P‐glycoprotein in multidrug‐resistant cell lines by monoclonal antibodies. Nature 1985; 316: 820–3. [DOI] [PubMed] [Google Scholar]
- 21. Okochi E, Iwahashi T, Ariyoshi K, Watabe H, Tsuruo T, Ono K. Establishment and evaluation of MRK16‐magnetic cell sorting assays for detecting low expression of multidrug resistance P‐glycoprotein using human leukemia cell lines and peripheral blood cells from healthy donors. J Immunol Meth 1995; 187: 127–37. [DOI] [PubMed] [Google Scholar]
- 22. Pirnia F, Breuleux M, Schneider E et al. Uncertain Identity of Doxorubicin‐Resistant MCF‐7 Cell Lines Expressing Mutated p53. J Natl Cancer Inst 2000; 92: 1535–6. [DOI] [PubMed] [Google Scholar]
- 23. Sugimoto Y, Aksentijevich I, Gottesman MM, Pastan I. Efficient expression of drug‐selectable genes in retroviral vectors under control of an internal ribosome entry site. Biotechnology 1994; 12: 694–8. [DOI] [PubMed] [Google Scholar]
- 24. Zhang S, Sugimoto Y, Shoshani T, Pastan I, Gottesman MM. A pHaMDR‐DHFR bicistronic expression system for mutation analysis of P‐glycoprotein. Meth Enzymol 1998; 292: 474–80. [DOI] [PubMed] [Google Scholar]
- 25. Sugimoto Y, Tsukahara S, Sato S et al. Drug‐selected co‐expression of P‐glycoprotein and gp91 in vivo from an MDR1‐bicistronic retrovirus vector Ha‐MDR‐IRES‐gp91. J Gene Med 2003; 5: 366–76. [DOI] [PubMed] [Google Scholar]
- 26. Kessel D, Beck WT, Kukuruga D, Schulz V. Characterization of multidrug resistance by fluorescent dyes. Cancer Res 1991; 51: 4665–70. [PubMed] [Google Scholar]
- 27. Batist G, Tulpule A, Sinha BK, Katki AG, Myers CE, Cowan KH. Over expression of a novel anionic glutathione transferase in multidrug‐resistant human breast cancer cells. J Biol Chem 1986; 261: 15544–9. [PubMed] [Google Scholar]
- 28. Arceci RJ, Croop JM, Horwitz SB, Housman D. The gene encoding multidrug resistance is induced and expressed at high levels during pregnancy in secretory epithelium of the uterus. Proc Natl Acad Sci USA 1988; 85: 4350–4. [DOI] [PMC free article] [PubMed] [Google Scholar]
- 29. Arceci RJ, Baas F, Raponi R, Horwitz SB, Housman D, Croop JM. Multidrug resistance gene expression is controlled by steroid hormones in the secretory epithelium of the uterus. Mol Reprod Dev 1990; 25: 101–9. [DOI] [PubMed] [Google Scholar]
- 30. Gil S, Saura R, Forestier F, Farinotti R. P‐glycoprotein expression of the human placenta during pregnancy. Placenta 2005; 26: 268–70. [DOI] [PubMed] [Google Scholar]
- 31. Tolcher AW, Cowan KH, Solomon D et al. Phase I crossover study of paclitaxel with r‐verapamil in patients with metastatic breast cancer. J Clin Oncol 1996; 14: 1173–84. [DOI] [PubMed] [Google Scholar]
- 32. Lehnert M, Mross K, Schuller J, Thuerlimann B, Kroeger N, Kupper H. Phase II trial of dexverapamil and epirubicin in patients with non‐responsive metastatic breast cancer. Br J Cancer 1998; 77: 1155–63. [DOI] [PMC free article] [PubMed] [Google Scholar]
- 33. Warner E, Hedley D, Andrulis I et al. Phase II study of dexverapamil plus anthracycline in patients with metastatic breast cancer who have progressed on the same anthracycline regimen. Clin Cancer Res 1998; 4: 1451–7. [PubMed] [Google Scholar]
- 34. Toppmeyer D, Seidman AD, Pollak M et al. Safety and efficacy of the multidrug resistance inhibitor Incel (biricodar; VX‐710) in combination with paclitaxel for advanced breast cancer refractory to paclitaxel. Clin Cancer Res 2002; 8: 670–8. [PubMed] [Google Scholar]
- 35. Tidefelt U, Liliemark J, Gruber A et al. P‐Glycoprotein inhibitor valspodar (PSC 833) increases the intracellular concentrations of daunorubicin in vivo in patients with P‐glycoprotein‐positive acute myeloid leukemia. J Clin Oncol 2000; 18: 1837–44. [DOI] [PubMed] [Google Scholar]
- 36. Ramu A, Glaubiger D, Fuks Z. Reversal of acquired resistance to doxorubicin in P388 murine leukemia cells by tamoxifen and other triparanol analogues. Cancer Res 1984; 44: 4392–5. [PubMed] [Google Scholar]
- 37. Millward MJ, Cantwell BM, Lien EA, Carmichael J, Harris AL. Intermittent high‐dose tamoxifen as a potential modifier of multidrug resistance. Eur J Cancer 1992; 28A: 805–10. [DOI] [PubMed] [Google Scholar]
- 38. Stuart NS, Philip P, Harris AL et al. High‐dose tamoxifen as an enhancer of etoposide cytotoxicity. Clinical effects and in vitro assessment in p‐glycoprotein expressing cell lines. Br J Cancer 1992; 66: 833–9. [DOI] [PMC free article] [PubMed] [Google Scholar]
- 39. Trump DL, Smith DC, Ellis PG et al. High‐dose oral tamoxifen, a potential multidrug‐resistance‐reversal agent: phase I trial in combination with vinblastine. J Natl Cancer Inst 1992; 84: 1811–16. [DOI] [PubMed] [Google Scholar]
- 40. Weinlander G, Kornek G, Raderer M, Hejna M, Tetzner C, Scheithauar W. Treatment of advanced colorectal cancer with doxorubicin combined with two potential multidrug‐resistance‐reversing agents: high‐dose oral tamoxifen and dexverapamil. J Cancer Res Clin Oncol 1997; 123: 452–5. [DOI] [PubMed] [Google Scholar]
- 41. Samuels BL, Hollis DR, Rosner GL et al. Modulation of vincristine resistance in metastatic renal cell carcinoma with cyclosporine A or tamoxifen: a cancer and leukemia group B study. Clin Cancer Res 1997; 3: 1977–84. [PubMed] [Google Scholar]